Financial Ratio Analysis: EasyJet PLC vs Ryanair - ACFI5020 Report
VerifiedAdded on 2023/04/21
|25
|5096
|190
Report
AI Summary
This report undertakes a comprehensive financial analysis of EasyJet PLC and its competitor, Ryanair, focusing on a five-year period. It begins with a comparative ratio analysis, examining profitability (operating profit, gross profit, and ROCE), liquidity (current and acid-test ratios), working capital efficiency (receivables and payables periods), and long-term financial structure (gearing ratio). The analysis uses financial data to assess each company's performance, offering insights into their strengths and weaknesses. The report then provides investment recommendations, considering the financial health of EasyJet and Ryanair, and their potential for investors. Finally, the report explores EasyJet's supply chain management system, discussing relevant models and challenges faced by the airline, concluding with a summary of findings and recommendations.
Running head: ACCOUNTING
Accounting
Name of the Student
Name of the University
Authors Note
Course ID
Accounting
Name of the Student
Name of the University
Authors Note
Course ID
Paraphrase This Document
Need a fresh take? Get an instant paraphrase of this document with our AI Paraphraser
1ACCOUNTING
Table of Contents
Brief Overview:..........................................................................................................................2
Task One - Ratio Analysis:........................................................................................................2
Profitability Ratios:................................................................................................................2
Liquidity Ratios:.....................................................................................................................6
Working Capital Efficiency Ratios:.......................................................................................9
Long term financial structure ratios:....................................................................................11
Investors Perspective Ratio:.................................................................................................12
Task Two: Recommendation to Buy, Sell or Hold for investors and potential Investors:......14
Task Three: Supply Chain Management System of Easy Jet..................................................15
Types of Models in Supply Chain Management......................................................................16
Issues faced by Easy Jet...........................................................................................................18
References:...............................................................................................................................19
Appendix: Workings................................................................................................................21
2ACCOUNTING
Brief Overview:
Easy Jet Plc is one of the British low cost airline company having its headquarter in
London Luton Airport. The airline operates both in the overseas and domestic segment
having greater than 820 routes in around 30 nations. Ryanair on the other hand is Irish low-
cost airline that has its headquarter in Dublin Ireland. The company has its primary
operations at Dublin and London Stanstead airports.
The present report here provides a comparative analysis of performance between Easy
Jet Plc and its competitor Ryanair. The report would consider the five-year analysis of
financial ratio between Easy Jet Plc and benchmarking the same with its competitor Ryanair.
Later the report would also determine the rationale for making investment in the shares of
EasyJet Plc from the perspective of investors. Finally, analysis of EasyJet supply chain
management process would be considered in this report with an appropriate conclusion
supporting the analysis.
Task One - Ratio Analysis:
Profitability Ratios:
Operating Profit:
This ratio measures the percentage of revenues that are made up from the operating
income (Deegan 2013).
Operating Profit Ratio = (Operating Income / Net Sales) x 100
Years 2013 2014 2015 2016 2017
Operating Income 497 581 688 498 404
Net Sales 4258 4527 4686 4669 5047
Workings 497/4258 581/4527 688/1646 498/4669 404/5047
Operating Profit Ratio 11.67% 12.83% 14.68% 10.67% 8.00%
Accounting Ratios for EasyJet Plc
Profitability Ratios
Operating Profit Ratio
⊘ This is a preview!⊘
Do you want full access?
Subscribe today to unlock all pages.
Trusted by 1+ million students worldwide
3ACCOUNTING
Years 2013 2014 2015 2016 2017
Operating Income 718.2 658.6 1042.9 1460.1 1534
Net Sales 4884 5036.7 5654 6535.8 6647.8
Workings 718.2/4884 658.6/5036.7 1042.9/5654 1460.1/6535.8 1534/6647.8
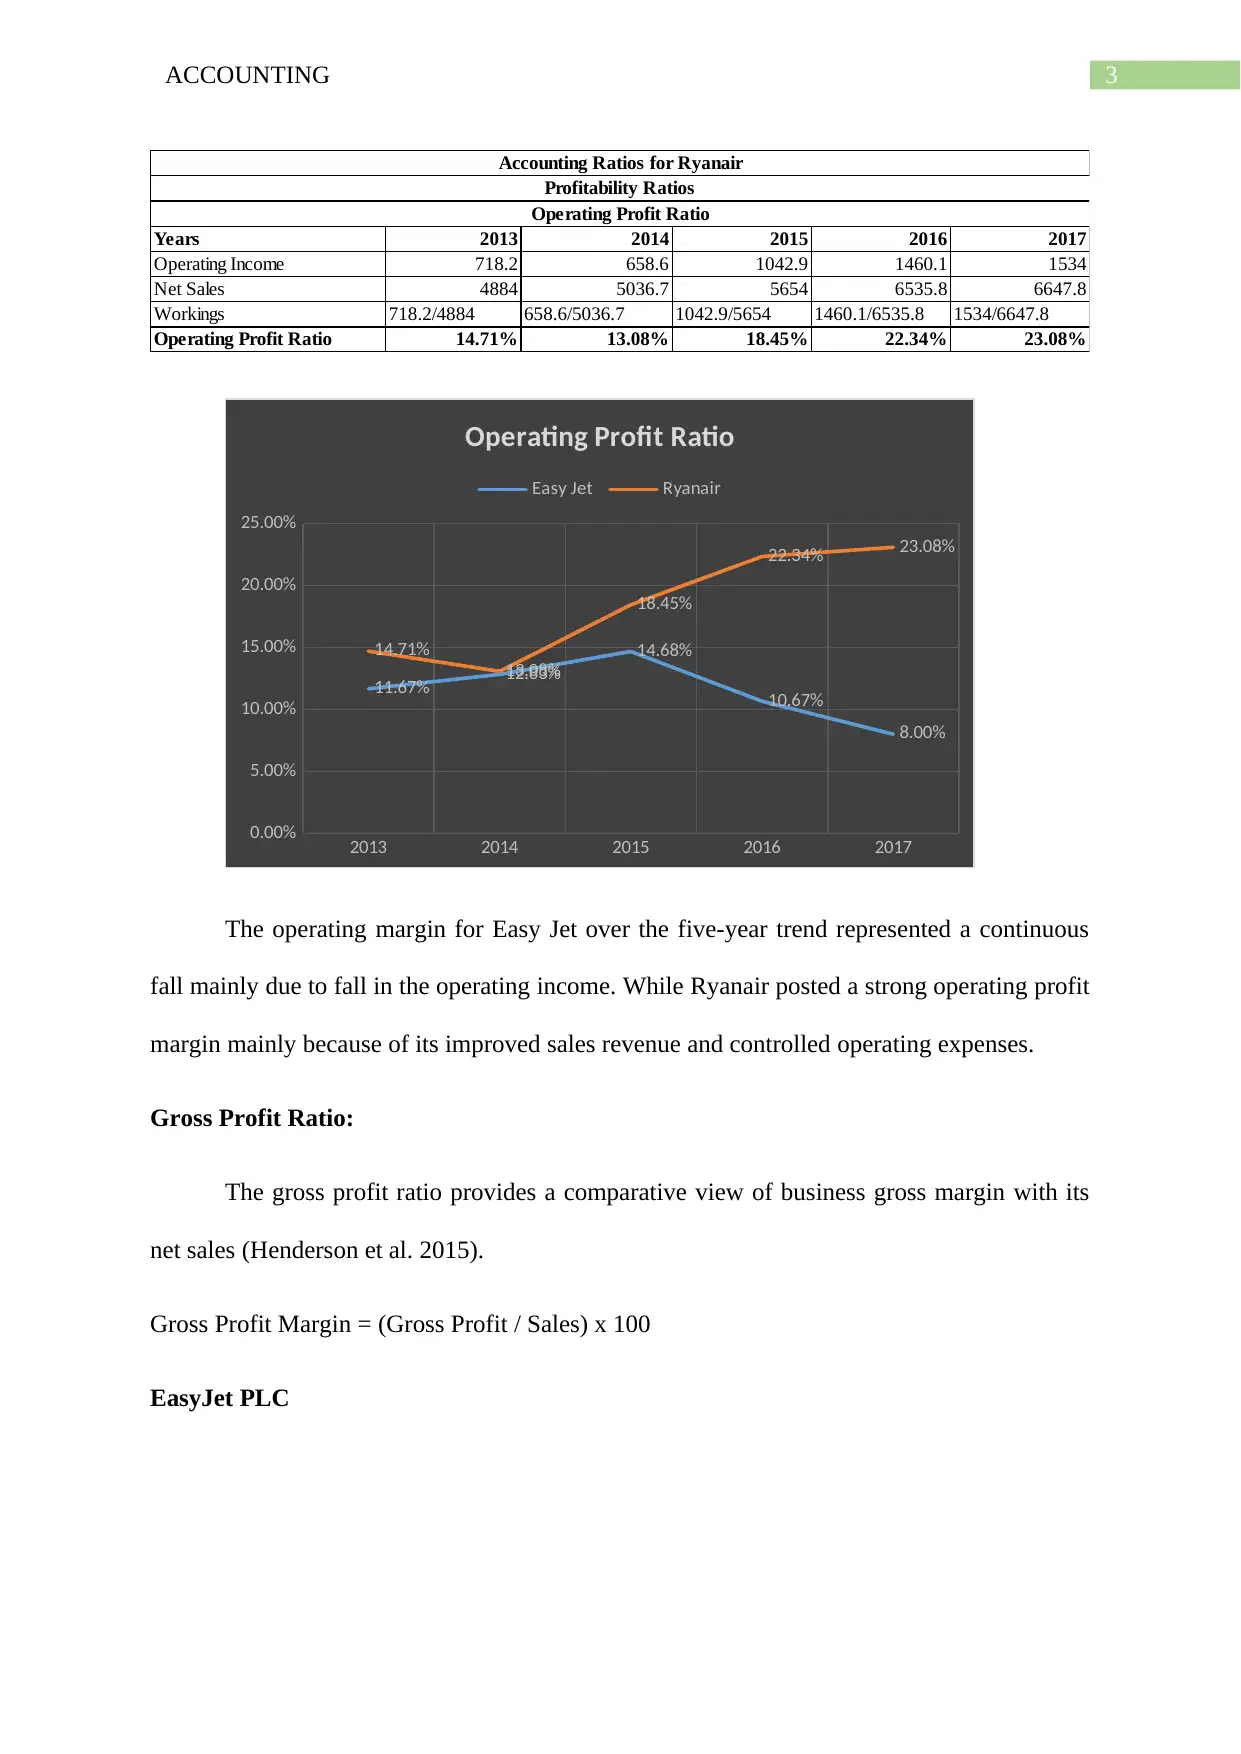
Operating Profit Ratio 14.71% 13.08% 18.45% 22.34% 23.08%
Accounting Ratios for Ryanair
Profitability Ratios
Operating Profit Ratio
2013 2014 2015 2016 2017
0.00%
5.00%
10.00%
15.00%
20.00%
25.00%
11.67% 12.83%
14.68%
10.67%
8.00%
14.71%
13.08%
18.45%
22.34% 23.08%
Operating Profit Ratio
Easy Jet Ryanair
The operating margin for Easy Jet over the five-year trend represented a continuous
fall mainly due to fall in the operating income. While Ryanair posted a strong operating profit
margin mainly because of its improved sales revenue and controlled operating expenses.
Gross Profit Ratio:
The gross profit ratio provides a comparative view of business gross margin with its
net sales (Henderson et al. 2015).
Gross Profit Margin = (Gross Profit / Sales) x 100
EasyJet PLC
Years 2013 2014 2015 2016 2017
Operating Income 718.2 658.6 1042.9 1460.1 1534
Net Sales 4884 5036.7 5654 6535.8 6647.8
Workings 718.2/4884 658.6/5036.7 1042.9/5654 1460.1/6535.8 1534/6647.8
Operating Profit Ratio 14.71% 13.08% 18.45% 22.34% 23.08%
Accounting Ratios for Ryanair
Profitability Ratios
Operating Profit Ratio
2013 2014 2015 2016 2017
0.00%
5.00%
10.00%
15.00%
20.00%
25.00%
11.67% 12.83%
14.68%
10.67%
8.00%
14.71%
13.08%
18.45%
22.34% 23.08%
Operating Profit Ratio
Easy Jet Ryanair
The operating margin for Easy Jet over the five-year trend represented a continuous
fall mainly due to fall in the operating income. While Ryanair posted a strong operating profit
margin mainly because of its improved sales revenue and controlled operating expenses.
Gross Profit Ratio:
The gross profit ratio provides a comparative view of business gross margin with its
net sales (Henderson et al. 2015).
Gross Profit Margin = (Gross Profit / Sales) x 100
EasyJet PLC
Paraphrase This Document
Need a fresh take? Get an instant paraphrase of this document with our AI Paraphraser
4ACCOUNTING
Years 2013 2014 2015 2016 2017
Sales Revenue 4258 4527 4686 4669 5047
Cost of Sales 3547 3704 3506 3665 4022
Gross Profit 711 823 1180 1004 1025
Workings 4258/711 4527/823 4686/1180 4669/1004 5047/1025
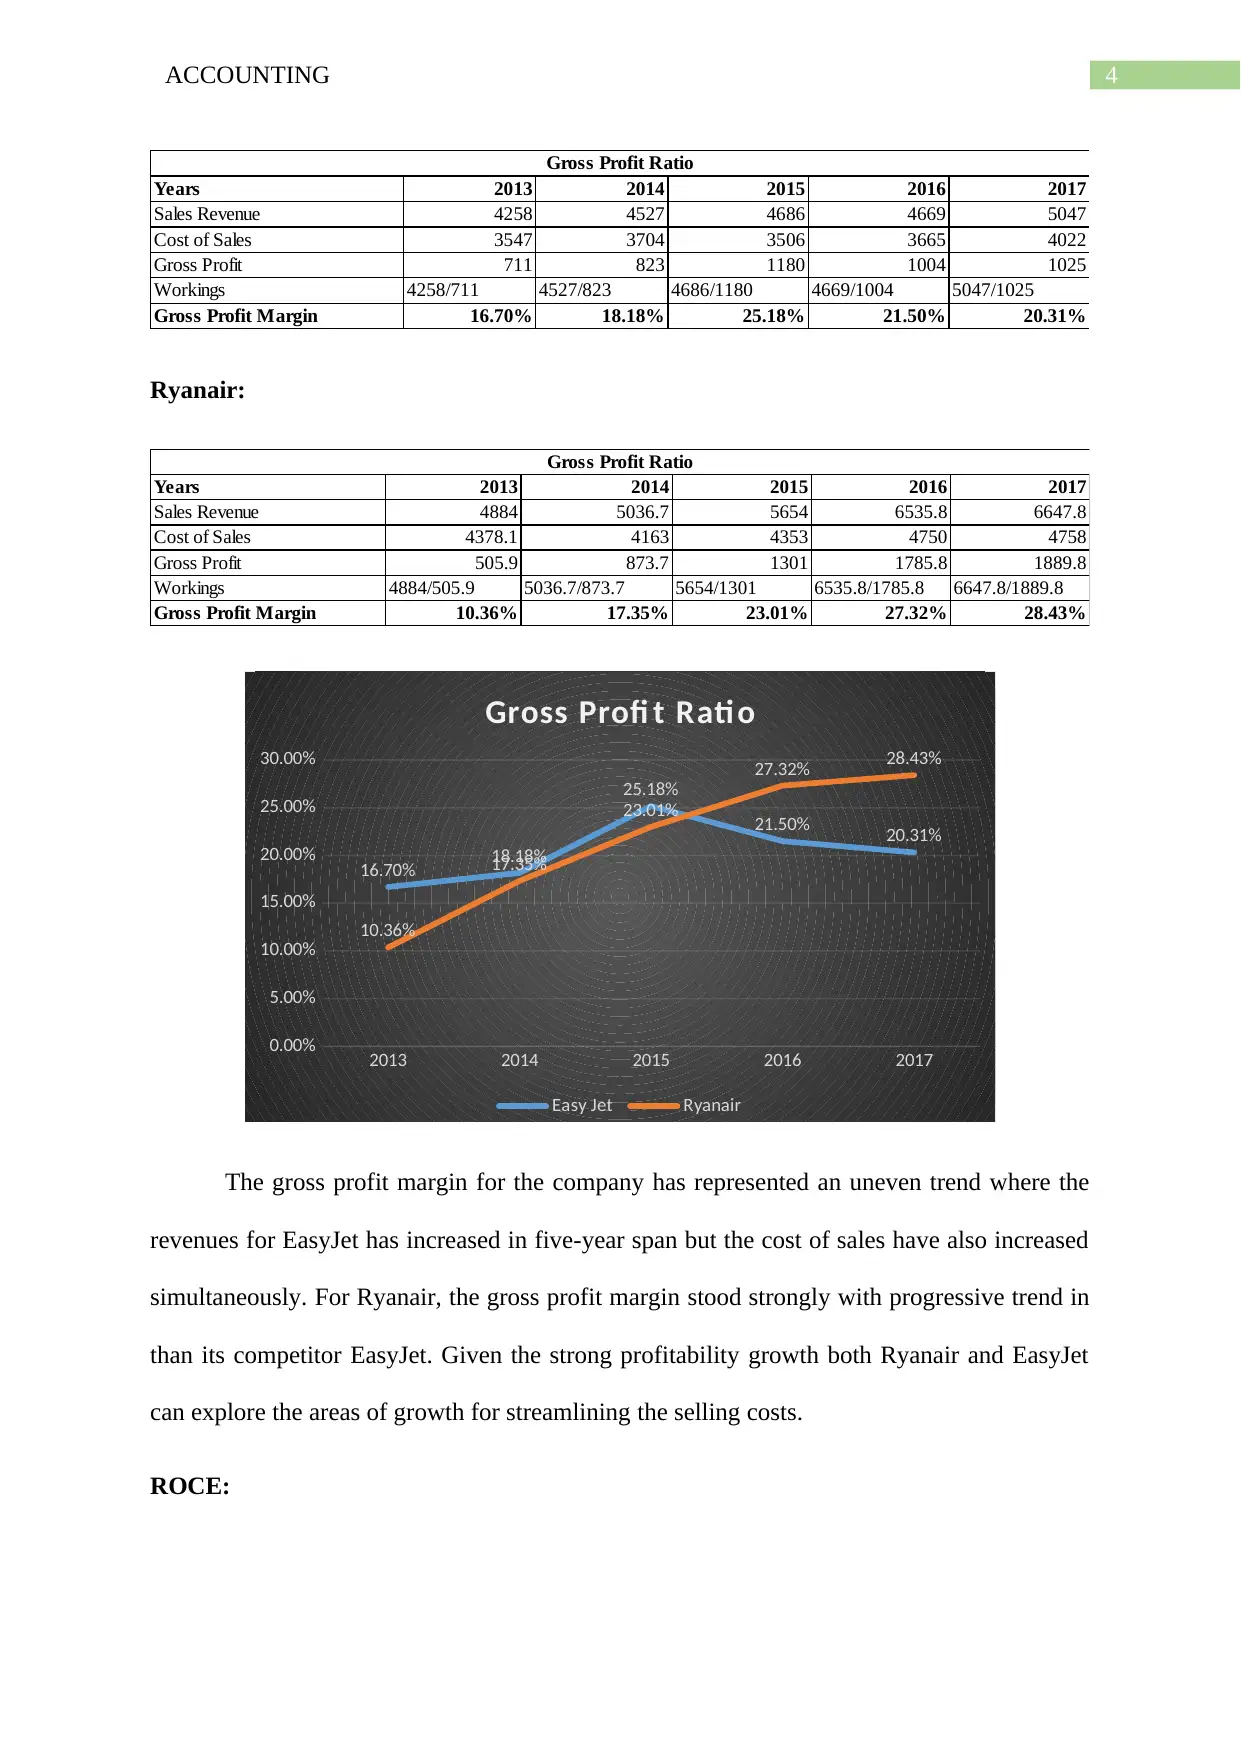
Gross Profit Margin 16.70% 18.18% 25.18% 21.50% 20.31%
Gross Profit Ratio
Ryanair:
Years 2013 2014 2015 2016 2017
Sales Revenue 4884 5036.7 5654 6535.8 6647.8
Cost of Sales 4378.1 4163 4353 4750 4758
Gross Profit 505.9 873.7 1301 1785.8 1889.8
Workings 4884/505.9 5036.7/873.7 5654/1301 6535.8/1785.8 6647.8/1889.8
Gross Profit Margin 10.36% 17.35% 23.01% 27.32% 28.43%
Gross Profit Ratio
2013 2014 2015 2016 2017
0.00%
5.00%
10.00%
15.00%
20.00%
25.00%
30.00%
16.70% 18.18%
25.18%
21.50% 20.31%
10.36%
17.35%
23.01%
27.32% 28.43%
Gross Profi t Rati o
Easy Jet Ryanair
The gross profit margin for the company has represented an uneven trend where the
revenues for EasyJet has increased in five-year span but the cost of sales have also increased
simultaneously. For Ryanair, the gross profit margin stood strongly with progressive trend in
than its competitor EasyJet. Given the strong profitability growth both Ryanair and EasyJet
can explore the areas of growth for streamlining the selling costs.
ROCE:
Years 2013 2014 2015 2016 2017
Sales Revenue 4258 4527 4686 4669 5047
Cost of Sales 3547 3704 3506 3665 4022
Gross Profit 711 823 1180 1004 1025
Workings 4258/711 4527/823 4686/1180 4669/1004 5047/1025
Gross Profit Margin 16.70% 18.18% 25.18% 21.50% 20.31%
Gross Profit Ratio
Ryanair:
Years 2013 2014 2015 2016 2017
Sales Revenue 4884 5036.7 5654 6535.8 6647.8
Cost of Sales 4378.1 4163 4353 4750 4758
Gross Profit 505.9 873.7 1301 1785.8 1889.8
Workings 4884/505.9 5036.7/873.7 5654/1301 6535.8/1785.8 6647.8/1889.8
Gross Profit Margin 10.36% 17.35% 23.01% 27.32% 28.43%
Gross Profit Ratio
2013 2014 2015 2016 2017
0.00%
5.00%
10.00%
15.00%
20.00%
25.00%
30.00%
16.70% 18.18%
25.18%
21.50% 20.31%
10.36%
17.35%
23.01%
27.32% 28.43%
Gross Profi t Rati o
Easy Jet Ryanair
The gross profit margin for the company has represented an uneven trend where the
revenues for EasyJet has increased in five-year span but the cost of sales have also increased
simultaneously. For Ryanair, the gross profit margin stood strongly with progressive trend in
than its competitor EasyJet. Given the strong profitability growth both Ryanair and EasyJet
can explore the areas of growth for streamlining the selling costs.
ROCE:
5ACCOUNTING
This ratio evaluates the profitability of an organization and the efficiency through
which a firm employs its capital (Lin et al. 2015).
EasyJet PLC:
Years 2013 2014 2015 2016 2017
Operting Profit 497 581 688 498 404
Total Assets 4412 4482 4828 5505 5971
Current Liabilities 1379 1420 1768 1573 1670
Capital Employed 3033 3062 3060 3932 4301
Workings 497/3033 581/3062 688/3060 498/3932 404/4301
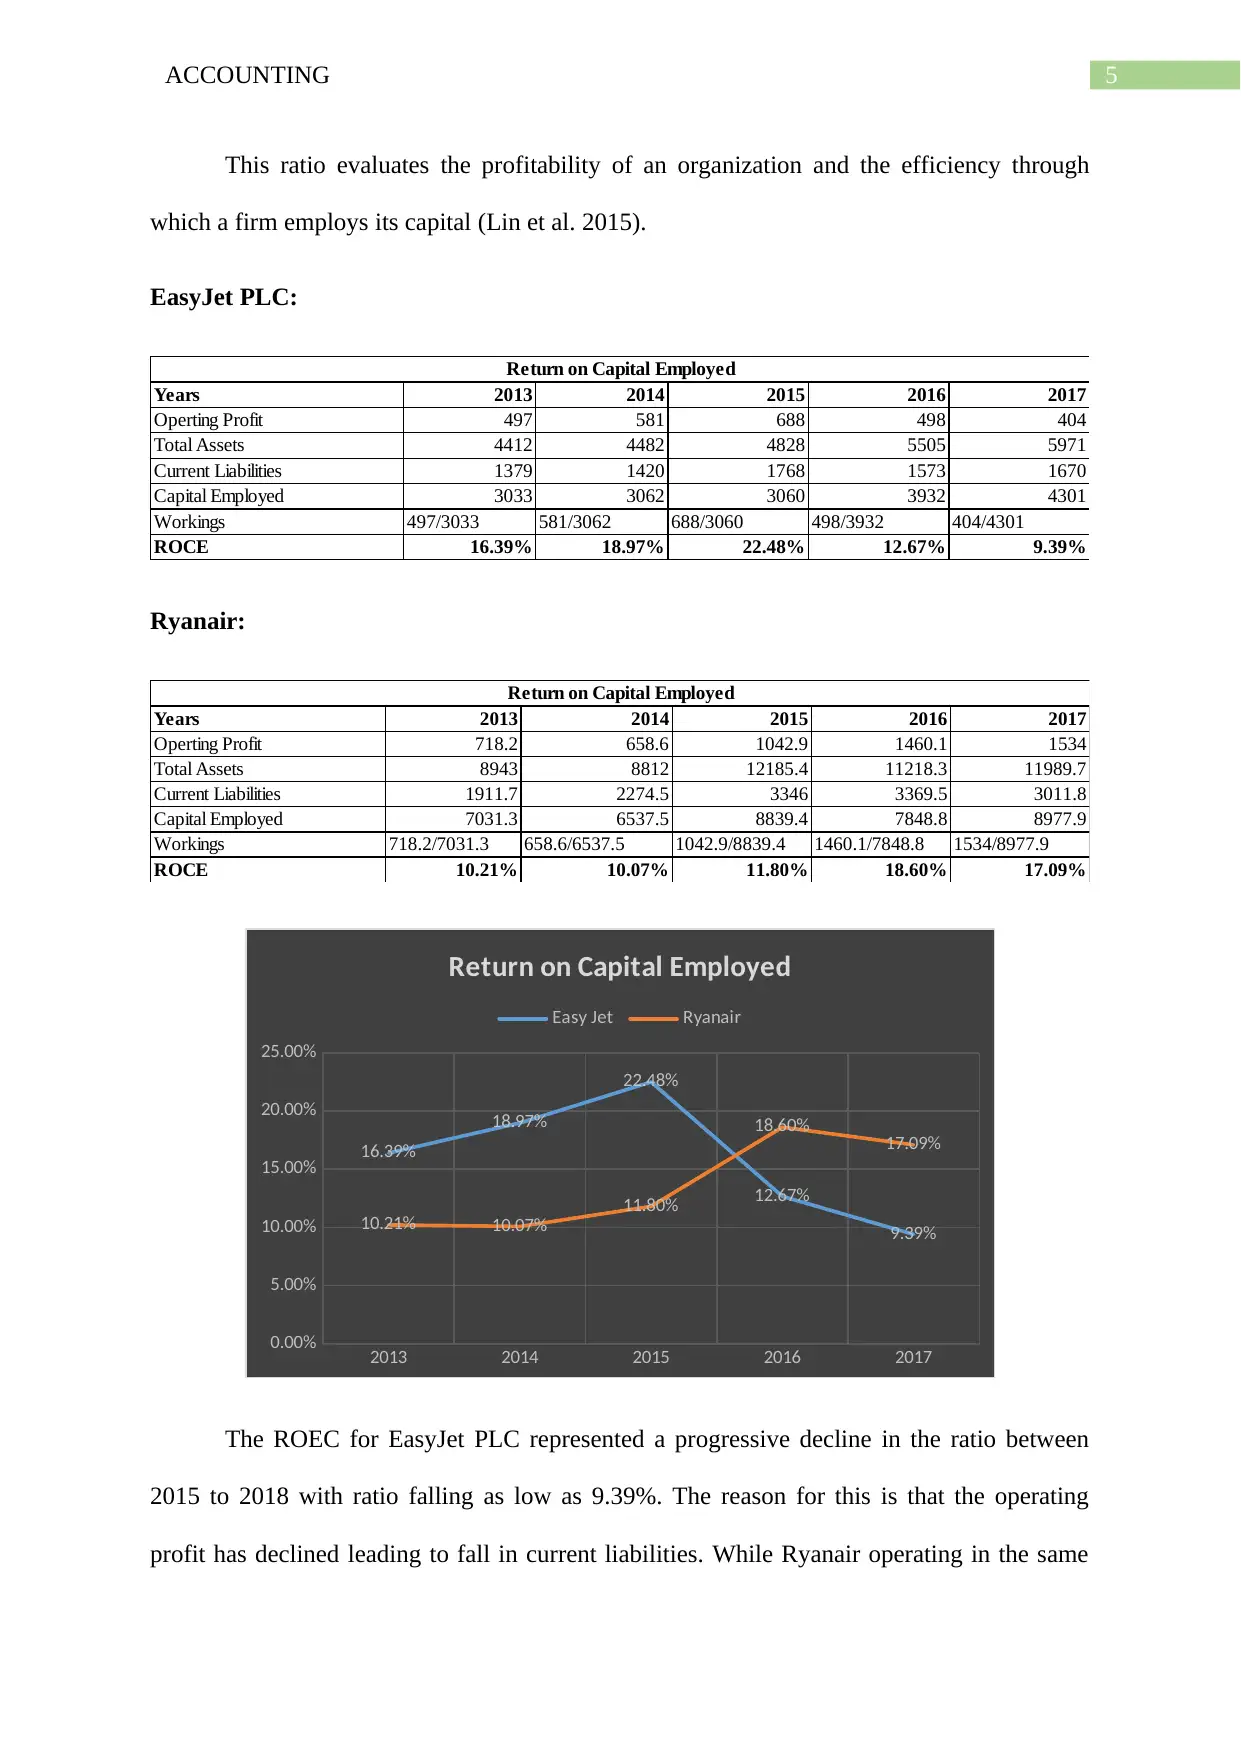
ROCE 16.39% 18.97% 22.48% 12.67% 9.39%
Return on Capital Employed
Ryanair:
Years 2013 2014 2015 2016 2017
Operting Profit 718.2 658.6 1042.9 1460.1 1534
Total Assets 8943 8812 12185.4 11218.3 11989.7
Current Liabilities 1911.7 2274.5 3346 3369.5 3011.8
Capital Employed 7031.3 6537.5 8839.4 7848.8 8977.9
Workings 718.2/7031.3 658.6/6537.5 1042.9/8839.4 1460.1/7848.8 1534/8977.9
ROCE 10.21% 10.07% 11.80% 18.60% 17.09%
Return on Capital Employed
2013 2014 2015 2016 2017
0.00%
5.00%
10.00%
15.00%
20.00%
25.00%
16.39%
18.97%
22.48%
12.67%
9.39%
10.21% 10.07%
11.80%
18.60% 17.09%
Return on Capital Employed
Easy Jet Ryanair
The ROEC for EasyJet PLC represented a progressive decline in the ratio between
2015 to 2018 with ratio falling as low as 9.39%. The reason for this is that the operating
profit has declined leading to fall in current liabilities. While Ryanair operating in the same
This ratio evaluates the profitability of an organization and the efficiency through
which a firm employs its capital (Lin et al. 2015).
EasyJet PLC:
Years 2013 2014 2015 2016 2017
Operting Profit 497 581 688 498 404
Total Assets 4412 4482 4828 5505 5971
Current Liabilities 1379 1420 1768 1573 1670
Capital Employed 3033 3062 3060 3932 4301
Workings 497/3033 581/3062 688/3060 498/3932 404/4301
ROCE 16.39% 18.97% 22.48% 12.67% 9.39%
Return on Capital Employed
Ryanair:
Years 2013 2014 2015 2016 2017
Operting Profit 718.2 658.6 1042.9 1460.1 1534
Total Assets 8943 8812 12185.4 11218.3 11989.7
Current Liabilities 1911.7 2274.5 3346 3369.5 3011.8
Capital Employed 7031.3 6537.5 8839.4 7848.8 8977.9
Workings 718.2/7031.3 658.6/6537.5 1042.9/8839.4 1460.1/7848.8 1534/8977.9
ROCE 10.21% 10.07% 11.80% 18.60% 17.09%
Return on Capital Employed
2013 2014 2015 2016 2017
0.00%
5.00%
10.00%
15.00%
20.00%
25.00%
16.39%
18.97%
22.48%
12.67%
9.39%
10.21% 10.07%
11.80%
18.60% 17.09%
Return on Capital Employed
Easy Jet Ryanair
The ROEC for EasyJet PLC represented a progressive decline in the ratio between
2015 to 2018 with ratio falling as low as 9.39%. The reason for this is that the operating
profit has declined leading to fall in current liabilities. While Ryanair operating in the same
⊘ This is a preview!⊘
Do you want full access?
Subscribe today to unlock all pages.
Trusted by 1+ million students worldwide
6ACCOUNTING
industry posted a progressive ROCE during five-year span with as high as 17.09 in 2017
mainly because of lower cost of operations.
Liquidity Ratios:
Current Ratio:
This ratio evaluates the position of liquidity for a business in order to determine the
short-term and long term obligations (Macve 2015).
Formula = Current Assets / Current Liabilities
EasyJet Plc
Years 2013 2014 2015 2016 2017
Current Assets 1448 1261 1279 1454 1734
Current Liabilities 1379 1420 1768 1573 1670
Workings 1448/1379 1261/1420 1279/1769 1454/1573 1734/1670
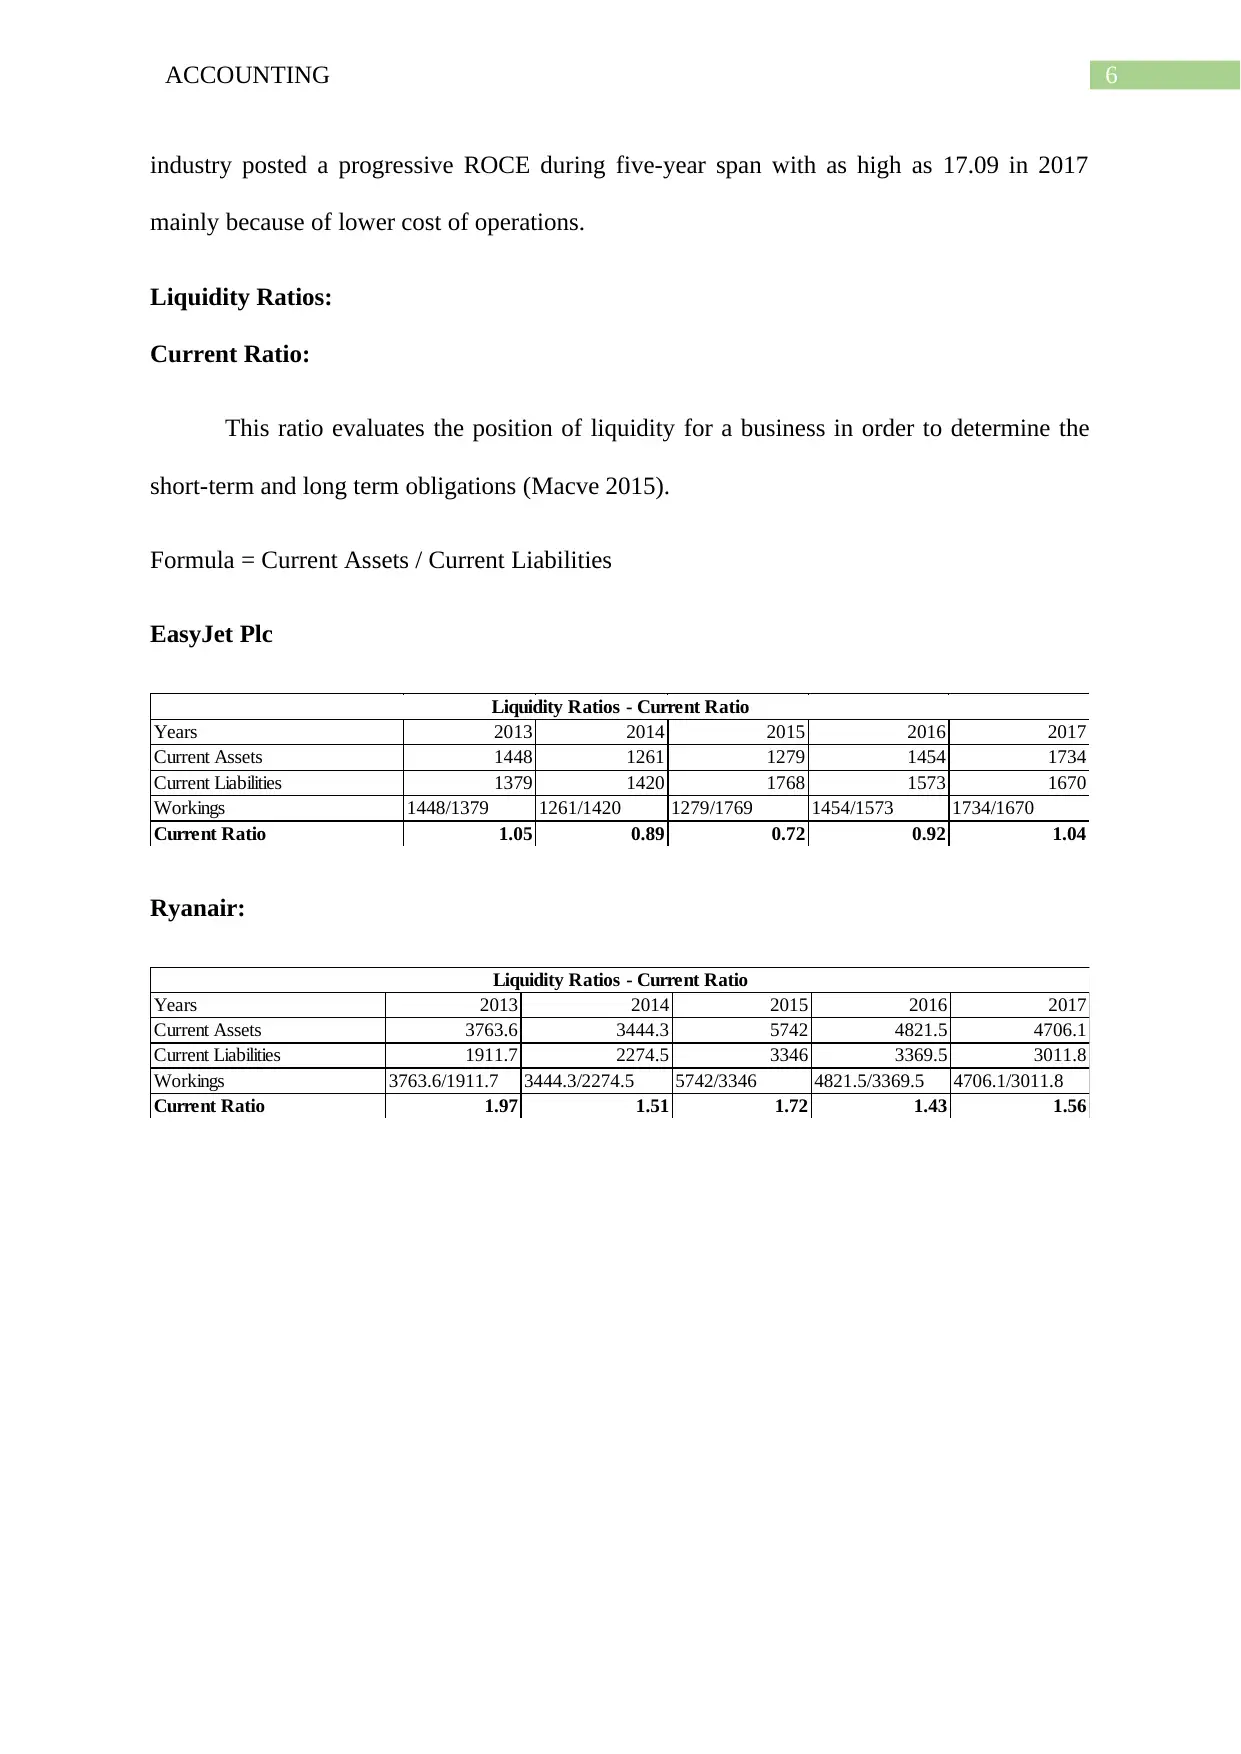
Current Ratio 1.05 0.89 0.72 0.92 1.04
Liquidity Ratios - Current Ratio
Ryanair:
Years 2013 2014 2015 2016 2017
Current Assets 3763.6 3444.3 5742 4821.5 4706.1
Current Liabilities 1911.7 2274.5 3346 3369.5 3011.8
Workings 3763.6/1911.7 3444.3/2274.5 5742/3346 4821.5/3369.5 4706.1/3011.8
Current Ratio 1.97 1.51 1.72 1.43 1.56
Liquidity Ratios - Current Ratio
industry posted a progressive ROCE during five-year span with as high as 17.09 in 2017
mainly because of lower cost of operations.
Liquidity Ratios:
Current Ratio:
This ratio evaluates the position of liquidity for a business in order to determine the
short-term and long term obligations (Macve 2015).
Formula = Current Assets / Current Liabilities
EasyJet Plc
Years 2013 2014 2015 2016 2017
Current Assets 1448 1261 1279 1454 1734
Current Liabilities 1379 1420 1768 1573 1670
Workings 1448/1379 1261/1420 1279/1769 1454/1573 1734/1670
Current Ratio 1.05 0.89 0.72 0.92 1.04
Liquidity Ratios - Current Ratio
Ryanair:
Years 2013 2014 2015 2016 2017
Current Assets 3763.6 3444.3 5742 4821.5 4706.1
Current Liabilities 1911.7 2274.5 3346 3369.5 3011.8
Workings 3763.6/1911.7 3444.3/2274.5 5742/3346 4821.5/3369.5 4706.1/3011.8
Current Ratio 1.97 1.51 1.72 1.43 1.56
Liquidity Ratios - Current Ratio
Paraphrase This Document
Need a fresh take? Get an instant paraphrase of this document with our AI Paraphraser
7ACCOUNTING
2013 2014 2015 2016 2017
0.00
0.50
1.00
1.50
2.00
2.50
1.05 0.89
0.72
0.92 1.04
1.97
1.51
1.72
1.43 1.56
Current Rati o
Easy Jet Ryanair
The current ratio for EasyJet during the year stood less than one while in 2017 it
marginally increased to 1.04. This signifies that there is a larger proportion of EasyJet current
liabilities than its current assets, meaning that the EasyJet has less potential of meeting short
term obligations. While the current ratio for Ryanair has been fluctuating over five-year span
but stood greater than one, meaning that Ryanair is better placed to meet its short-term debt
obligations. Ryanair is better placed than EasyJet in terms of liquidity to meet its short term
obligations.
Acid-Test Ratio:
The acid-test ratio is also regarded as quick ratio that assess the ability of a firm in
meeting their current liabilities whenever it becomes due from its quick assets (Brigham et al.
2016).
Formula = Current Assets – Inventory – Prepaid Expenses / Current Liabilities
EasyJet PLC
8ACCOUNTING
Years 2013 2014 2015 2016 2017
Current Assets 1448 1261 1279 1454 1734
Derivative Financial Instrument 53 17 128 268 131
Current Liabilities 1379 1420 1768 1573 1670
Workings (1448-53)1379 (1261-17)/1420 (1279-128)/1768 (1454-268)/1573 (1734-131)/1670
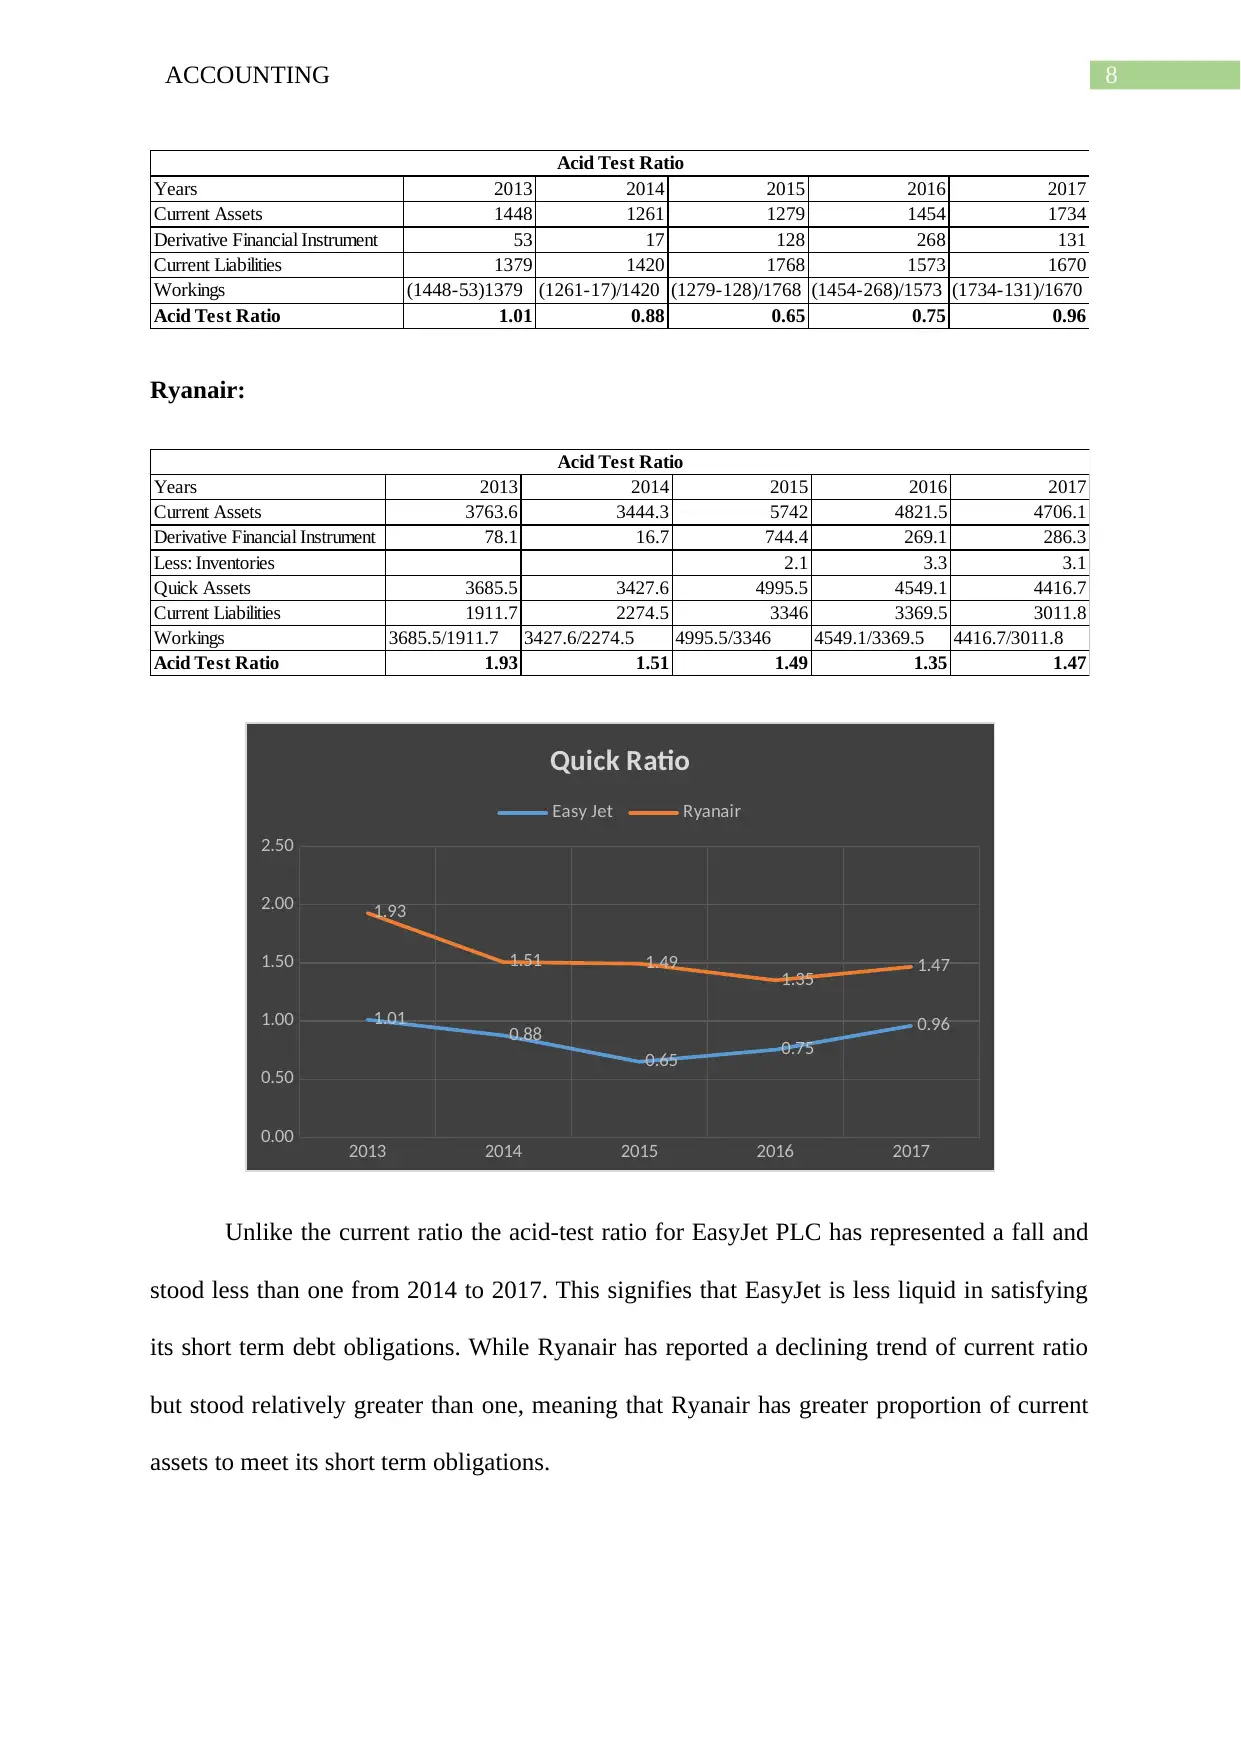
Acid Test Ratio 1.01 0.88 0.65 0.75 0.96
Acid Test Ratio
Ryanair:
Years 2013 2014 2015 2016 2017
Current Assets 3763.6 3444.3 5742 4821.5 4706.1
Derivative Financial Instrument 78.1 16.7 744.4 269.1 286.3
Less: Inventories 2.1 3.3 3.1
Quick Assets 3685.5 3427.6 4995.5 4549.1 4416.7
Current Liabilities 1911.7 2274.5 3346 3369.5 3011.8
Workings 3685.5/1911.7 3427.6/2274.5 4995.5/3346 4549.1/3369.5 4416.7/3011.8
Acid Test Ratio 1.93 1.51 1.49 1.35 1.47
Acid Test Ratio
2013 2014 2015 2016 2017
0.00
0.50
1.00
1.50
2.00
2.50
1.01 0.88
0.65 0.75
0.96
1.93
1.51 1.49 1.35 1.47
Quick Ratio
Easy Jet Ryanair
Unlike the current ratio the acid-test ratio for EasyJet PLC has represented a fall and
stood less than one from 2014 to 2017. This signifies that EasyJet is less liquid in satisfying
its short term debt obligations. While Ryanair has reported a declining trend of current ratio
but stood relatively greater than one, meaning that Ryanair has greater proportion of current
assets to meet its short term obligations.
Years 2013 2014 2015 2016 2017
Current Assets 1448 1261 1279 1454 1734
Derivative Financial Instrument 53 17 128 268 131
Current Liabilities 1379 1420 1768 1573 1670
Workings (1448-53)1379 (1261-17)/1420 (1279-128)/1768 (1454-268)/1573 (1734-131)/1670
Acid Test Ratio 1.01 0.88 0.65 0.75 0.96
Acid Test Ratio
Ryanair:
Years 2013 2014 2015 2016 2017
Current Assets 3763.6 3444.3 5742 4821.5 4706.1
Derivative Financial Instrument 78.1 16.7 744.4 269.1 286.3
Less: Inventories 2.1 3.3 3.1
Quick Assets 3685.5 3427.6 4995.5 4549.1 4416.7
Current Liabilities 1911.7 2274.5 3346 3369.5 3011.8
Workings 3685.5/1911.7 3427.6/2274.5 4995.5/3346 4549.1/3369.5 4416.7/3011.8
Acid Test Ratio 1.93 1.51 1.49 1.35 1.47
Acid Test Ratio
2013 2014 2015 2016 2017
0.00
0.50
1.00
1.50
2.00
2.50
1.01 0.88
0.65 0.75
0.96
1.93
1.51 1.49 1.35 1.47
Quick Ratio
Easy Jet Ryanair
Unlike the current ratio the acid-test ratio for EasyJet PLC has represented a fall and
stood less than one from 2014 to 2017. This signifies that EasyJet is less liquid in satisfying
its short term debt obligations. While Ryanair has reported a declining trend of current ratio
but stood relatively greater than one, meaning that Ryanair has greater proportion of current
assets to meet its short term obligations.
⊘ This is a preview!⊘
Do you want full access?
Subscribe today to unlock all pages.
Trusted by 1+ million students worldwide
9ACCOUNTING
Working Capital Efficiency Ratios:
Trade Receivables Collection Period:
This ratio determines the period of trade receivables settlement period and the time
taken on average basis to receive money from the debtors (Khan 2015).
EasyJet PLC:
Years 2013 2014 2015 2016 2017
Trade Receivables 194 200 206 217 275
Total Sales 4258 4527 4686 4669 5047
Workings (194/4258)x365 (200/4527)x365 )(206/4686)x365 (217/4669)x365 (275/5047)x365
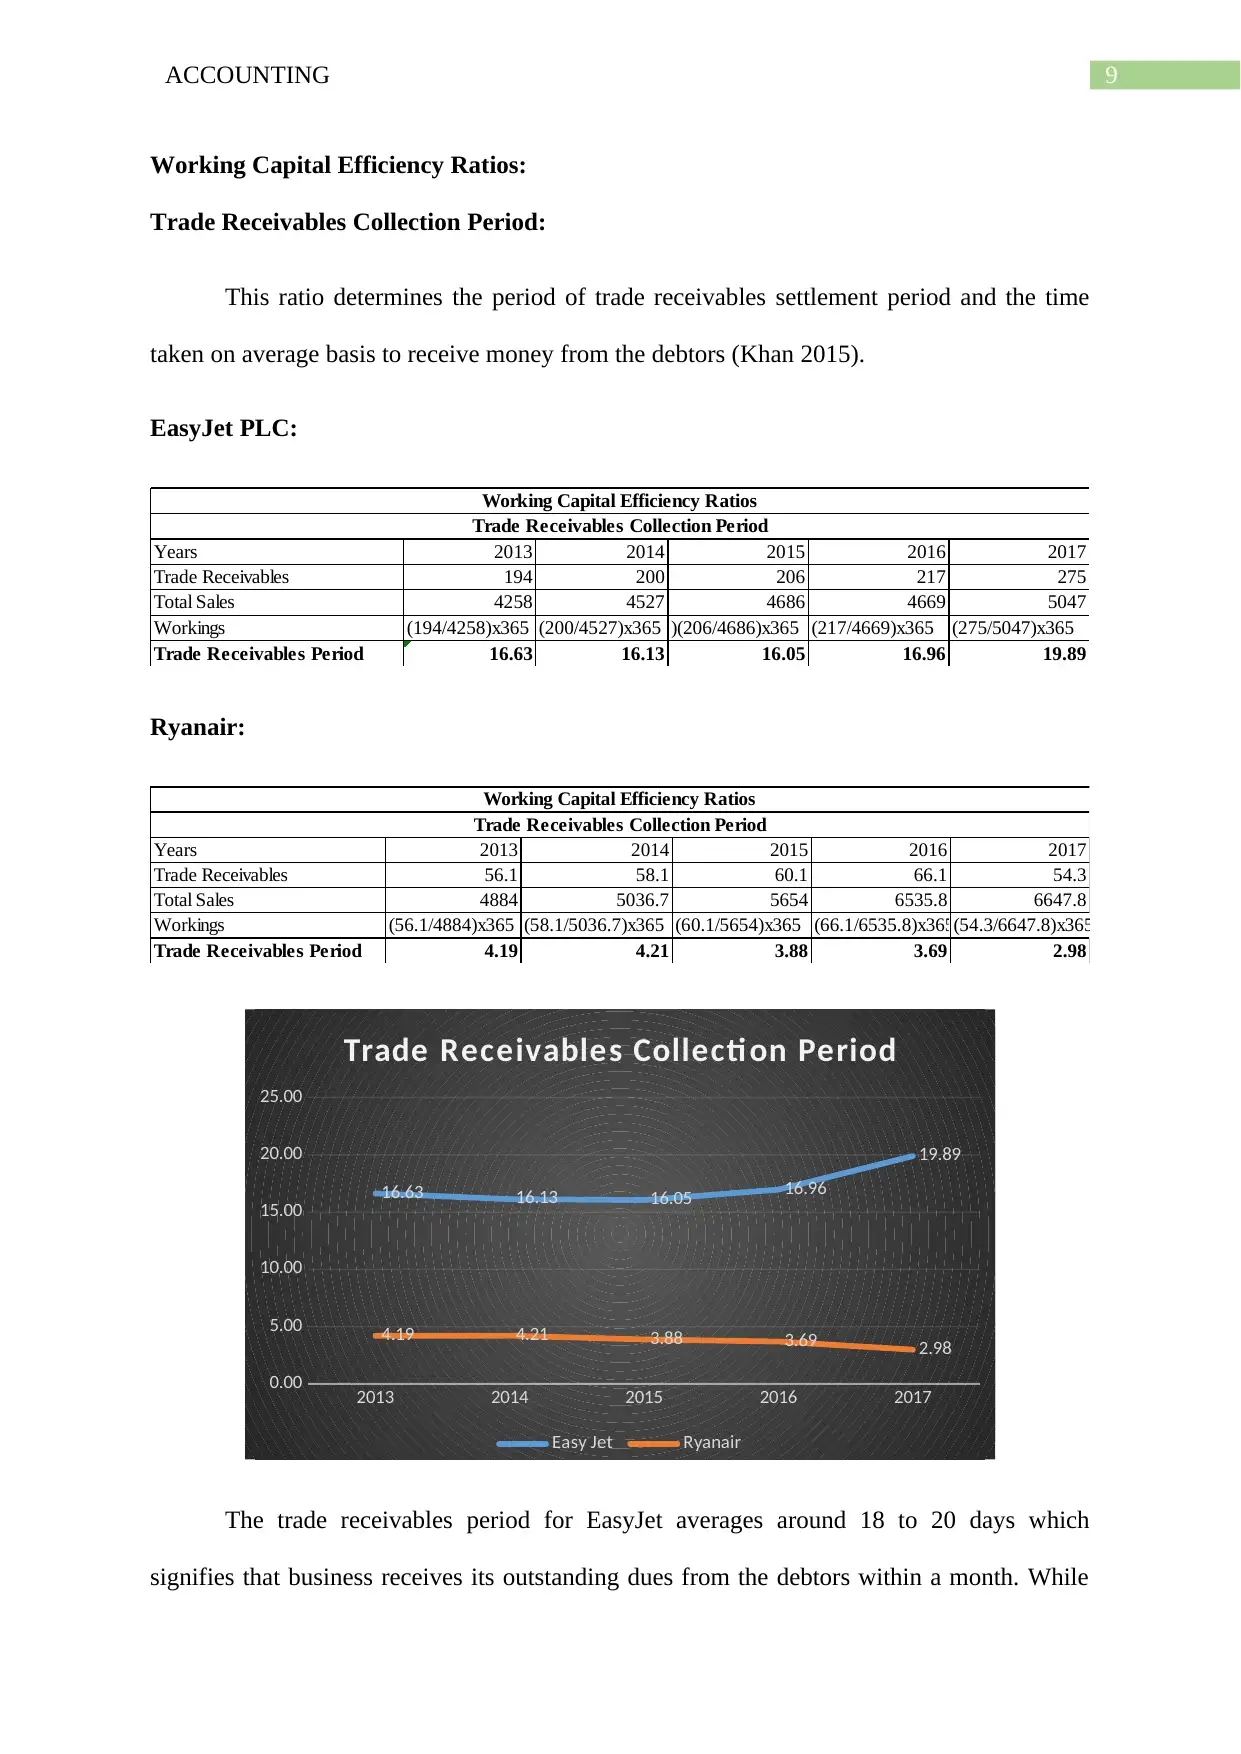
Trade Receivables Period 16.63 16.13 16.05 16.96 19.89
Trade Receivables Collection Period
Working Capital Efficiency Ratios
Ryanair:
Years 2013 2014 2015 2016 2017
Trade Receivables 56.1 58.1 60.1 66.1 54.3
Total Sales 4884 5036.7 5654 6535.8 6647.8
Workings (56.1/4884)x365 (58.1/5036.7)x365 (60.1/5654)x365 (66.1/6535.8)x365(54.3/6647.8)x365
Trade Receivables Period 4.19 4.21 3.88 3.69 2.98
Working Capital Efficiency Ratios
Trade Receivables Collection Period
2013 2014 2015 2016 2017
0.00
5.00
10.00
15.00
20.00
25.00
16.63 16.13 16.05 16.96
19.89
4.19 4.21 3.88 3.69 2.98
Trade Receivables Collecti on Period
Easy Jet Ryanair
The trade receivables period for EasyJet averages around 18 to 20 days which
signifies that business receives its outstanding dues from the debtors within a month. While
Working Capital Efficiency Ratios:
Trade Receivables Collection Period:
This ratio determines the period of trade receivables settlement period and the time
taken on average basis to receive money from the debtors (Khan 2015).
EasyJet PLC:
Years 2013 2014 2015 2016 2017
Trade Receivables 194 200 206 217 275
Total Sales 4258 4527 4686 4669 5047
Workings (194/4258)x365 (200/4527)x365 )(206/4686)x365 (217/4669)x365 (275/5047)x365
Trade Receivables Period 16.63 16.13 16.05 16.96 19.89
Trade Receivables Collection Period
Working Capital Efficiency Ratios
Ryanair:
Years 2013 2014 2015 2016 2017
Trade Receivables 56.1 58.1 60.1 66.1 54.3
Total Sales 4884 5036.7 5654 6535.8 6647.8
Workings (56.1/4884)x365 (58.1/5036.7)x365 (60.1/5654)x365 (66.1/6535.8)x365(54.3/6647.8)x365
Trade Receivables Period 4.19 4.21 3.88 3.69 2.98
Working Capital Efficiency Ratios
Trade Receivables Collection Period
2013 2014 2015 2016 2017
0.00
5.00
10.00
15.00
20.00
25.00
16.63 16.13 16.05 16.96
19.89
4.19 4.21 3.88 3.69 2.98
Trade Receivables Collecti on Period
Easy Jet Ryanair
The trade receivables period for EasyJet averages around 18 to 20 days which
signifies that business receives its outstanding dues from the debtors within a month. While
Paraphrase This Document
Need a fresh take? Get an instant paraphrase of this document with our AI Paraphraser
10ACCOUNTING
Ryanair reported a significantly improved trade receivables period with the ratio standing
averagely 3 to 4 days. This is advantageous for the company as its sales credit is settled
promptly within time without decrementing its cash flow from business.
Trade Payables Payment Period:
This ratio determines the time taken by the company on the average basis to pay their
creditors that supplied the goods and services on credit basis (Hoyle, Schaefer and Doupnik
2015).
EasyJet PLC:
Years 2013 2014 2015 2016 2017
Trade Payables 1093 1110 495 564 714
Cost of Goods Sold 3547 3704 3506 3665 4022
Workings (1093/3547)x365(1110/3704)x365(495/3506)x365 (565/3665)x365 (714/4022)x365
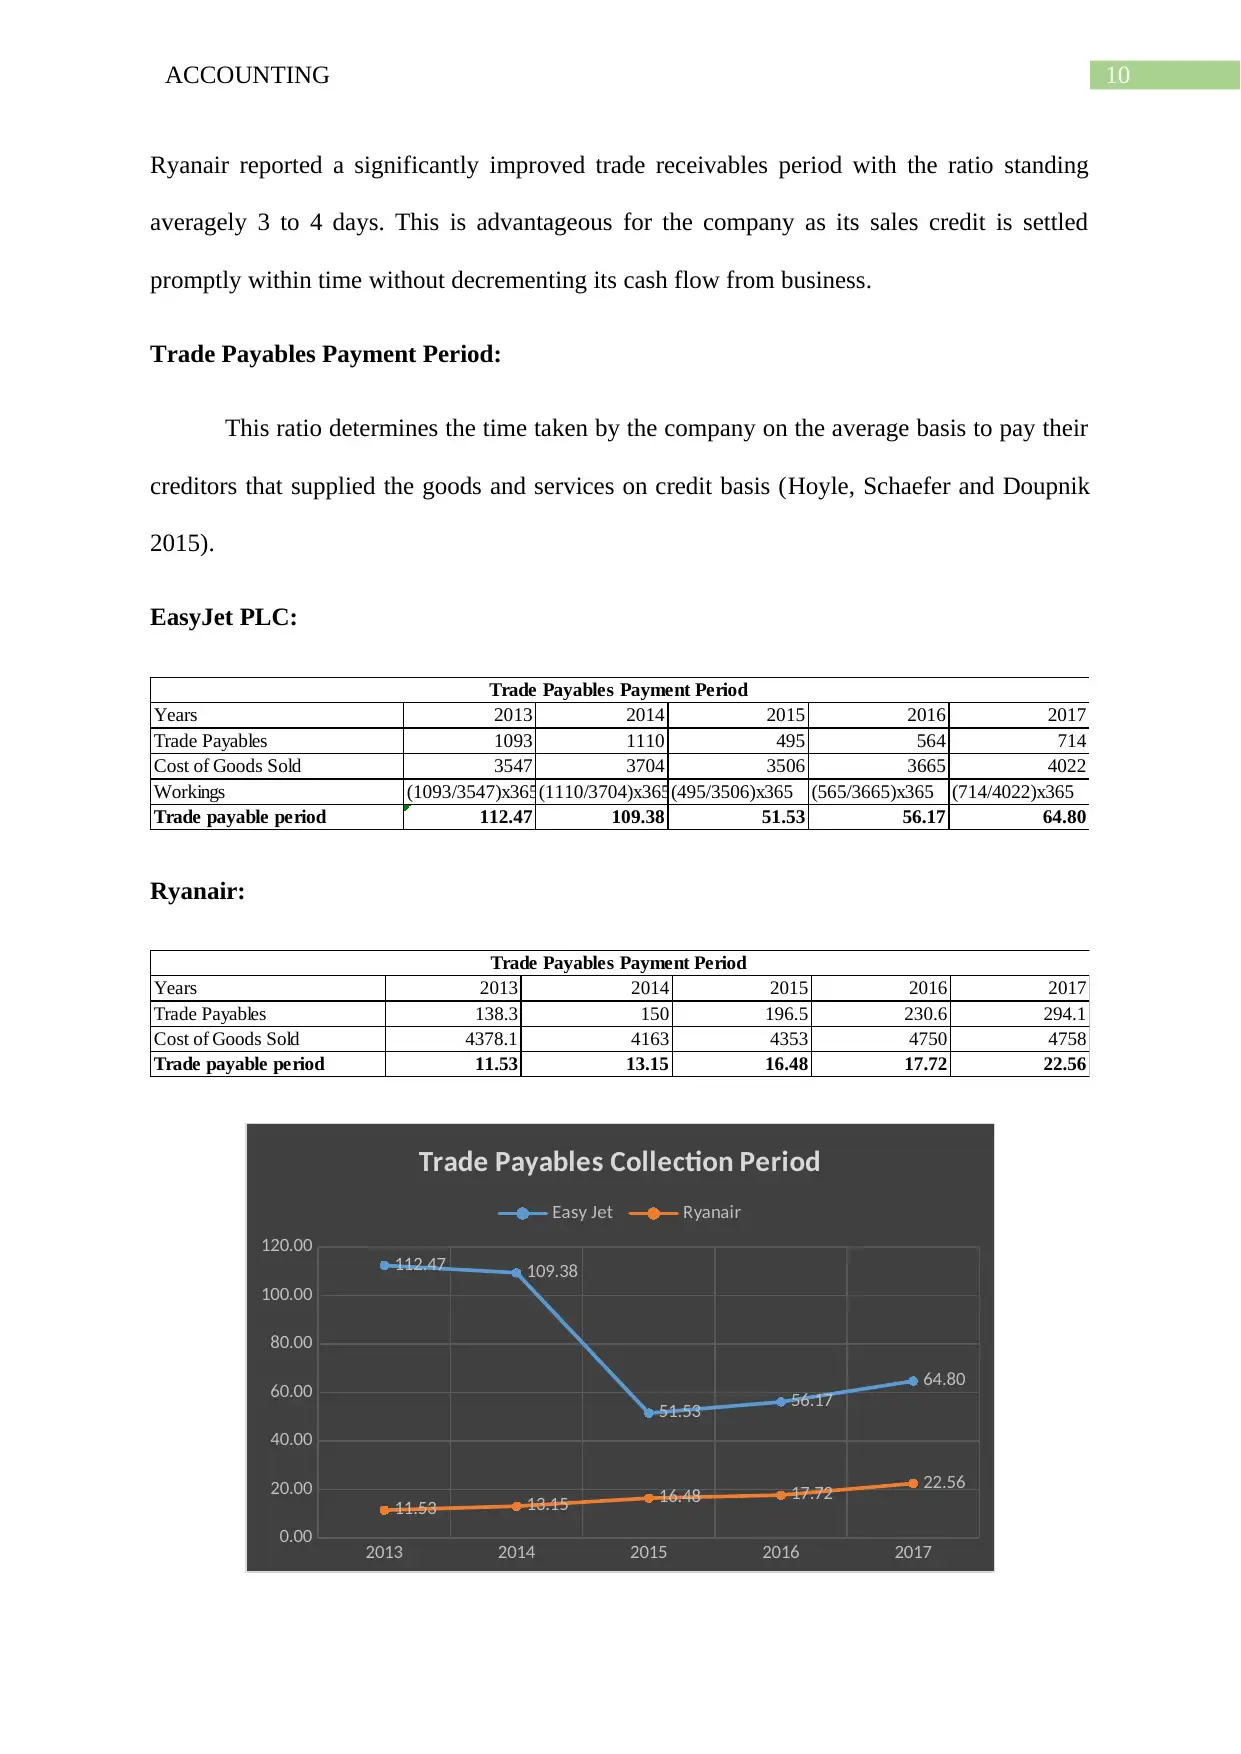
Trade payable period 112.47 109.38 51.53 56.17 64.80
Trade Payables Payment Period
Ryanair:
Years 2013 2014 2015 2016 2017
Trade Payables 138.3 150 196.5 230.6 294.1
Cost of Goods Sold 4378.1 4163 4353 4750 4758
Trade payable period 11.53 13.15 16.48 17.72 22.56
Trade Payables Payment Period
2013 2014 2015 2016 2017
0.00
20.00
40.00
60.00
80.00
100.00
120.00 112.47 109.38
51.53 56.17
64.80
11.53 13.15 16.48 17.72 22.56
Trade Payables Collection Period
Easy Jet Ryanair
Ryanair reported a significantly improved trade receivables period with the ratio standing
averagely 3 to 4 days. This is advantageous for the company as its sales credit is settled
promptly within time without decrementing its cash flow from business.
Trade Payables Payment Period:
This ratio determines the time taken by the company on the average basis to pay their
creditors that supplied the goods and services on credit basis (Hoyle, Schaefer and Doupnik
2015).
EasyJet PLC:
Years 2013 2014 2015 2016 2017
Trade Payables 1093 1110 495 564 714
Cost of Goods Sold 3547 3704 3506 3665 4022
Workings (1093/3547)x365(1110/3704)x365(495/3506)x365 (565/3665)x365 (714/4022)x365
Trade payable period 112.47 109.38 51.53 56.17 64.80
Trade Payables Payment Period
Ryanair:
Years 2013 2014 2015 2016 2017
Trade Payables 138.3 150 196.5 230.6 294.1
Cost of Goods Sold 4378.1 4163 4353 4750 4758
Trade payable period 11.53 13.15 16.48 17.72 22.56
Trade Payables Payment Period
2013 2014 2015 2016 2017
0.00
20.00
40.00
60.00
80.00
100.00
120.00 112.47 109.38
51.53 56.17
64.80
11.53 13.15 16.48 17.72 22.56
Trade Payables Collection Period
Easy Jet Ryanair
11ACCOUNTING
Computations from the above stated table for EasyJet signifies that the company
settles its trade payables in fifty to sixty days averagely. The payment period has though fell
down but because of its poor liquidity EasyJet may suffer loss of goodwill in meeting its debt
obligations. While Ryanair are settling their creditors quicker than its competitors as it
averages around twenty days. It seems that Ryanair has been consistent with its timeframe to
avoid the loss of goodwill.
Long term financial structure ratios:
Gearing Ratio:
The gearing ratio determines the contributions of the long term lenders with the long
term capital structure for a business (Barth 2015).
EasyJet PLC:
Years 2013 2014 2015 2016 2017
Long term debt 472 592 322 664 963
Share Capital 108 108 108 108 108
Workings 472/(472/108) 592(592/108) 322/(322+108) 664/(664+108) 963/(664+108)
Gearings Ratio 81.38% 84.57% 74.88% 86.01% 89.92%
Long term Financial Structure Ratios
Ryanair:
Years 2013 2014 2015 2016 2017
Long term debt 3098.4 2615.7 4032 3573.1 3928.6
Share Capital 3272.6 3285.8 4035.1 3596.8 4423
Workings 3098.4/3272.6 2615.7/3285.8 4032/4035.1 3573.1/3596.8 3928.6/4423
Gearings Ratio 48.63% 44.32% 49.98% 49.83% 47.04%
Long term Financial Structure Ratios
⊘ This is a preview!⊘
Do you want full access?
Subscribe today to unlock all pages.
Trusted by 1+ million students worldwide
1 out of 25
Your All-in-One AI-Powered Toolkit for Academic Success.
+13062052269
info@desklib.com
Available 24*7 on WhatsApp / Email
![[object Object]](/_next/static/media/star-bottom.7253800d.svg)
Unlock your academic potential
Copyright © 2020–2026 A2Z Services. All Rights Reserved. Developed and managed by ZUCOL.