Accounting and Finance - Assignment Sample
VerifiedAdded on 2021/05/30
|13
|1803
|19
AI Summary
Contribute Materials
Your contribution can guide someone’s learning journey. Share your
documents today.
Running head: ACCOUNTING AND FINANCE
ACCOUNTING AND FINANCE
Name of the Student:
Name of the University:
Author’s Note:
ACCOUNTING AND FINANCE
Name of the Student:
Name of the University:
Author’s Note:
Secure Best Marks with AI Grader
Need help grading? Try our AI Grader for instant feedback on your assignments.
1
ACCOUNTING AND FINANCE
Executive Summary
The assignment is based on two separate tasks which focuses on two different companies which
are Saturn Pet care ltd which is engaged in manufacturing of pet products and ARB Ltd which is
engaged in manufacturing activities of road motors accessories. In the first task capital budgeting
technique will be applied so as to select from two different production site which are Bathurst
site and Wodonga site. In the second task the capital structure of ARB ltd is to be analysed and
also compared with a similar company belonging to same industry.
2
ACCOUNTING AND FINANCE
Table of Contents
Part A...............................................................................................................................................3
Capital Budgeting of Bathurst Site..............................................................................................3
Capital Budgeting of Wodonga Site............................................................................................4
Product Cannibalization...............................................................................................................5
Rectifying the Excessive Sales Recorded....................................................................................5
Inclusion of Original Cost of Old Factory Shed..........................................................................5
Part B...............................................................................................................................................6
Introduction..................................................................................................................................6
Capital Structure and Cost of Capital..........................................................................................6
Weighted Average Cost of Capital below...................................................................................6
Cost of Capital Under CAPM......................................................................................................7
Comparison between ARB ltd and Modine ltd............................................................................8
Financial Ratios of ARB Ltd.......................................................................................................8
Changes in capital structure.......................................................................................................10
Wealth Maximization................................................................................................................10
Recommendations......................................................................................................................11
Conclusion.....................................................................................................................................11
Reference.......................................................................................................................................12
3
ACCOUNTING AND FINANCE
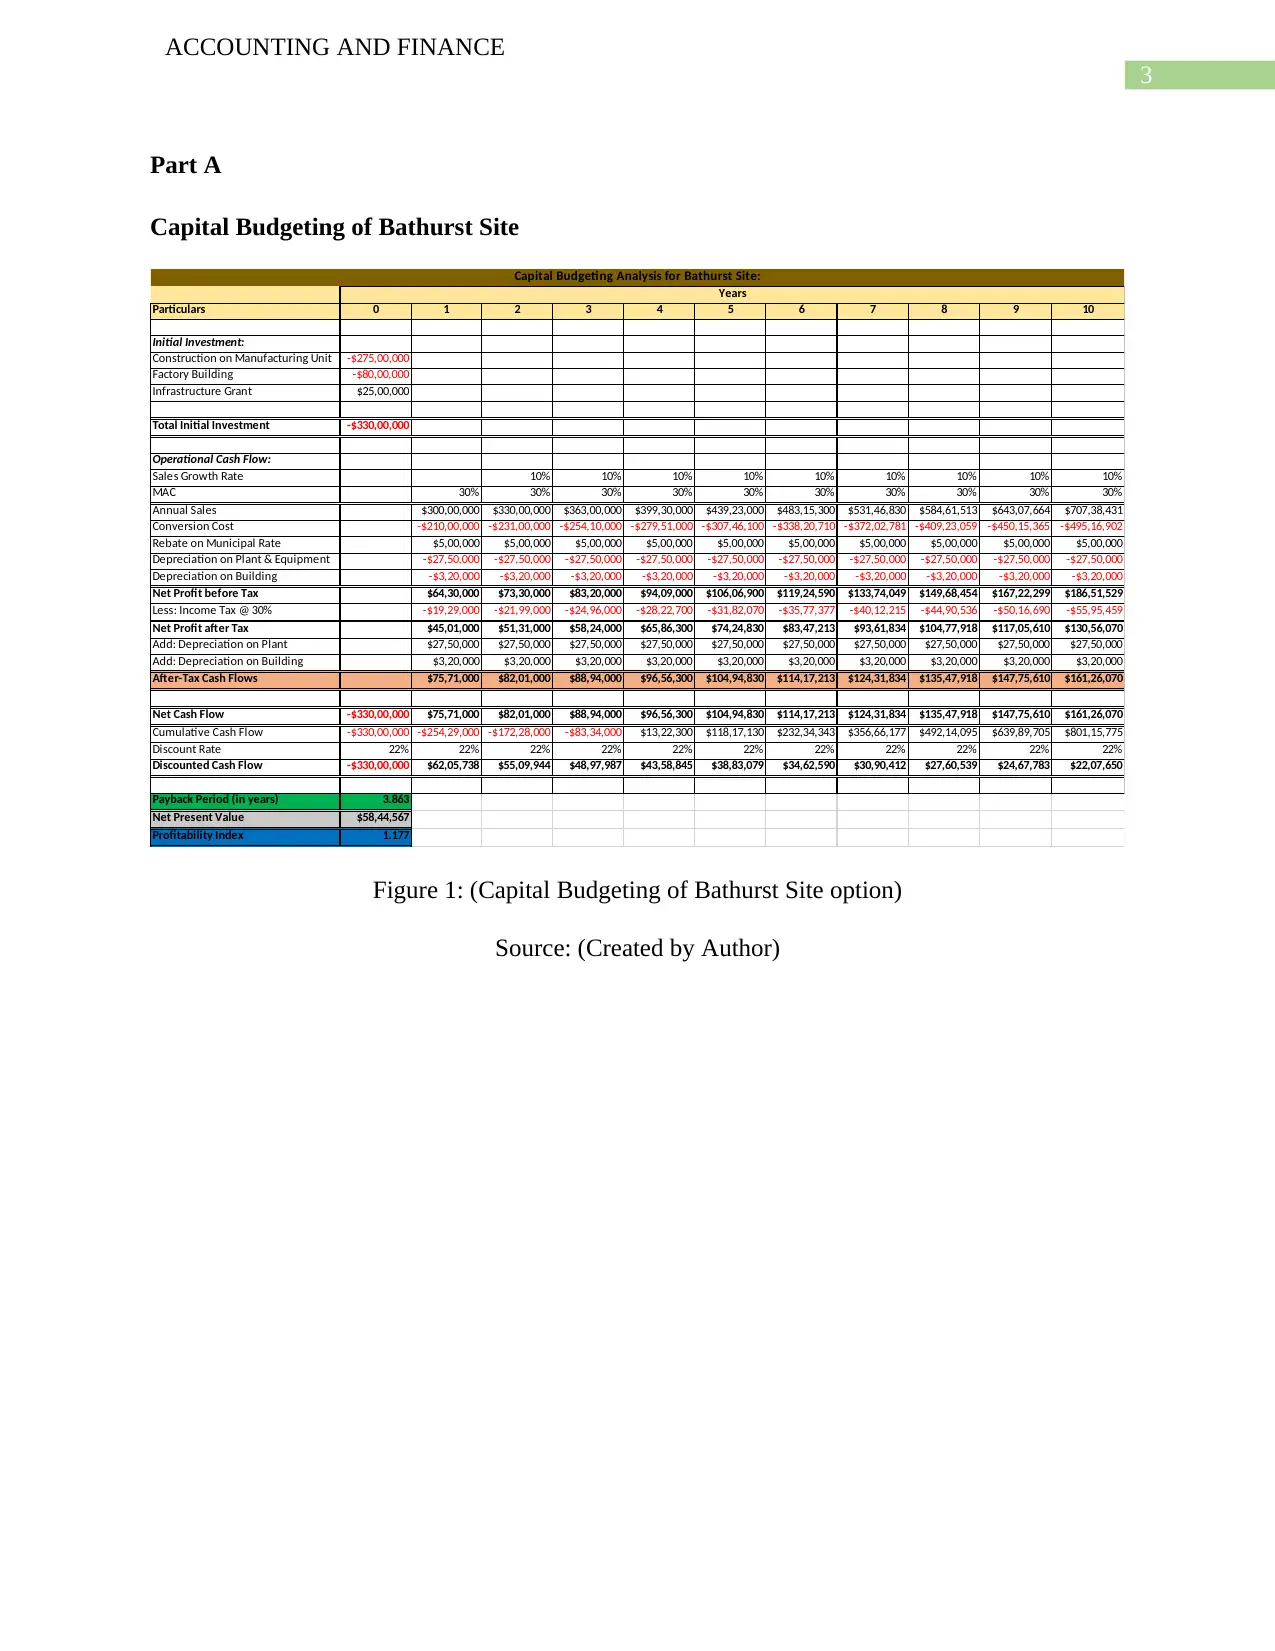
Part A
Capital Budgeting of Bathurst Site
Particulars 0 1 2 3 4 5 6 7 8 9 10
Initial Investment:
Construction on Manufacturing Unit -$275,00,000
Factory Building -$80,00,000
Infrastructure Grant $25,00,000
Total Initial Investment -$330,00,000
Operational Cash Flow:
Sales Growth Rate 10% 10% 10% 10% 10% 10% 10% 10% 10%
MAC 30% 30% 30% 30% 30% 30% 30% 30% 30% 30%
Annual Sales $300,00,000 $330,00,000 $363,00,000 $399,30,000 $439,23,000 $483,15,300 $531,46,830 $584,61,513 $643,07,664 $707,38,431
Conversion Cost -$210,00,000 -$231,00,000 -$254,10,000 -$279,51,000 -$307,46,100 -$338,20,710 -$372,02,781 -$409,23,059 -$450,15,365 -$495,16,902
Rebate on Municipal Rate $5,00,000 $5,00,000 $5,00,000 $5,00,000 $5,00,000 $5,00,000 $5,00,000 $5,00,000 $5,00,000 $5,00,000
Depreciation on Plant & Equipment -$27,50,000 -$27,50,000 -$27,50,000 -$27,50,000 -$27,50,000 -$27,50,000 -$27,50,000 -$27,50,000 -$27,50,000 -$27,50,000
Depreciation on Building -$3,20,000 -$3,20,000 -$3,20,000 -$3,20,000 -$3,20,000 -$3,20,000 -$3,20,000 -$3,20,000 -$3,20,000 -$3,20,000
Net Profit before Tax $64,30,000 $73,30,000 $83,20,000 $94,09,000 $106,06,900 $119,24,590 $133,74,049 $149,68,454 $167,22,299 $186,51,529
Less: Income Tax @ 30% -$19,29,000 -$21,99,000 -$24,96,000 -$28,22,700 -$31,82,070 -$35,77,377 -$40,12,215 -$44,90,536 -$50,16,690 -$55,95,459
Net Profit after Tax $45,01,000 $51,31,000 $58,24,000 $65,86,300 $74,24,830 $83,47,213 $93,61,834 $104,77,918 $117,05,610 $130,56,070
Add: Depreciation on Plant $27,50,000 $27,50,000 $27,50,000 $27,50,000 $27,50,000 $27,50,000 $27,50,000 $27,50,000 $27,50,000 $27,50,000
Add: Depreciation on Building $3,20,000 $3,20,000 $3,20,000 $3,20,000 $3,20,000 $3,20,000 $3,20,000 $3,20,000 $3,20,000 $3,20,000
After-Tax Cash Flows $75,71,000 $82,01,000 $88,94,000 $96,56,300 $104,94,830 $114,17,213 $124,31,834 $135,47,918 $147,75,610 $161,26,070
Net Cash Flow -$330,00,000 $75,71,000 $82,01,000 $88,94,000 $96,56,300 $104,94,830 $114,17,213 $124,31,834 $135,47,918 $147,75,610 $161,26,070
Cumulative Cash Flow -$330,00,000 -$254,29,000 -$172,28,000 -$83,34,000 $13,22,300 $118,17,130 $232,34,343 $356,66,177 $492,14,095 $639,89,705 $801,15,775
Discount Rate 22% 22% 22% 22% 22% 22% 22% 22% 22% 22% 22%
Discounted Cash Flow -$330,00,000 $62,05,738 $55,09,944 $48,97,987 $43,58,845 $38,83,079 $34,62,590 $30,90,412 $27,60,539 $24,67,783 $22,07,650
Payback Period (in years) 3.863
Net Present Value $58,44,567
Profitability Index 1.177
Years
Capital Budgeting Analysis for Bathurst Site:
Figure 1: (Capital Budgeting of Bathurst Site option)
Source: (Created by Author)
ACCOUNTING AND FINANCE
Part A
Capital Budgeting of Bathurst Site
Particulars 0 1 2 3 4 5 6 7 8 9 10
Initial Investment:
Construction on Manufacturing Unit -$275,00,000
Factory Building -$80,00,000
Infrastructure Grant $25,00,000
Total Initial Investment -$330,00,000
Operational Cash Flow:
Sales Growth Rate 10% 10% 10% 10% 10% 10% 10% 10% 10%
MAC 30% 30% 30% 30% 30% 30% 30% 30% 30% 30%
Annual Sales $300,00,000 $330,00,000 $363,00,000 $399,30,000 $439,23,000 $483,15,300 $531,46,830 $584,61,513 $643,07,664 $707,38,431
Conversion Cost -$210,00,000 -$231,00,000 -$254,10,000 -$279,51,000 -$307,46,100 -$338,20,710 -$372,02,781 -$409,23,059 -$450,15,365 -$495,16,902
Rebate on Municipal Rate $5,00,000 $5,00,000 $5,00,000 $5,00,000 $5,00,000 $5,00,000 $5,00,000 $5,00,000 $5,00,000 $5,00,000
Depreciation on Plant & Equipment -$27,50,000 -$27,50,000 -$27,50,000 -$27,50,000 -$27,50,000 -$27,50,000 -$27,50,000 -$27,50,000 -$27,50,000 -$27,50,000
Depreciation on Building -$3,20,000 -$3,20,000 -$3,20,000 -$3,20,000 -$3,20,000 -$3,20,000 -$3,20,000 -$3,20,000 -$3,20,000 -$3,20,000
Net Profit before Tax $64,30,000 $73,30,000 $83,20,000 $94,09,000 $106,06,900 $119,24,590 $133,74,049 $149,68,454 $167,22,299 $186,51,529
Less: Income Tax @ 30% -$19,29,000 -$21,99,000 -$24,96,000 -$28,22,700 -$31,82,070 -$35,77,377 -$40,12,215 -$44,90,536 -$50,16,690 -$55,95,459
Net Profit after Tax $45,01,000 $51,31,000 $58,24,000 $65,86,300 $74,24,830 $83,47,213 $93,61,834 $104,77,918 $117,05,610 $130,56,070
Add: Depreciation on Plant $27,50,000 $27,50,000 $27,50,000 $27,50,000 $27,50,000 $27,50,000 $27,50,000 $27,50,000 $27,50,000 $27,50,000
Add: Depreciation on Building $3,20,000 $3,20,000 $3,20,000 $3,20,000 $3,20,000 $3,20,000 $3,20,000 $3,20,000 $3,20,000 $3,20,000
After-Tax Cash Flows $75,71,000 $82,01,000 $88,94,000 $96,56,300 $104,94,830 $114,17,213 $124,31,834 $135,47,918 $147,75,610 $161,26,070
Net Cash Flow -$330,00,000 $75,71,000 $82,01,000 $88,94,000 $96,56,300 $104,94,830 $114,17,213 $124,31,834 $135,47,918 $147,75,610 $161,26,070
Cumulative Cash Flow -$330,00,000 -$254,29,000 -$172,28,000 -$83,34,000 $13,22,300 $118,17,130 $232,34,343 $356,66,177 $492,14,095 $639,89,705 $801,15,775
Discount Rate 22% 22% 22% 22% 22% 22% 22% 22% 22% 22% 22%
Discounted Cash Flow -$330,00,000 $62,05,738 $55,09,944 $48,97,987 $43,58,845 $38,83,079 $34,62,590 $30,90,412 $27,60,539 $24,67,783 $22,07,650
Payback Period (in years) 3.863
Net Present Value $58,44,567
Profitability Index 1.177
Years
Capital Budgeting Analysis for Bathurst Site:
Figure 1: (Capital Budgeting of Bathurst Site option)
Source: (Created by Author)
Secure Best Marks with AI Grader
Need help grading? Try our AI Grader for instant feedback on your assignments.
4
ACCOUNTING AND FINANCE
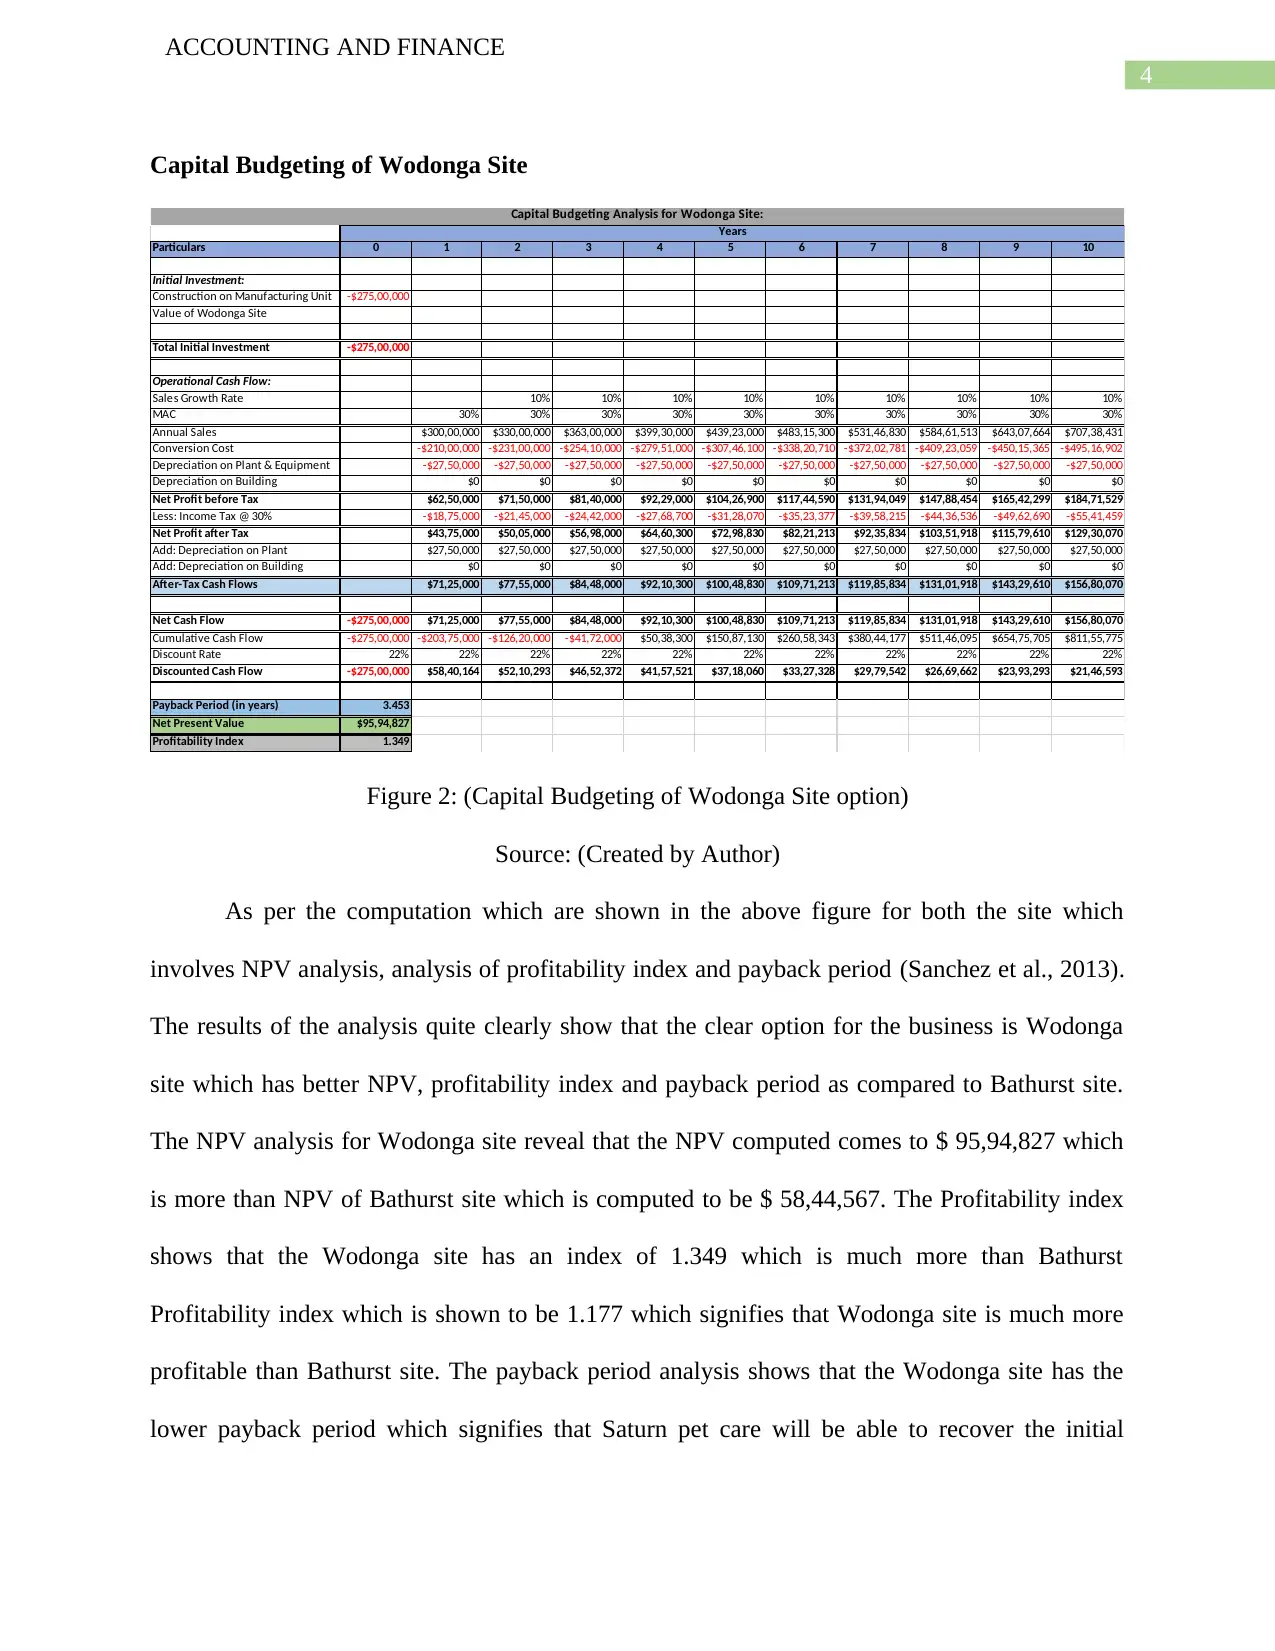
Capital Budgeting of Wodonga Site
Particulars 0 1 2 3 4 5 6 7 8 9 10
Initial Investment:
Construction on Manufacturing Unit -$275,00,000
Value of Wodonga Site
Total Initial Investment -$275,00,000
Operational Cash Flow:
Sales Growth Rate 10% 10% 10% 10% 10% 10% 10% 10% 10%
MAC 30% 30% 30% 30% 30% 30% 30% 30% 30% 30%
Annual Sales $300,00,000 $330,00,000 $363,00,000 $399,30,000 $439,23,000 $483,15,300 $531,46,830 $584,61,513 $643,07,664 $707,38,431
Conversion Cost -$210,00,000 -$231,00,000 -$254,10,000 -$279,51,000 -$307,46,100 -$338,20,710 -$372,02,781 -$409,23,059 -$450,15,365 -$495,16,902
Depreciation on Plant & Equipment -$27,50,000 -$27,50,000 -$27,50,000 -$27,50,000 -$27,50,000 -$27,50,000 -$27,50,000 -$27,50,000 -$27,50,000 -$27,50,000
Depreciation on Building $0 $0 $0 $0 $0 $0 $0 $0 $0 $0
Net Profit before Tax $62,50,000 $71,50,000 $81,40,000 $92,29,000 $104,26,900 $117,44,590 $131,94,049 $147,88,454 $165,42,299 $184,71,529
Less: Income Tax @ 30% -$18,75,000 -$21,45,000 -$24,42,000 -$27,68,700 -$31,28,070 -$35,23,377 -$39,58,215 -$44,36,536 -$49,62,690 -$55,41,459
Net Profit after Tax $43,75,000 $50,05,000 $56,98,000 $64,60,300 $72,98,830 $82,21,213 $92,35,834 $103,51,918 $115,79,610 $129,30,070
Add: Depreciation on Plant $27,50,000 $27,50,000 $27,50,000 $27,50,000 $27,50,000 $27,50,000 $27,50,000 $27,50,000 $27,50,000 $27,50,000
Add: Depreciation on Building $0 $0 $0 $0 $0 $0 $0 $0 $0 $0
After-Tax Cash Flows $71,25,000 $77,55,000 $84,48,000 $92,10,300 $100,48,830 $109,71,213 $119,85,834 $131,01,918 $143,29,610 $156,80,070
Net Cash Flow -$275,00,000 $71,25,000 $77,55,000 $84,48,000 $92,10,300 $100,48,830 $109,71,213 $119,85,834 $131,01,918 $143,29,610 $156,80,070
Cumulative Cash Flow -$275,00,000 -$203,75,000 -$126,20,000 -$41,72,000 $50,38,300 $150,87,130 $260,58,343 $380,44,177 $511,46,095 $654,75,705 $811,55,775
Discount Rate 22% 22% 22% 22% 22% 22% 22% 22% 22% 22% 22%
Discounted Cash Flow -$275,00,000 $58,40,164 $52,10,293 $46,52,372 $41,57,521 $37,18,060 $33,27,328 $29,79,542 $26,69,662 $23,93,293 $21,46,593
Payback Period (in years) 3.453
Net Present Value $95,94,827
Profitability Index 1.349
Capital Budgeting Analysis for Wodonga Site:
Years
Figure 2: (Capital Budgeting of Wodonga Site option)
Source: (Created by Author)
As per the computation which are shown in the above figure for both the site which
involves NPV analysis, analysis of profitability index and payback period (Sanchez et al., 2013).
The results of the analysis quite clearly show that the clear option for the business is Wodonga
site which has better NPV, profitability index and payback period as compared to Bathurst site.
The NPV analysis for Wodonga site reveal that the NPV computed comes to $ 95,94,827 which
is more than NPV of Bathurst site which is computed to be $ 58,44,567. The Profitability index
shows that the Wodonga site has an index of 1.349 which is much more than Bathurst
Profitability index which is shown to be 1.177 which signifies that Wodonga site is much more
profitable than Bathurst site. The payback period analysis shows that the Wodonga site has the
lower payback period which signifies that Saturn pet care will be able to recover the initial
ACCOUNTING AND FINANCE
Capital Budgeting of Wodonga Site
Particulars 0 1 2 3 4 5 6 7 8 9 10
Initial Investment:
Construction on Manufacturing Unit -$275,00,000
Value of Wodonga Site
Total Initial Investment -$275,00,000
Operational Cash Flow:
Sales Growth Rate 10% 10% 10% 10% 10% 10% 10% 10% 10%
MAC 30% 30% 30% 30% 30% 30% 30% 30% 30% 30%
Annual Sales $300,00,000 $330,00,000 $363,00,000 $399,30,000 $439,23,000 $483,15,300 $531,46,830 $584,61,513 $643,07,664 $707,38,431
Conversion Cost -$210,00,000 -$231,00,000 -$254,10,000 -$279,51,000 -$307,46,100 -$338,20,710 -$372,02,781 -$409,23,059 -$450,15,365 -$495,16,902
Depreciation on Plant & Equipment -$27,50,000 -$27,50,000 -$27,50,000 -$27,50,000 -$27,50,000 -$27,50,000 -$27,50,000 -$27,50,000 -$27,50,000 -$27,50,000
Depreciation on Building $0 $0 $0 $0 $0 $0 $0 $0 $0 $0
Net Profit before Tax $62,50,000 $71,50,000 $81,40,000 $92,29,000 $104,26,900 $117,44,590 $131,94,049 $147,88,454 $165,42,299 $184,71,529
Less: Income Tax @ 30% -$18,75,000 -$21,45,000 -$24,42,000 -$27,68,700 -$31,28,070 -$35,23,377 -$39,58,215 -$44,36,536 -$49,62,690 -$55,41,459
Net Profit after Tax $43,75,000 $50,05,000 $56,98,000 $64,60,300 $72,98,830 $82,21,213 $92,35,834 $103,51,918 $115,79,610 $129,30,070
Add: Depreciation on Plant $27,50,000 $27,50,000 $27,50,000 $27,50,000 $27,50,000 $27,50,000 $27,50,000 $27,50,000 $27,50,000 $27,50,000
Add: Depreciation on Building $0 $0 $0 $0 $0 $0 $0 $0 $0 $0
After-Tax Cash Flows $71,25,000 $77,55,000 $84,48,000 $92,10,300 $100,48,830 $109,71,213 $119,85,834 $131,01,918 $143,29,610 $156,80,070
Net Cash Flow -$275,00,000 $71,25,000 $77,55,000 $84,48,000 $92,10,300 $100,48,830 $109,71,213 $119,85,834 $131,01,918 $143,29,610 $156,80,070
Cumulative Cash Flow -$275,00,000 -$203,75,000 -$126,20,000 -$41,72,000 $50,38,300 $150,87,130 $260,58,343 $380,44,177 $511,46,095 $654,75,705 $811,55,775
Discount Rate 22% 22% 22% 22% 22% 22% 22% 22% 22% 22% 22%
Discounted Cash Flow -$275,00,000 $58,40,164 $52,10,293 $46,52,372 $41,57,521 $37,18,060 $33,27,328 $29,79,542 $26,69,662 $23,93,293 $21,46,593
Payback Period (in years) 3.453
Net Present Value $95,94,827
Profitability Index 1.349
Capital Budgeting Analysis for Wodonga Site:
Years
Figure 2: (Capital Budgeting of Wodonga Site option)
Source: (Created by Author)
As per the computation which are shown in the above figure for both the site which
involves NPV analysis, analysis of profitability index and payback period (Sanchez et al., 2013).
The results of the analysis quite clearly show that the clear option for the business is Wodonga
site which has better NPV, profitability index and payback period as compared to Bathurst site.
The NPV analysis for Wodonga site reveal that the NPV computed comes to $ 95,94,827 which
is more than NPV of Bathurst site which is computed to be $ 58,44,567. The Profitability index
shows that the Wodonga site has an index of 1.349 which is much more than Bathurst
Profitability index which is shown to be 1.177 which signifies that Wodonga site is much more
profitable than Bathurst site. The payback period analysis shows that the Wodonga site has the
lower payback period which signifies that Saturn pet care will be able to recover the initial
5
ACCOUNTING AND FINANCE
investment which the company spend on the production project. Thus, it is clear that Wodonga
site is the clear option.
Product Cannibalization
This can be described as a technique which is used by businesses to promote or introduce
new products in the market by reducing the sales volume of another product (Lin & Okudan,
2013). In the case of Saturn pet care, it is expected the management will be applying this
technique in order to promote the new product of the business in the market.
Rectifying the Excessive Sales Recorded
The sales which is recorded and estimated by the marketing department of Saturn pet care
as per one of the directors of the business has been incorrectly estimated and the accurate one
might be a bit lower than what has been anticipated. Such an error in estimation can impact the
decision-making process of the business and therefore needs to be rectified. The management
can apply NPV method and increase the cost figures of the business so as to neutralize the erro in
estimation.
Inclusion of Original Cost of Old Factory Shed
It is also the opinion of the director that the existing factory site which is vacant which is
going to be used in the production process also must be included in the costs of initial investment
made by the business. This is an incorrect estimation as NPV analysis only recognizes current
investments which are undertaken for the project. Th initial investment must not include the such
costs in the initial investment of the business.
6
ACCOUNTING AND FINANCE
Part B
Introduction
This part will be analyzing the capital structure which is used by the business for the
purpose of financing its operations. The later paragraph will also be containing an analysis which
will compare the capital structure of ARB ltd and another company belonging to same industry.
There will also be recommendations as to how the business can further develop.
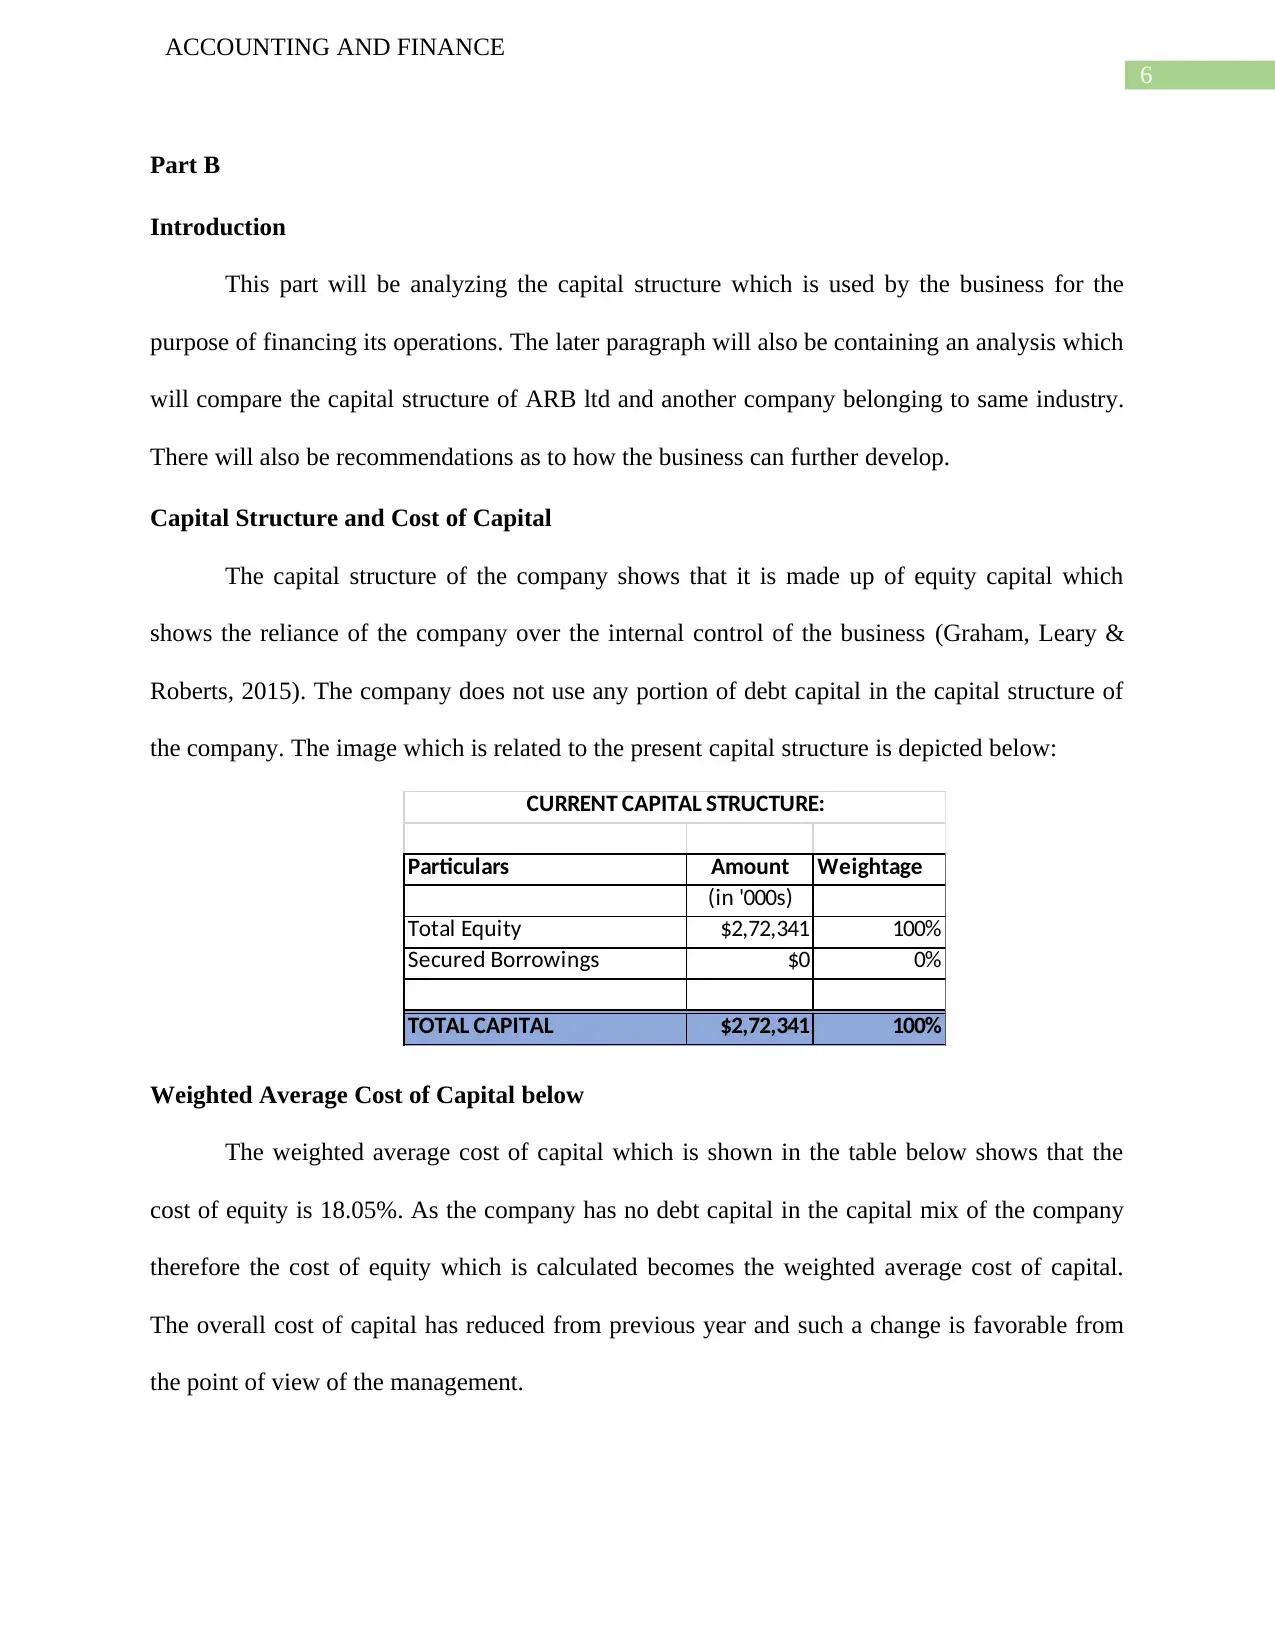
Capital Structure and Cost of Capital
The capital structure of the company shows that it is made up of equity capital which
shows the reliance of the company over the internal control of the business (Graham, Leary &
Roberts, 2015). The company does not use any portion of debt capital in the capital structure of
the company. The image which is related to the present capital structure is depicted below:
Particulars Amount Weightage
(in '000s)
Total Equity $2,72,341 100%
Secured Borrowings $0 0%
TOTAL CAPITAL $2,72,341 100%
CURRENT CAPITAL STRUCTURE:
Weighted Average Cost of Capital below
The weighted average cost of capital which is shown in the table below shows that the
cost of equity is 18.05%. As the company has no debt capital in the capital mix of the company
therefore the cost of equity which is calculated becomes the weighted average cost of capital.
The overall cost of capital has reduced from previous year and such a change is favorable from
the point of view of the management.
ACCOUNTING AND FINANCE
Part B
Introduction
This part will be analyzing the capital structure which is used by the business for the
purpose of financing its operations. The later paragraph will also be containing an analysis which
will compare the capital structure of ARB ltd and another company belonging to same industry.
There will also be recommendations as to how the business can further develop.
Capital Structure and Cost of Capital
The capital structure of the company shows that it is made up of equity capital which
shows the reliance of the company over the internal control of the business (Graham, Leary &
Roberts, 2015). The company does not use any portion of debt capital in the capital structure of
the company. The image which is related to the present capital structure is depicted below:
Particulars Amount Weightage
(in '000s)
Total Equity $2,72,341 100%
Secured Borrowings $0 0%
TOTAL CAPITAL $2,72,341 100%
CURRENT CAPITAL STRUCTURE:
Weighted Average Cost of Capital below
The weighted average cost of capital which is shown in the table below shows that the
cost of equity is 18.05%. As the company has no debt capital in the capital mix of the company
therefore the cost of equity which is calculated becomes the weighted average cost of capital.
The overall cost of capital has reduced from previous year and such a change is favorable from
the point of view of the management.
Paraphrase This Document
Need a fresh take? Get an instant paraphrase of this document with our AI Paraphraser
7
ACCOUNTING AND FINANCE
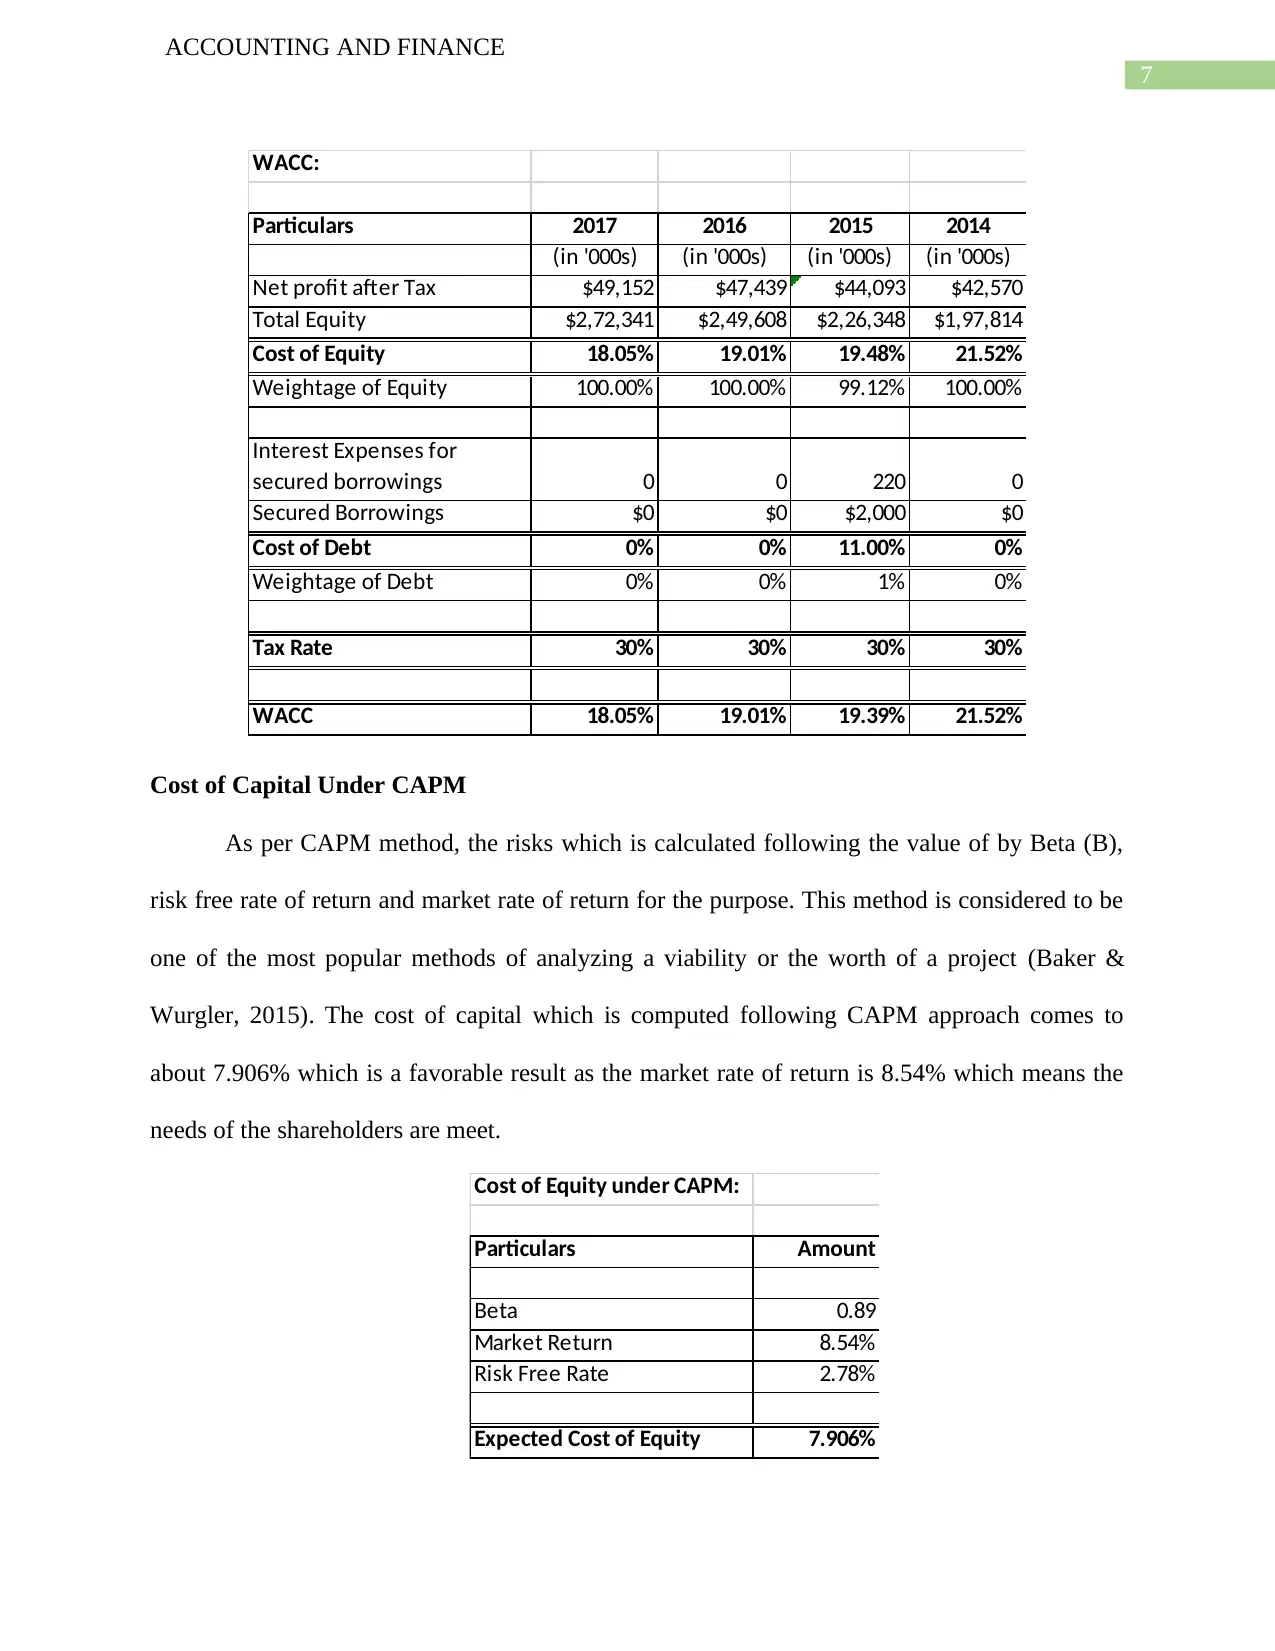
WACC:
Particulars 2017 2016 2015 2014
(in '000s) (in '000s) (in '000s) (in '000s)
Net profit after Tax $49,152 $47,439 $44,093 $42,570
Total Equity $2,72,341 $2,49,608 $2,26,348 $1,97,814
Cost of Equity 18.05% 19.01% 19.48% 21.52%
Weightage of Equity 100.00% 100.00% 99.12% 100.00%
Interest Expenses for
secured borrowings 0 0 220 0
Secured Borrowings $0 $0 $2,000 $0
Cost of Debt 0% 0% 11.00% 0%
Weightage of Debt 0% 0% 1% 0%
Tax Rate 30% 30% 30% 30%
WACC 18.05% 19.01% 19.39% 21.52%
Cost of Capital Under CAPM
As per CAPM method, the risks which is calculated following the value of by Beta (B),
risk free rate of return and market rate of return for the purpose. This method is considered to be
one of the most popular methods of analyzing a viability or the worth of a project (Baker &
Wurgler, 2015). The cost of capital which is computed following CAPM approach comes to
about 7.906% which is a favorable result as the market rate of return is 8.54% which means the
needs of the shareholders are meet.
Cost of Equity under CAPM:
Particulars Amount
Beta 0.89
Market Return 8.54%
Risk Free Rate 2.78%
Expected Cost of Equity 7.906%
ACCOUNTING AND FINANCE
WACC:
Particulars 2017 2016 2015 2014
(in '000s) (in '000s) (in '000s) (in '000s)
Net profit after Tax $49,152 $47,439 $44,093 $42,570
Total Equity $2,72,341 $2,49,608 $2,26,348 $1,97,814
Cost of Equity 18.05% 19.01% 19.48% 21.52%
Weightage of Equity 100.00% 100.00% 99.12% 100.00%
Interest Expenses for
secured borrowings 0 0 220 0
Secured Borrowings $0 $0 $2,000 $0
Cost of Debt 0% 0% 11.00% 0%
Weightage of Debt 0% 0% 1% 0%
Tax Rate 30% 30% 30% 30%
WACC 18.05% 19.01% 19.39% 21.52%
Cost of Capital Under CAPM
As per CAPM method, the risks which is calculated following the value of by Beta (B),
risk free rate of return and market rate of return for the purpose. This method is considered to be
one of the most popular methods of analyzing a viability or the worth of a project (Baker &
Wurgler, 2015). The cost of capital which is computed following CAPM approach comes to
about 7.906% which is a favorable result as the market rate of return is 8.54% which means the
needs of the shareholders are meet.
Cost of Equity under CAPM:
Particulars Amount
Beta 0.89
Market Return 8.54%
Risk Free Rate 2.78%
Expected Cost of Equity 7.906%
8
ACCOUNTING AND FINANCE
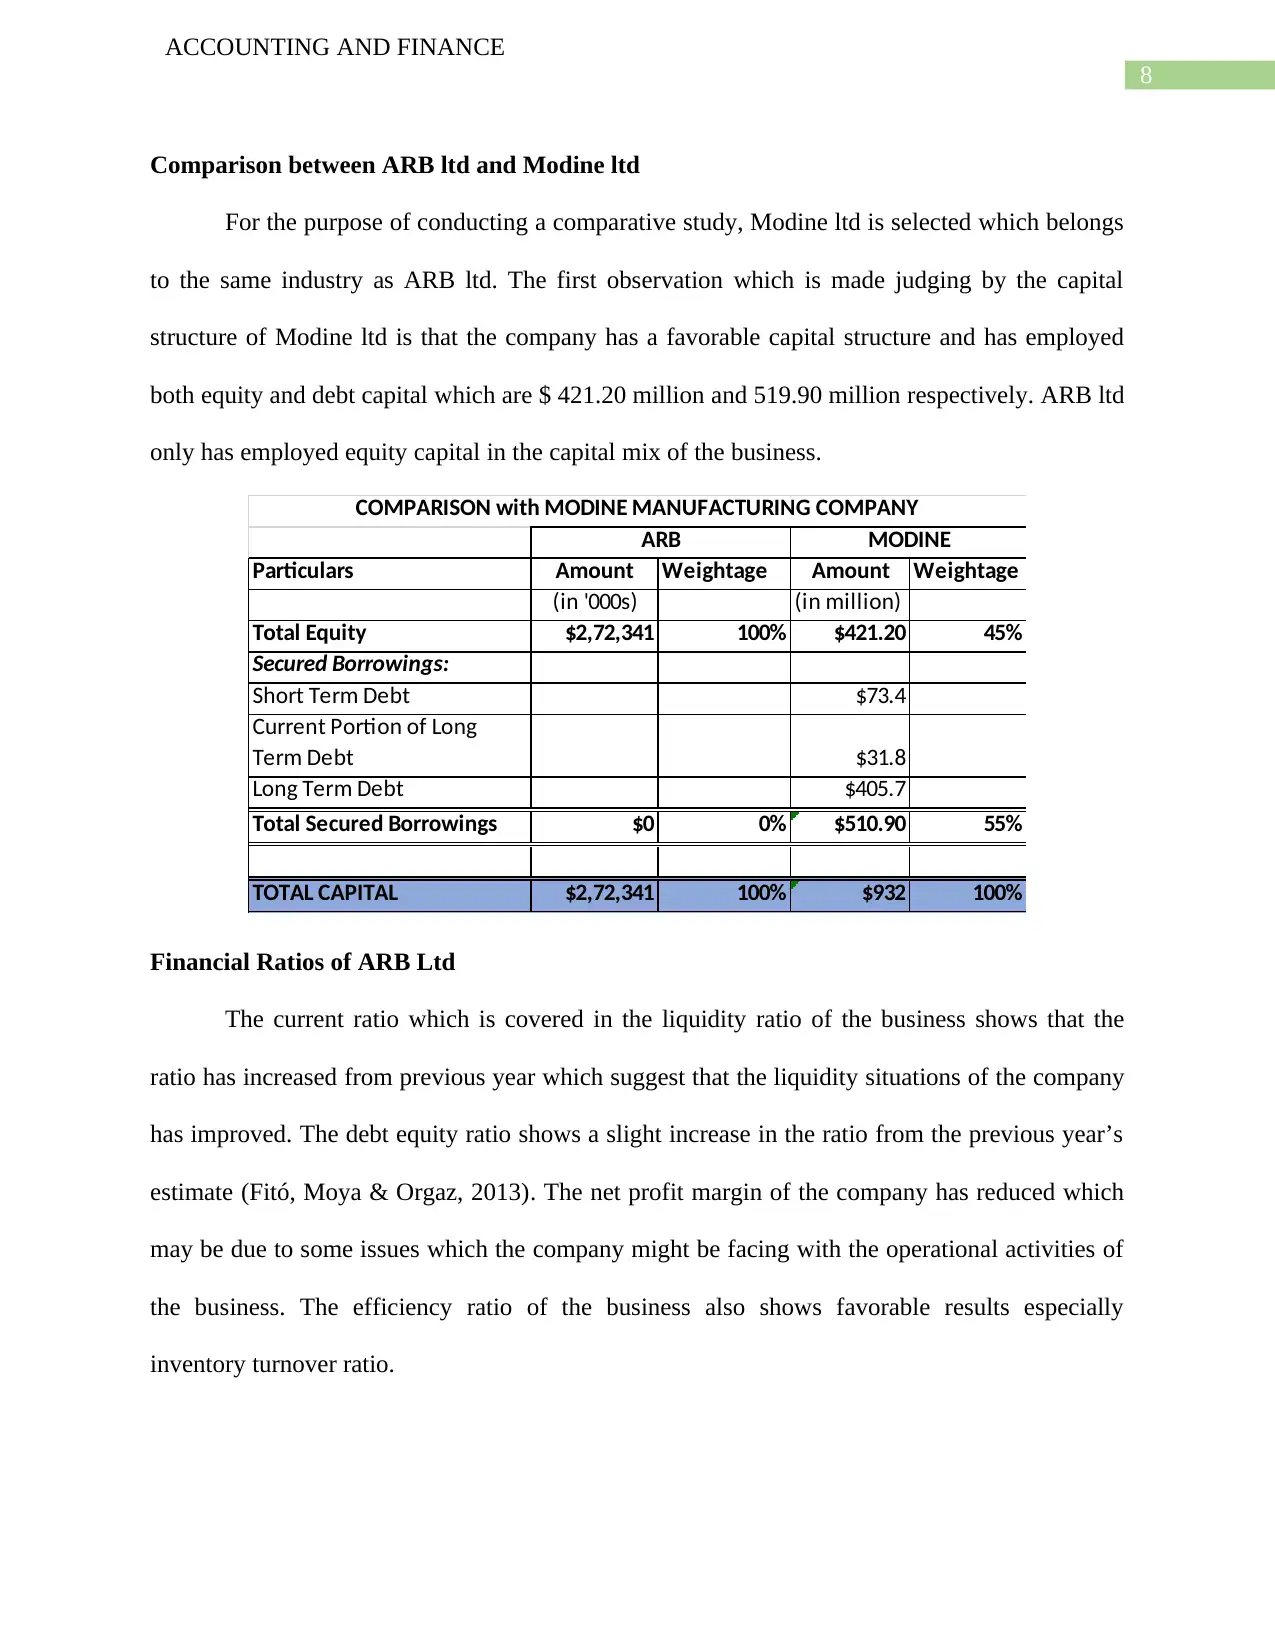
Comparison between ARB ltd and Modine ltd
For the purpose of conducting a comparative study, Modine ltd is selected which belongs
to the same industry as ARB ltd. The first observation which is made judging by the capital
structure of Modine ltd is that the company has a favorable capital structure and has employed
both equity and debt capital which are $ 421.20 million and 519.90 million respectively. ARB ltd
only has employed equity capital in the capital mix of the business.
Particulars Amount Weightage Amount Weightage
(in '000s) (in million)
Total Equity $2,72,341 100% $421.20 45%
Secured Borrowings:
Short Term Debt $73.4
Current Portion of Long
Term Debt $31.8
Long Term Debt $405.7
Total Secured Borrowings $0 0% $510.90 55%
TOTAL CAPITAL $2,72,341 100% $932 100%
ARB MODINE
COMPARISON with MODINE MANUFACTURING COMPANY
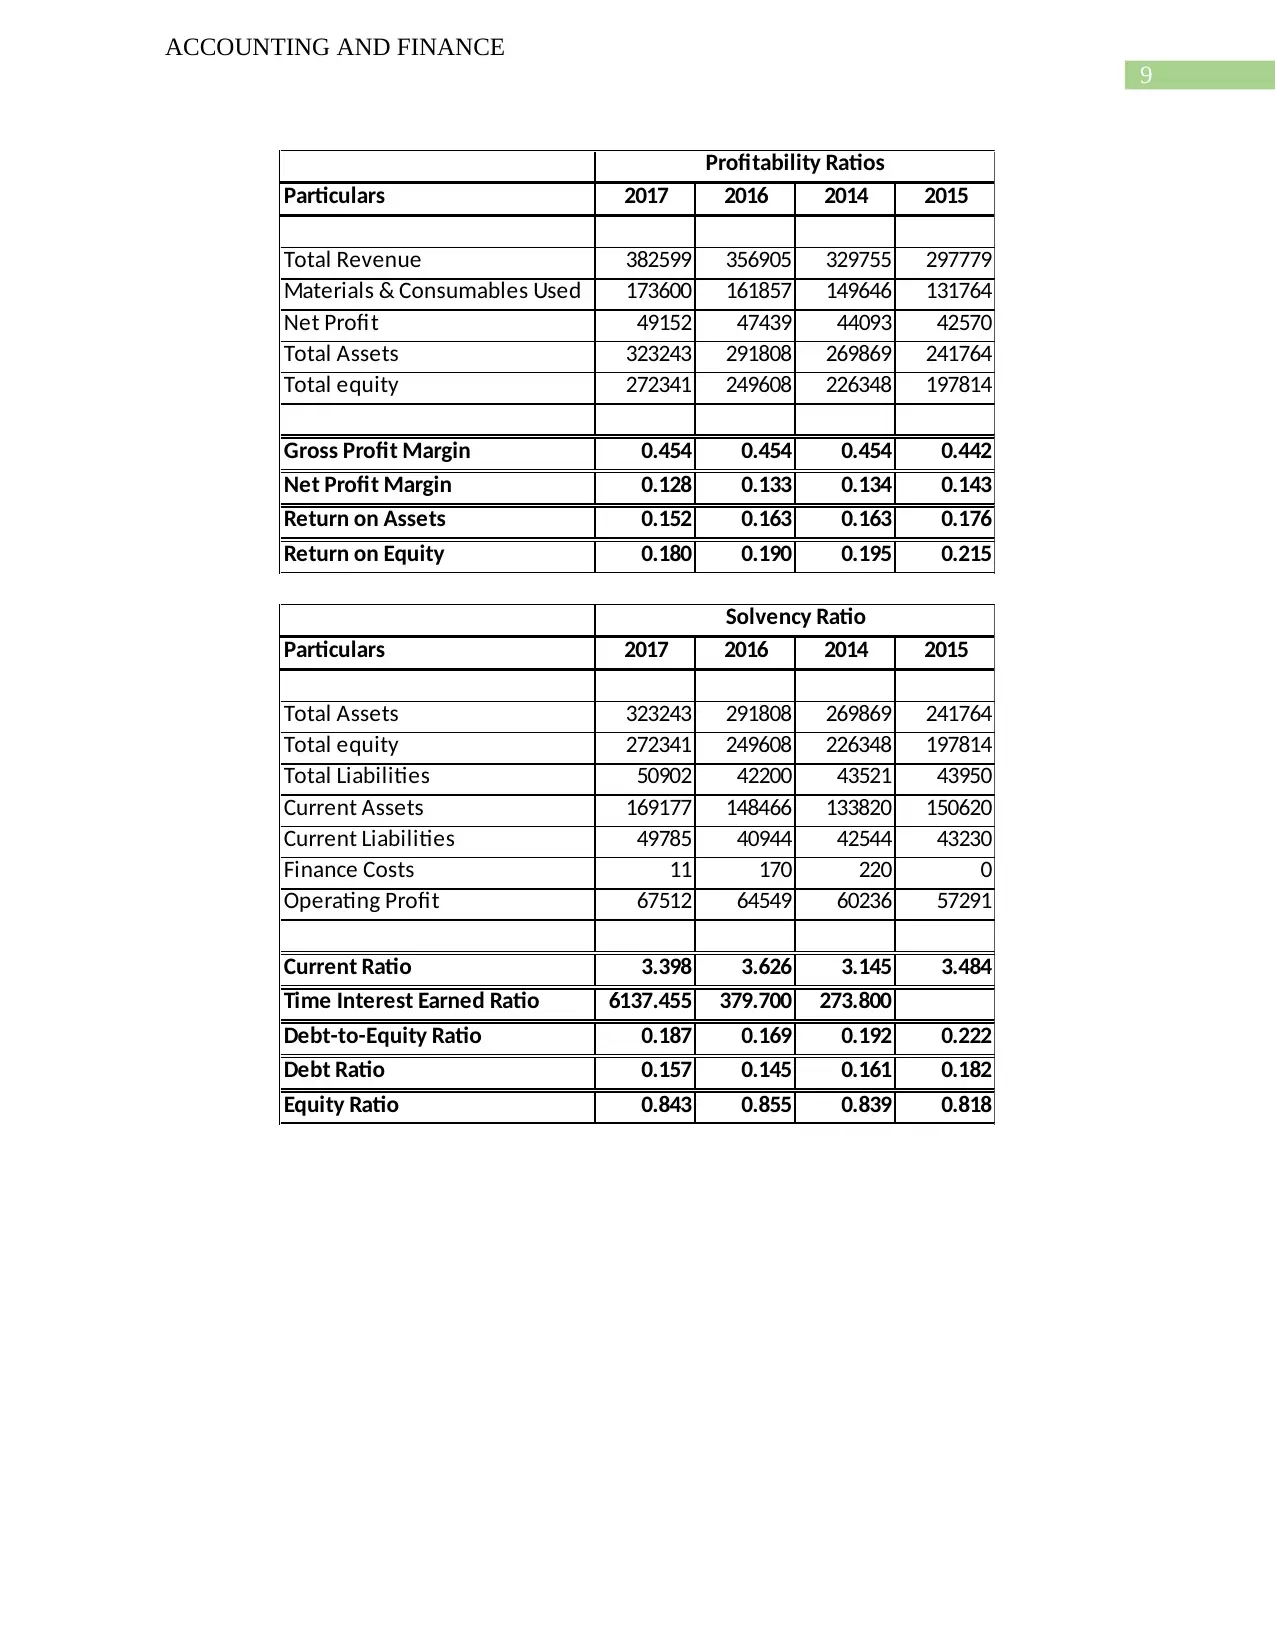
Financial Ratios of ARB Ltd
The current ratio which is covered in the liquidity ratio of the business shows that the
ratio has increased from previous year which suggest that the liquidity situations of the company
has improved. The debt equity ratio shows a slight increase in the ratio from the previous year’s
estimate (Fitó, Moya & Orgaz, 2013). The net profit margin of the company has reduced which
may be due to some issues which the company might be facing with the operational activities of
the business. The efficiency ratio of the business also shows favorable results especially
inventory turnover ratio.
ACCOUNTING AND FINANCE
Comparison between ARB ltd and Modine ltd
For the purpose of conducting a comparative study, Modine ltd is selected which belongs
to the same industry as ARB ltd. The first observation which is made judging by the capital
structure of Modine ltd is that the company has a favorable capital structure and has employed
both equity and debt capital which are $ 421.20 million and 519.90 million respectively. ARB ltd
only has employed equity capital in the capital mix of the business.
Particulars Amount Weightage Amount Weightage
(in '000s) (in million)
Total Equity $2,72,341 100% $421.20 45%
Secured Borrowings:
Short Term Debt $73.4
Current Portion of Long
Term Debt $31.8
Long Term Debt $405.7
Total Secured Borrowings $0 0% $510.90 55%
TOTAL CAPITAL $2,72,341 100% $932 100%
ARB MODINE
COMPARISON with MODINE MANUFACTURING COMPANY
Financial Ratios of ARB Ltd
The current ratio which is covered in the liquidity ratio of the business shows that the
ratio has increased from previous year which suggest that the liquidity situations of the company
has improved. The debt equity ratio shows a slight increase in the ratio from the previous year’s
estimate (Fitó, Moya & Orgaz, 2013). The net profit margin of the company has reduced which
may be due to some issues which the company might be facing with the operational activities of
the business. The efficiency ratio of the business also shows favorable results especially
inventory turnover ratio.
9
ACCOUNTING AND FINANCE
Particulars 2017 2016 2014 2015
Total Revenue 382599 356905 329755 297779
Materials & Consumables Used 173600 161857 149646 131764
Net Profit 49152 47439 44093 42570
Total Assets 323243 291808 269869 241764
Total equity 272341 249608 226348 197814
Gross Profit Margin 0.454 0.454 0.454 0.442
Net Profit Margin 0.128 0.133 0.134 0.143
Return on Assets 0.152 0.163 0.163 0.176
Return on Equity 0.180 0.190 0.195 0.215
Profitability Ratios
Particulars 2017 2016 2014 2015
Total Assets 323243 291808 269869 241764
Total equity 272341 249608 226348 197814
Total Liabilities 50902 42200 43521 43950
Current Assets 169177 148466 133820 150620
Current Liabilities 49785 40944 42544 43230
Finance Costs 11 170 220 0
Operating Profit 67512 64549 60236 57291
Current Ratio 3.398 3.626 3.145 3.484
Time Interest Earned Ratio 6137.455 379.700 273.800
Debt-to-Equity Ratio 0.187 0.169 0.192 0.222
Debt Ratio 0.157 0.145 0.161 0.182
Equity Ratio 0.843 0.855 0.839 0.818
Solvency Ratio
Secure Best Marks with AI Grader
Need help grading? Try our AI Grader for instant feedback on your assignments.
10
ACCOUNTING AND FINANCE
Particulars 2017 2016 2014 2015
Inventory 88020 86941 77821 70443
Trade Receivables 50840 44425 42216 39762
Trade Payables 35279 27754 28874 30202
Cost of Goods Sold 173600 161857 149646 131764
Sales Revenue 382599 356905 329755 297779
Inventory Turnover Ratio 1.972 1.862 1.923 1.871
Payables Turnover Ratio 4.921 5.832 5.183 4.363
Receivables Turnover Ratio 7.526 8.034 7.811 7.489
Efficiency Ratio
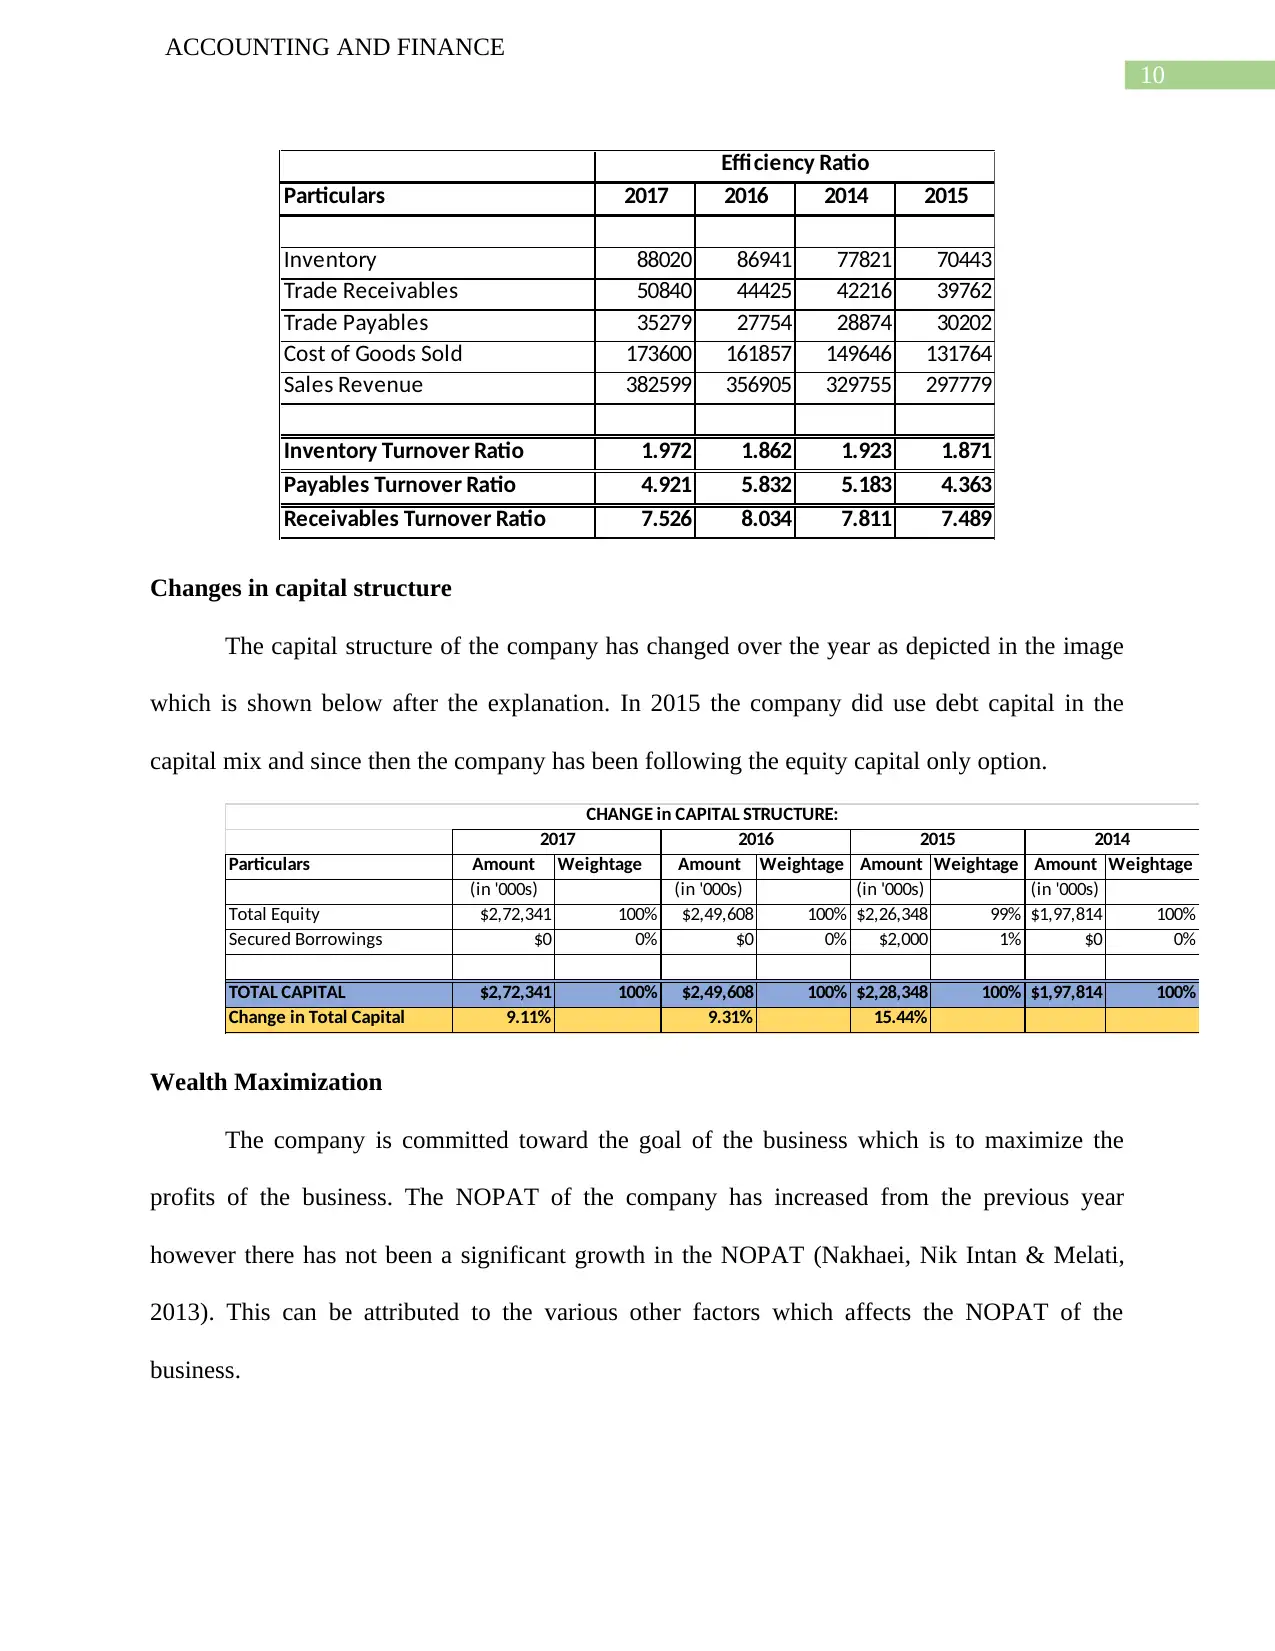
Changes in capital structure
The capital structure of the company has changed over the year as depicted in the image
which is shown below after the explanation. In 2015 the company did use debt capital in the
capital mix and since then the company has been following the equity capital only option.
Particulars Amount Weightage Amount Weightage Amount Weightage Amount Weightage
(in '000s) (in '000s) (in '000s) (in '000s)
Total Equity $2,72,341 100% $2,49,608 100% $2,26,348 99% $1,97,814 100%
Secured Borrowings $0 0% $0 0% $2,000 1% $0 0%
TOTAL CAPITAL $2,72,341 100% $2,49,608 100% $2,28,348 100% $1,97,814 100%
Change in Total Capital 9.11% 9.31% 15.44%
2015 2014
CHANGE in CAPITAL STRUCTURE:
2017 2016
Wealth Maximization
The company is committed toward the goal of the business which is to maximize the
profits of the business. The NOPAT of the company has increased from the previous year
however there has not been a significant growth in the NOPAT (Nakhaei, Nik Intan & Melati,
2013). This can be attributed to the various other factors which affects the NOPAT of the
business.
ACCOUNTING AND FINANCE
Particulars 2017 2016 2014 2015
Inventory 88020 86941 77821 70443
Trade Receivables 50840 44425 42216 39762
Trade Payables 35279 27754 28874 30202
Cost of Goods Sold 173600 161857 149646 131764
Sales Revenue 382599 356905 329755 297779
Inventory Turnover Ratio 1.972 1.862 1.923 1.871
Payables Turnover Ratio 4.921 5.832 5.183 4.363
Receivables Turnover Ratio 7.526 8.034 7.811 7.489
Efficiency Ratio
Changes in capital structure
The capital structure of the company has changed over the year as depicted in the image
which is shown below after the explanation. In 2015 the company did use debt capital in the
capital mix and since then the company has been following the equity capital only option.
Particulars Amount Weightage Amount Weightage Amount Weightage Amount Weightage
(in '000s) (in '000s) (in '000s) (in '000s)
Total Equity $2,72,341 100% $2,49,608 100% $2,26,348 99% $1,97,814 100%
Secured Borrowings $0 0% $0 0% $2,000 1% $0 0%
TOTAL CAPITAL $2,72,341 100% $2,49,608 100% $2,28,348 100% $1,97,814 100%
Change in Total Capital 9.11% 9.31% 15.44%
2015 2014
CHANGE in CAPITAL STRUCTURE:
2017 2016
Wealth Maximization
The company is committed toward the goal of the business which is to maximize the
profits of the business. The NOPAT of the company has increased from the previous year
however there has not been a significant growth in the NOPAT (Nakhaei, Nik Intan & Melati,
2013). This can be attributed to the various other factors which affects the NOPAT of the
business.
11
ACCOUNTING AND FINANCE
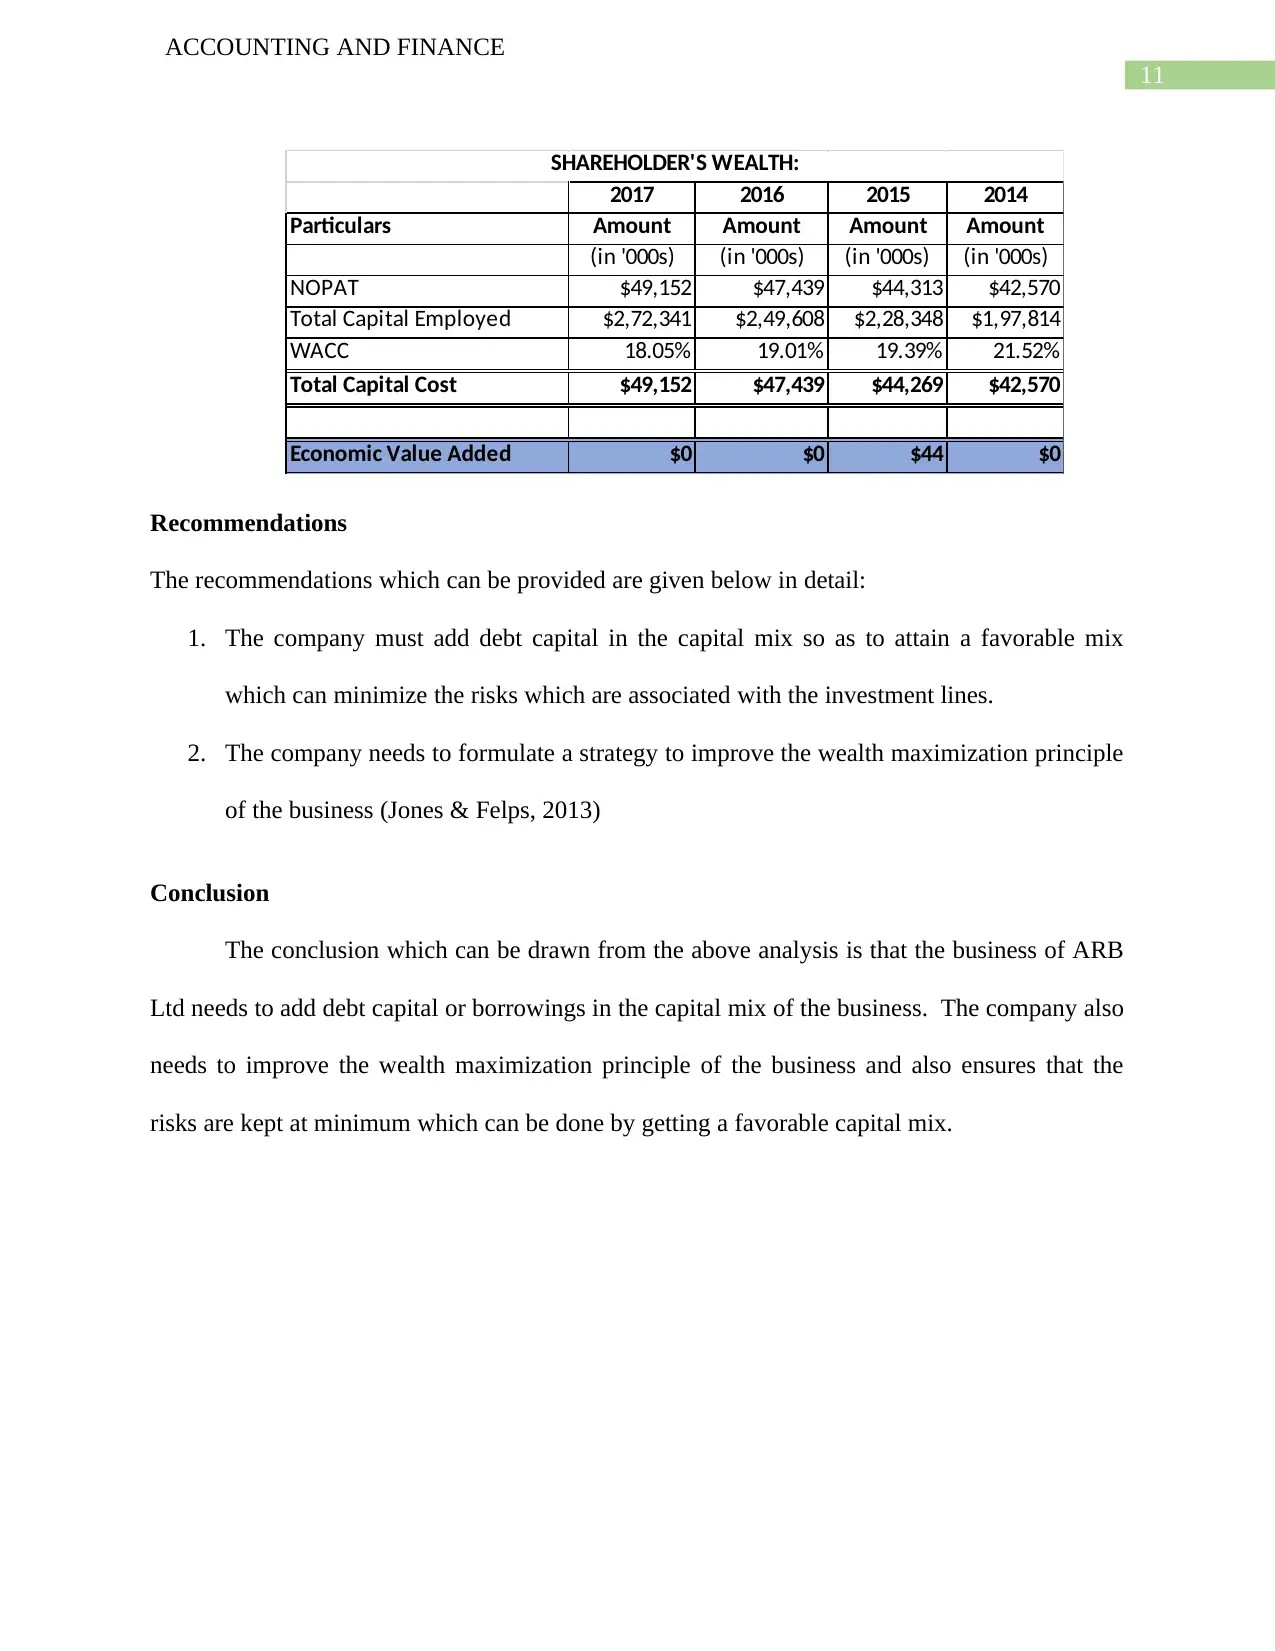
2017 2016 2015 2014
Particulars Amount Amount Amount Amount
(in '000s) (in '000s) (in '000s) (in '000s)
NOPAT $49,152 $47,439 $44,313 $42,570
Total Capital Employed $2,72,341 $2,49,608 $2,28,348 $1,97,814
WACC 18.05% 19.01% 19.39% 21.52%
Total Capital Cost $49,152 $47,439 $44,269 $42,570
Economic Value Added $0 $0 $44 $0
SHAREHOLDER'S WEALTH:
Recommendations
The recommendations which can be provided are given below in detail:
1. The company must add debt capital in the capital mix so as to attain a favorable mix
which can minimize the risks which are associated with the investment lines.
2. The company needs to formulate a strategy to improve the wealth maximization principle
of the business (Jones & Felps, 2013)
Conclusion
The conclusion which can be drawn from the above analysis is that the business of ARB
Ltd needs to add debt capital or borrowings in the capital mix of the business. The company also
needs to improve the wealth maximization principle of the business and also ensures that the
risks are kept at minimum which can be done by getting a favorable capital mix.
ACCOUNTING AND FINANCE
2017 2016 2015 2014
Particulars Amount Amount Amount Amount
(in '000s) (in '000s) (in '000s) (in '000s)
NOPAT $49,152 $47,439 $44,313 $42,570
Total Capital Employed $2,72,341 $2,49,608 $2,28,348 $1,97,814
WACC 18.05% 19.01% 19.39% 21.52%
Total Capital Cost $49,152 $47,439 $44,269 $42,570
Economic Value Added $0 $0 $44 $0
SHAREHOLDER'S WEALTH:
Recommendations
The recommendations which can be provided are given below in detail:
1. The company must add debt capital in the capital mix so as to attain a favorable mix
which can minimize the risks which are associated with the investment lines.
2. The company needs to formulate a strategy to improve the wealth maximization principle
of the business (Jones & Felps, 2013)
Conclusion
The conclusion which can be drawn from the above analysis is that the business of ARB
Ltd needs to add debt capital or borrowings in the capital mix of the business. The company also
needs to improve the wealth maximization principle of the business and also ensures that the
risks are kept at minimum which can be done by getting a favorable capital mix.
12
ACCOUNTING AND FINANCE
Reference
Baker, M., & Wurgler, J. (2015). Do strict capital requirements raise the cost of capital? Bank
regulation, capital structure, and the low-risk anomaly. American Economic Review, 105(5), 315-
20.
Fitó, M. À., Moya, S., & Orgaz, N. (2013). Considering the effects of operating lease capitalization
on key financial ratios. Spanish Journal of Finance and Accounting/Revista Española de
Financiación y Contabilidad, 42(159), 341-369.
Graham, J. R., Leary, M. T., & Roberts, M. R. (2015). A century of capital structure: The
leveraging of corporate America. Journal of Financial Economics, 118(3), 658-683.
Jones, T. M., & Felps, W. (2013). Shareholder wealth maximization and social welfare: A
utilitarian critique. Business Ethics Quarterly, 23(2), 207-238.
Lin, C. Y., & Okudan, G. E. (2013). Planning for multiple-generation product lines using dynamic
variable state models with data input from similar products. Expert systems with
applications, 40(6).
Nakhaei, H., Nik Intan, H., & Melati, A. (2013). Analyzing the relationship between economic
value added (EVA) and accounting variables with share market value in Tehran stock exchange
(TSE). Middle-East Journal of Scientific Research, 16(11), 1589-1598.
Sanchez, A., Sevilla-Güitrón, V., Magaña, G., & Gutierrez, L. (2013). Parametric analysis of total
costs and energy efficiency of 2G enzymatic ethanol production. Fuel, 113, 165-179.
1 out of 13
Related Documents


Your All-in-One AI-Powered Toolkit for Academic Success.
+13062052269
info@desklib.com
Available 24*7 on WhatsApp / Email
![[object Object]](/_next/static/media/star-bottom.7253800d.svg)
Unlock your academic potential
© 2024 | Zucol Services PVT LTD | All rights reserved.