Sainsbury Plc: Financial Ratio Analysis and Performance Review
VerifiedAdded on 2020/12/29
|12
|3170
|190
Report
AI Summary
This report provides a comprehensive financial analysis of Sainsbury Plc, focusing on the years 2015, 2016, and 2017. The analysis includes the calculation and interpretation of various financial ratios, such as profitability, liquidity, efficiency, and market ratios. The report examines Sainsbury's performance in terms of return on capital employed, operating profit, gross profit margin, current ratio, quick ratio, settlement periods for trade receivables and payables, and inventory turnover. It also includes an overview of Sainsbury's background and business operations, along with an assessment of its financial stability and performance. Furthermore, the report offers recommendations for improvement and discusses the merits and demerits of using financial ratios for decision-making, catering to the expectations of potential investors. The analysis highlights trends and provides insights into Sainsbury's financial health over the specified period.
Accounting and Finance
Paraphrase This Document
Need a fresh take? Get an instant paraphrase of this document with our AI Paraphraser
TABLE OF CONTENTS
INTRODUCTION ..........................................................................................................................3
1. Justifying organisation's performance along with its background..........................................3
2. Defining and calculating financial ratios of Sainsbury Plc for the period of 2015, 2016 and
2017.............................................................................................................................................3
3. Analyzing performance of Sainsbury over the period and give recommendations for
improvement...............................................................................................................................4
4. Elaborating merits and demerits of financial ratios................................................................8
CONCLUSION ...............................................................................................................................9
REFERENCES..............................................................................................................................11
INTRODUCTION
Financial management is replicated as managing money in proper and efficient manner
in order to accomplishing the goals and objective of any specific organizations. It is directly
associated with the board committees or top management. Financial stratgey of any
organization or company is directly interlinked with this specific term but on its contrary
individual management strategy has relationship with personal finance or financial life
management. The present report is giving brief description about appropriate analysis of finance
by choosing organization which is listed on London Stock Exchange i.e. Sainsburry Plc. It has
been undertaken by considering profitability, liquidity, efficiency and market indicator. Further
it has elaborated about financial performance and stability of organization through non financial
information as well. In this report, recommendations has been provided in context of
management and potential investor whose expectation is about £2 million for investing in
particular organization. In the same series, various merits and demerits of financial ratios has
been elaborated and comparison of different ratios along with different decisions which are
relevant has been interpreted.
1. Justifying organisation's performance along with its background.
Sainsbury has gained second position with 16.9% share in context of supermarkets in
the United Kingdom. The organization was founded by the James Sainsbury with a shop in
duary lane in London. It became the largest seller of groceries in 1922. J Sainsbury plc is
directly involved in retailing grocery related products in the United Kingdom.
Financial report of Sainsbury of November 2017 in November 2107, Sainsbury hit by
sharp fall in quarterly sales growth. The retailer told that in the same store sales rose by 0.6% in
3 months to September compared with the same time in last year. This contrasted with the 2.3
% quarterly growth in July (Stent and et. al., 2017). Sainsbury’s, which has adopted pricing
strategy for purpose of promoting special offers to an approach of low prices every day. It had
also reported a decrease in pre-tax margin for the half-year till June. Earnings which were
measured on this basis resulted as £220m, as it is compared with £372m this year.
2. Defining and calculating financial ratios of Sainsbury Plc for the period of 2015, 2016 and
2017
Ratio analysis of Sainsbury for the period of 3 years is as follows:
⊘ This is a preview!⊘
Do you want full access?
Subscribe today to unlock all pages.
Trusted by 1+ million students worldwide
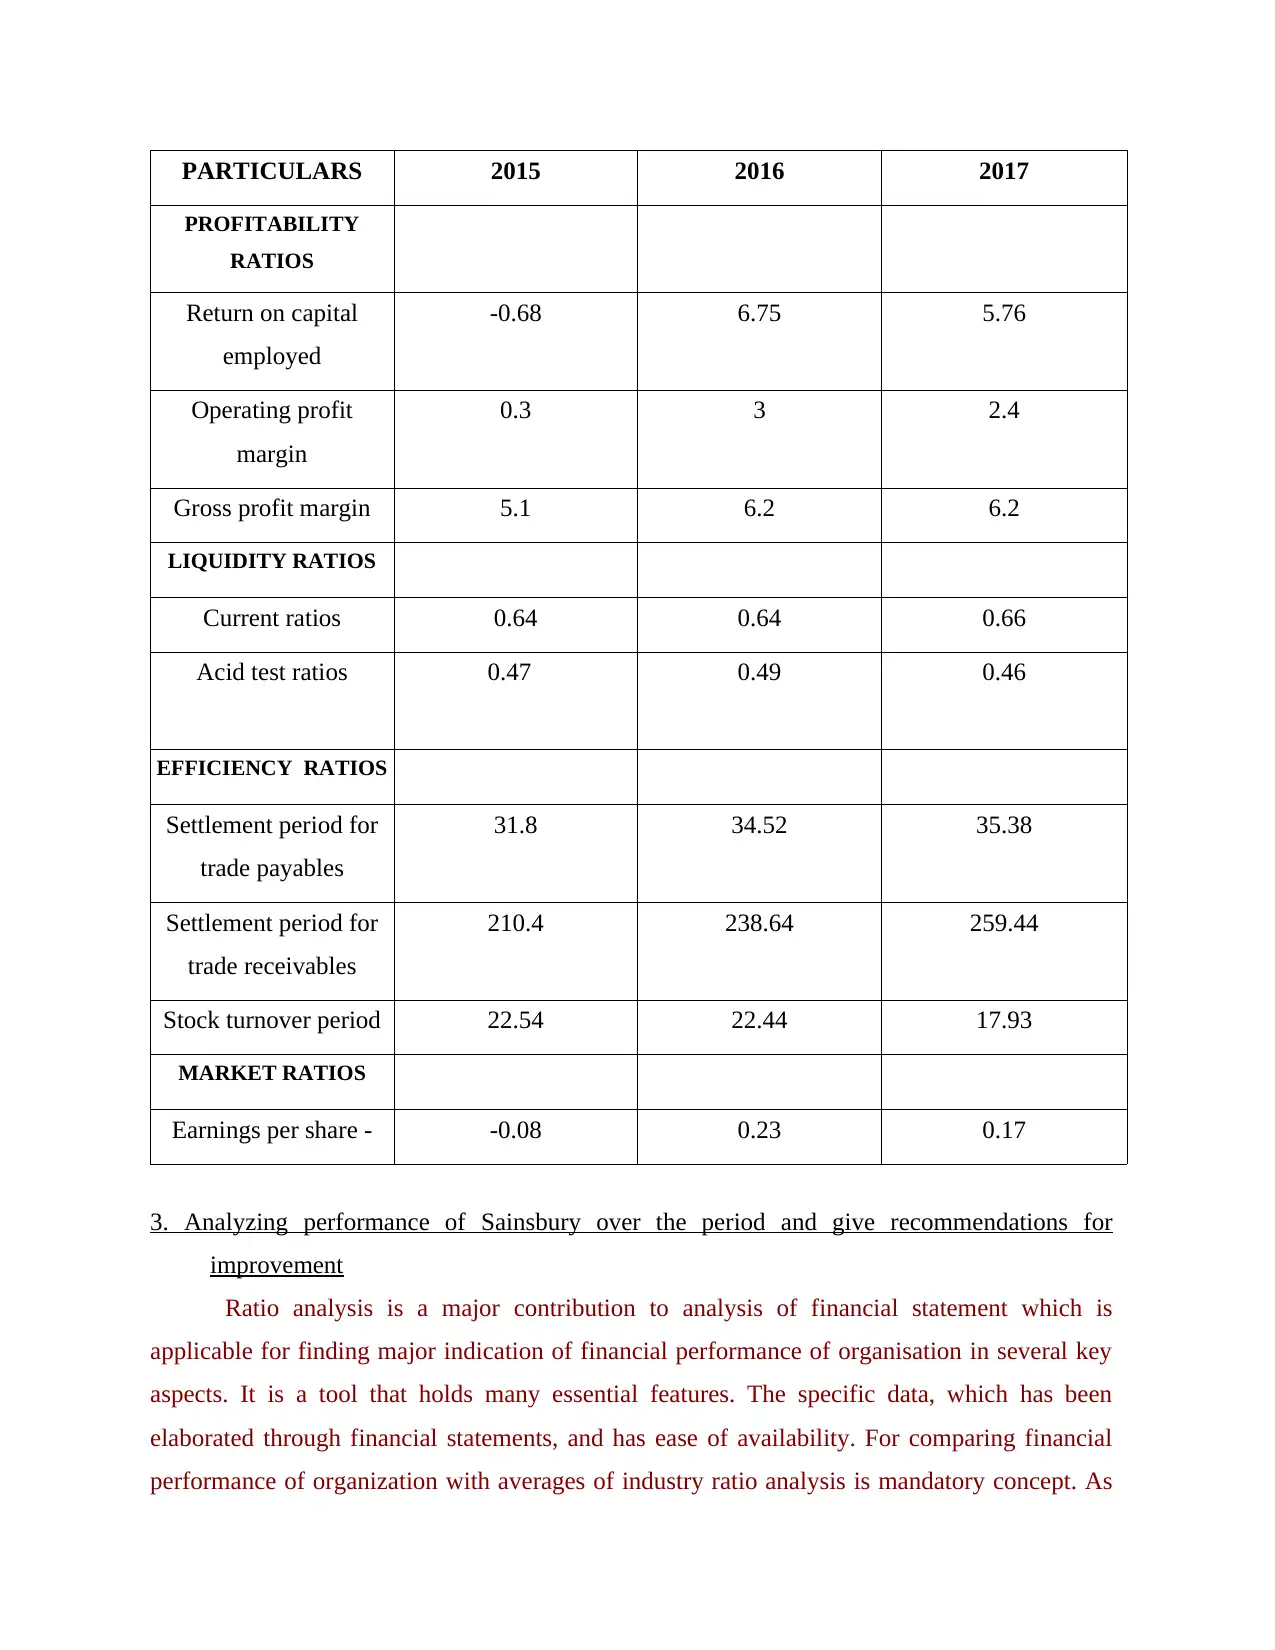
PARTICULARS 2015 2016 2017
PROFITABILITY
RATIOS
Return on capital
employed
-0.68 6.75 5.76
Operating profit
margin
0.3 3 2.4
Gross profit margin 5.1 6.2 6.2
LIQUIDITY RATIOS
Current ratios 0.64 0.64 0.66
Acid test ratios 0.47 0.49 0.46
EFFICIENCY RATIOS
Settlement period for
trade payables
31.8 34.52 35.38
Settlement period for
trade receivables
210.4 238.64 259.44
Stock turnover period 22.54 22.44 17.93
MARKET RATIOS
Earnings per share - -0.08 0.23 0.17
3. Analyzing performance of Sainsbury over the period and give recommendations for
improvement
Ratio analysis is a major contribution to analysis of financial statement which is
applicable for finding major indication of financial performance of organisation in several key
aspects. It is a tool that holds many essential features. The specific data, which has been
elaborated through financial statements, and has ease of availability. For comparing financial
performance of organization with averages of industry ratio analysis is mandatory concept. As
Paraphrase This Document
Need a fresh take? Get an instant paraphrase of this document with our AI Paraphraser
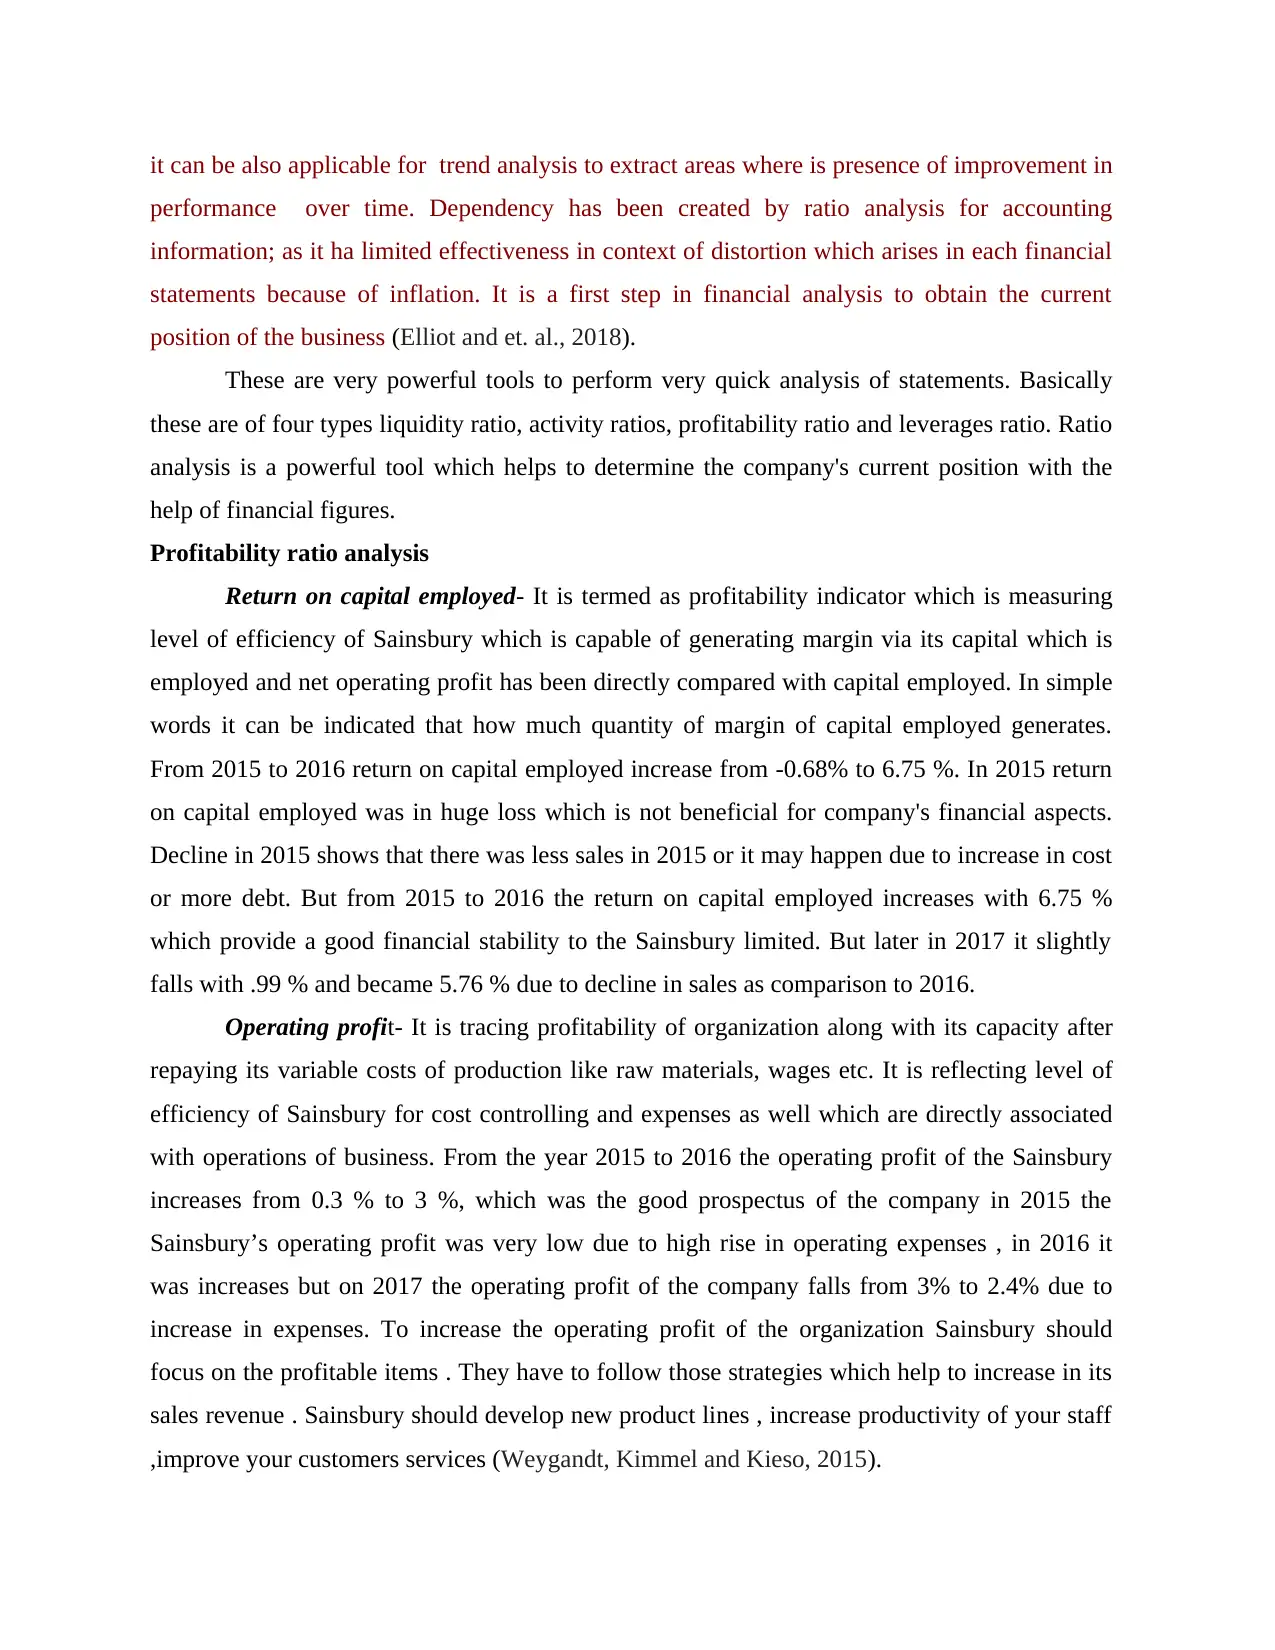
it can be also applicable for trend analysis to extract areas where is presence of improvement in
performance over time. Dependency has been created by ratio analysis for accounting
information; as it ha limited effectiveness in context of distortion which arises in each financial
statements because of inflation. It is a first step in financial analysis to obtain the current
position of the business (Elliot and et. al., 2018).
These are very powerful tools to perform very quick analysis of statements. Basically
these are of four types liquidity ratio, activity ratios, profitability ratio and leverages ratio. Ratio
analysis is a powerful tool which helps to determine the company's current position with the
help of financial figures.
Profitability ratio analysis
Return on capital employed- It is termed as profitability indicator which is measuring
level of efficiency of Sainsbury which is capable of generating margin via its capital which is
employed and net operating profit has been directly compared with capital employed. In simple
words it can be indicated that how much quantity of margin of capital employed generates.
From 2015 to 2016 return on capital employed increase from -0.68% to 6.75 %. In 2015 return
on capital employed was in huge loss which is not beneficial for company's financial aspects.
Decline in 2015 shows that there was less sales in 2015 or it may happen due to increase in cost
or more debt. But from 2015 to 2016 the return on capital employed increases with 6.75 %
which provide a good financial stability to the Sainsbury limited. But later in 2017 it slightly
falls with .99 % and became 5.76 % due to decline in sales as comparison to 2016.
Operating profit- It is tracing profitability of organization along with its capacity after
repaying its variable costs of production like raw materials, wages etc. It is reflecting level of
efficiency of Sainsbury for cost controlling and expenses as well which are directly associated
with operations of business. From the year 2015 to 2016 the operating profit of the Sainsbury
increases from 0.3 % to 3 %, which was the good prospectus of the company in 2015 the
Sainsbury’s operating profit was very low due to high rise in operating expenses , in 2016 it
was increases but on 2017 the operating profit of the company falls from 3% to 2.4% due to
increase in expenses. To increase the operating profit of the organization Sainsbury should
focus on the profitable items . They have to follow those strategies which help to increase in its
sales revenue . Sainsbury should develop new product lines , increase productivity of your staff
,improve your customers services (Weygandt, Kimmel and Kieso, 2015).
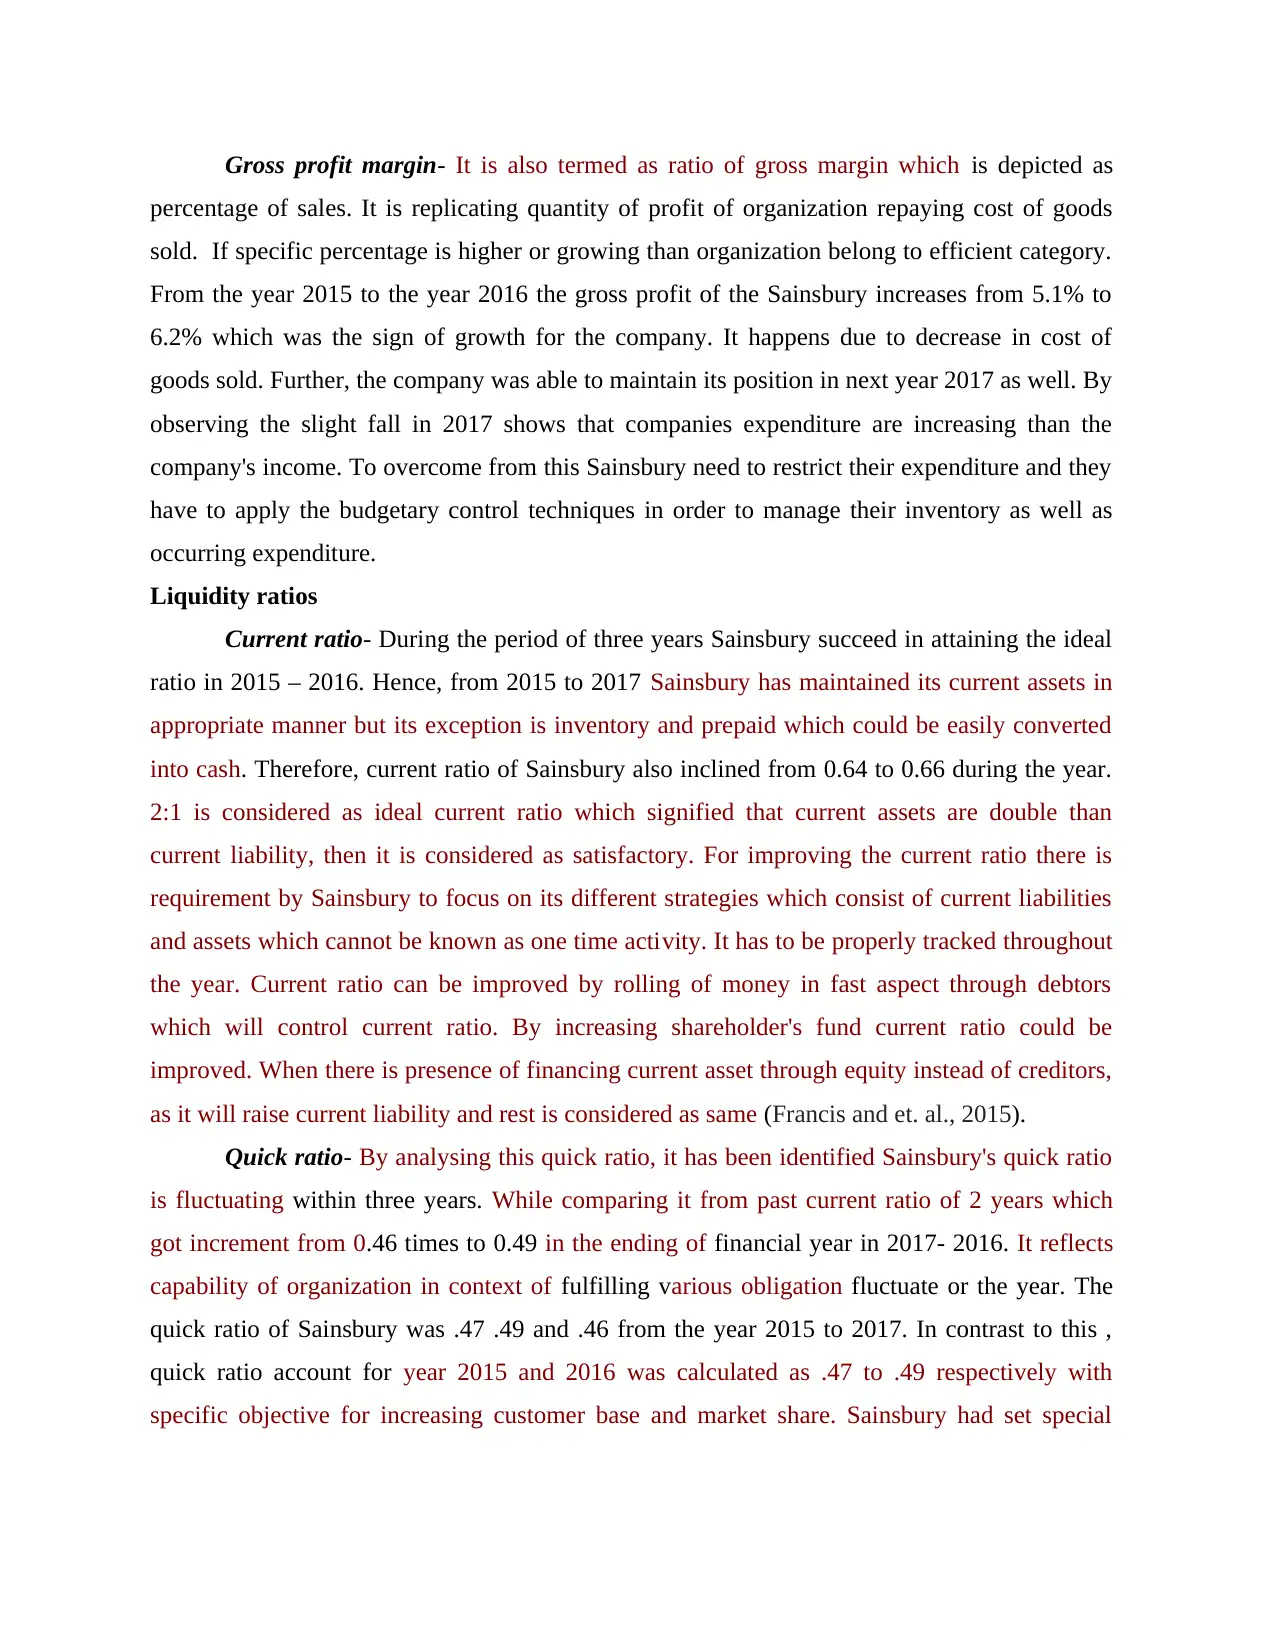
Gross profit margin- It is also termed as ratio of gross margin which is depicted as
percentage of sales. It is replicating quantity of profit of organization repaying cost of goods
sold. If specific percentage is higher or growing than organization belong to efficient category.
From the year 2015 to the year 2016 the gross profit of the Sainsbury increases from 5.1% to
6.2% which was the sign of growth for the company. It happens due to decrease in cost of
goods sold. Further, the company was able to maintain its position in next year 2017 as well. By
observing the slight fall in 2017 shows that companies expenditure are increasing than the
company's income. To overcome from this Sainsbury need to restrict their expenditure and they
have to apply the budgetary control techniques in order to manage their inventory as well as
occurring expenditure.
Liquidity ratios
Current ratio- During the period of three years Sainsbury succeed in attaining the ideal
ratio in 2015 – 2016. Hence, from 2015 to 2017 Sainsbury has maintained its current assets in
appropriate manner but its exception is inventory and prepaid which could be easily converted
into cash. Therefore, current ratio of Sainsbury also inclined from 0.64 to 0.66 during the year.
2:1 is considered as ideal current ratio which signified that current assets are double than
current liability, then it is considered as satisfactory. For improving the current ratio there is
requirement by Sainsbury to focus on its different strategies which consist of current liabilities
and assets which cannot be known as one time activity. It has to be properly tracked throughout
the year. Current ratio can be improved by rolling of money in fast aspect through debtors
which will control current ratio. By increasing shareholder's fund current ratio could be
improved. When there is presence of financing current asset through equity instead of creditors,
as it will raise current liability and rest is considered as same (Francis and et. al., 2015).
Quick ratio- By analysing this quick ratio, it has been identified Sainsbury's quick ratio
is fluctuating within three years. While comparing it from past current ratio of 2 years which
got increment from 0.46 times to 0.49 in the ending of financial year in 2017- 2016. It reflects
capability of organization in context of fulfilling various obligation fluctuate or the year. The
quick ratio of Sainsbury was .47 .49 and .46 from the year 2015 to 2017. In contrast to this ,
quick ratio account for year 2015 and 2016 was calculated as .47 to .49 respectively with
specific objective for increasing customer base and market share. Sainsbury had set special
⊘ This is a preview!⊘
Do you want full access?
Subscribe today to unlock all pages.
Trusted by 1+ million students worldwide
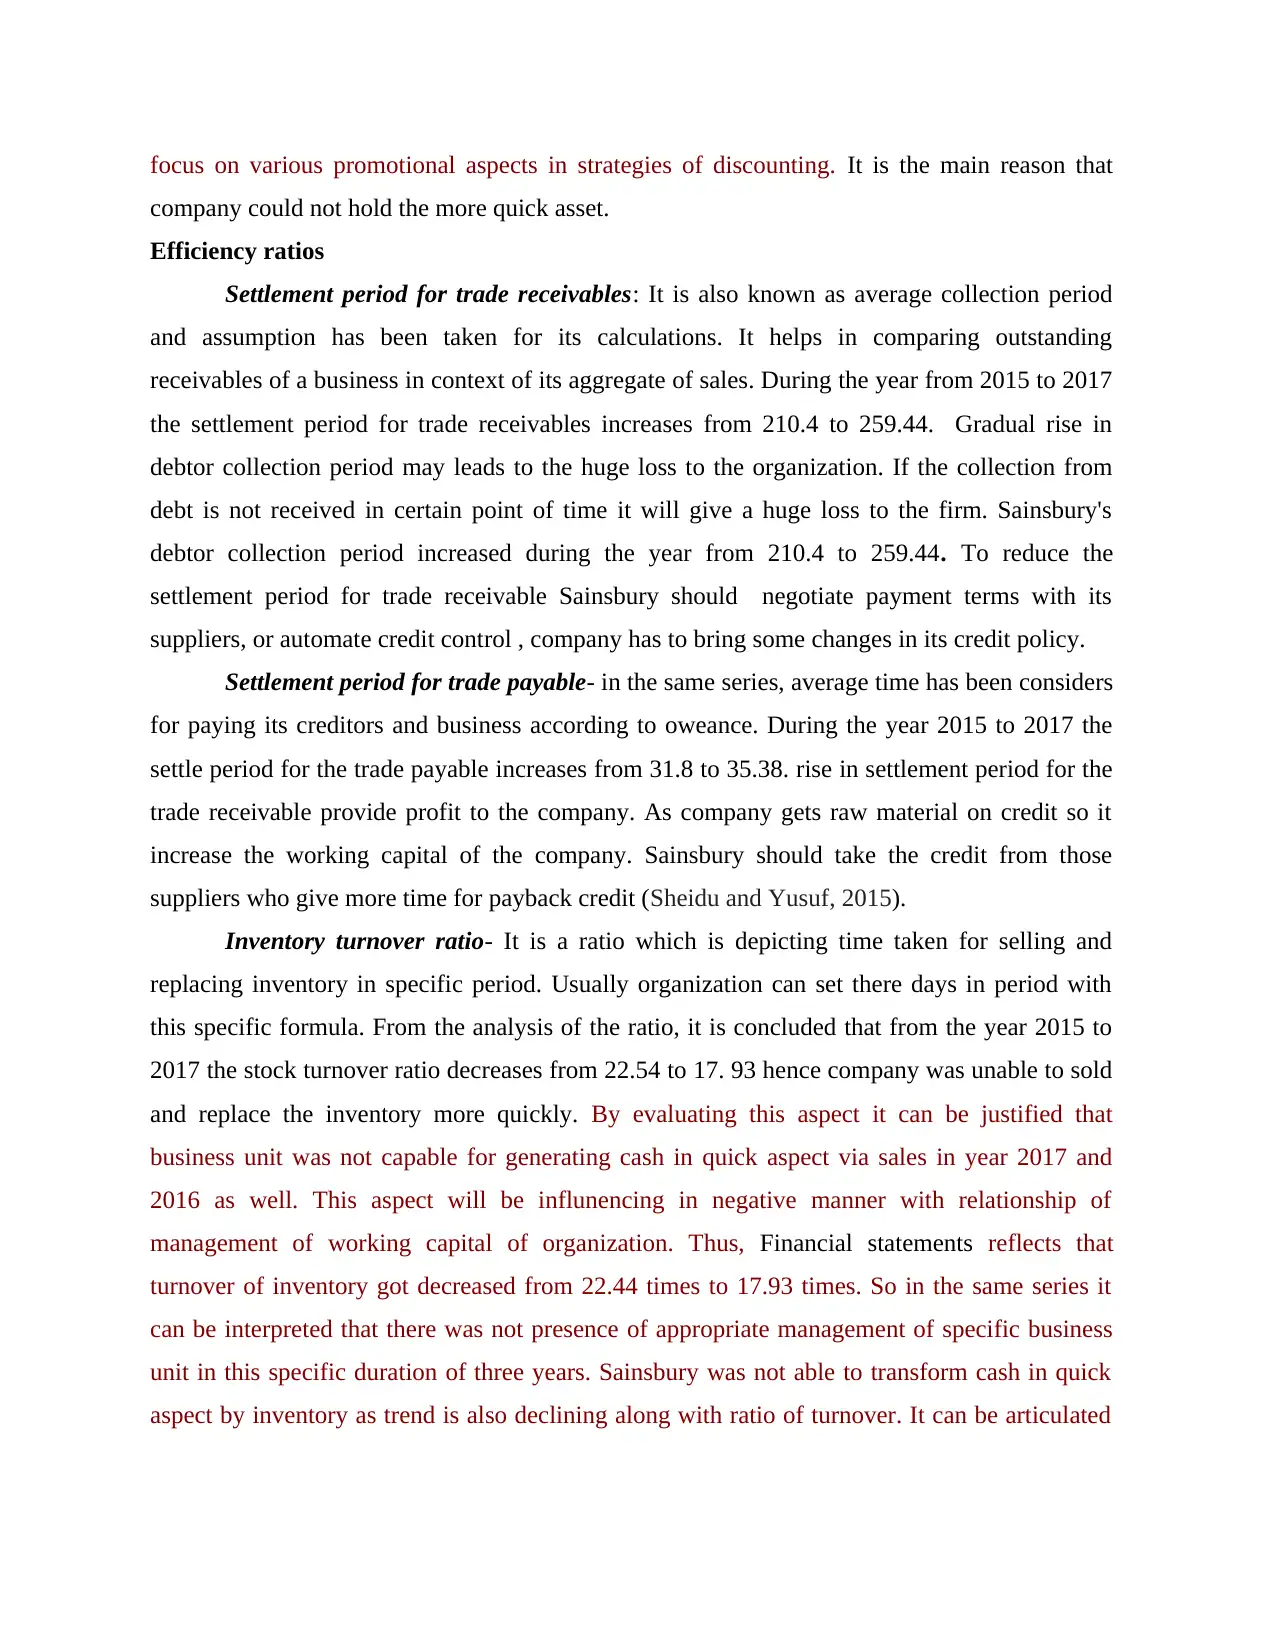
focus on various promotional aspects in strategies of discounting. It is the main reason that
company could not hold the more quick asset.
Efficiency ratios
Settlement period for trade receivables: It is also known as average collection period
and assumption has been taken for its calculations. It helps in comparing outstanding
receivables of a business in context of its aggregate of sales. During the year from 2015 to 2017
the settlement period for trade receivables increases from 210.4 to 259.44. Gradual rise in
debtor collection period may leads to the huge loss to the organization. If the collection from
debt is not received in certain point of time it will give a huge loss to the firm. Sainsbury's
debtor collection period increased during the year from 210.4 to 259.44. To reduce the
settlement period for trade receivable Sainsbury should negotiate payment terms with its
suppliers, or automate credit control , company has to bring some changes in its credit policy.
Settlement period for trade payable- in the same series, average time has been considers
for paying its creditors and business according to oweance. During the year 2015 to 2017 the
settle period for the trade payable increases from 31.8 to 35.38. rise in settlement period for the
trade receivable provide profit to the company. As company gets raw material on credit so it
increase the working capital of the company. Sainsbury should take the credit from those
suppliers who give more time for payback credit (Sheidu and Yusuf, 2015).
Inventory turnover ratio- It is a ratio which is depicting time taken for selling and
replacing inventory in specific period. Usually organization can set there days in period with
this specific formula. From the analysis of the ratio, it is concluded that from the year 2015 to
2017 the stock turnover ratio decreases from 22.54 to 17. 93 hence company was unable to sold
and replace the inventory more quickly. By evaluating this aspect it can be justified that
business unit was not capable for generating cash in quick aspect via sales in year 2017 and
2016 as well. This aspect will be influnencing in negative manner with relationship of
management of working capital of organization. Thus, Financial statements reflects that
turnover of inventory got decreased from 22.44 times to 17.93 times. So in the same series it
can be interpreted that there was not presence of appropriate management of specific business
unit in this specific duration of three years. Sainsbury was not able to transform cash in quick
aspect by inventory as trend is also declining along with ratio of turnover. It can be articulated
Paraphrase This Document
Need a fresh take? Get an instant paraphrase of this document with our AI Paraphraser
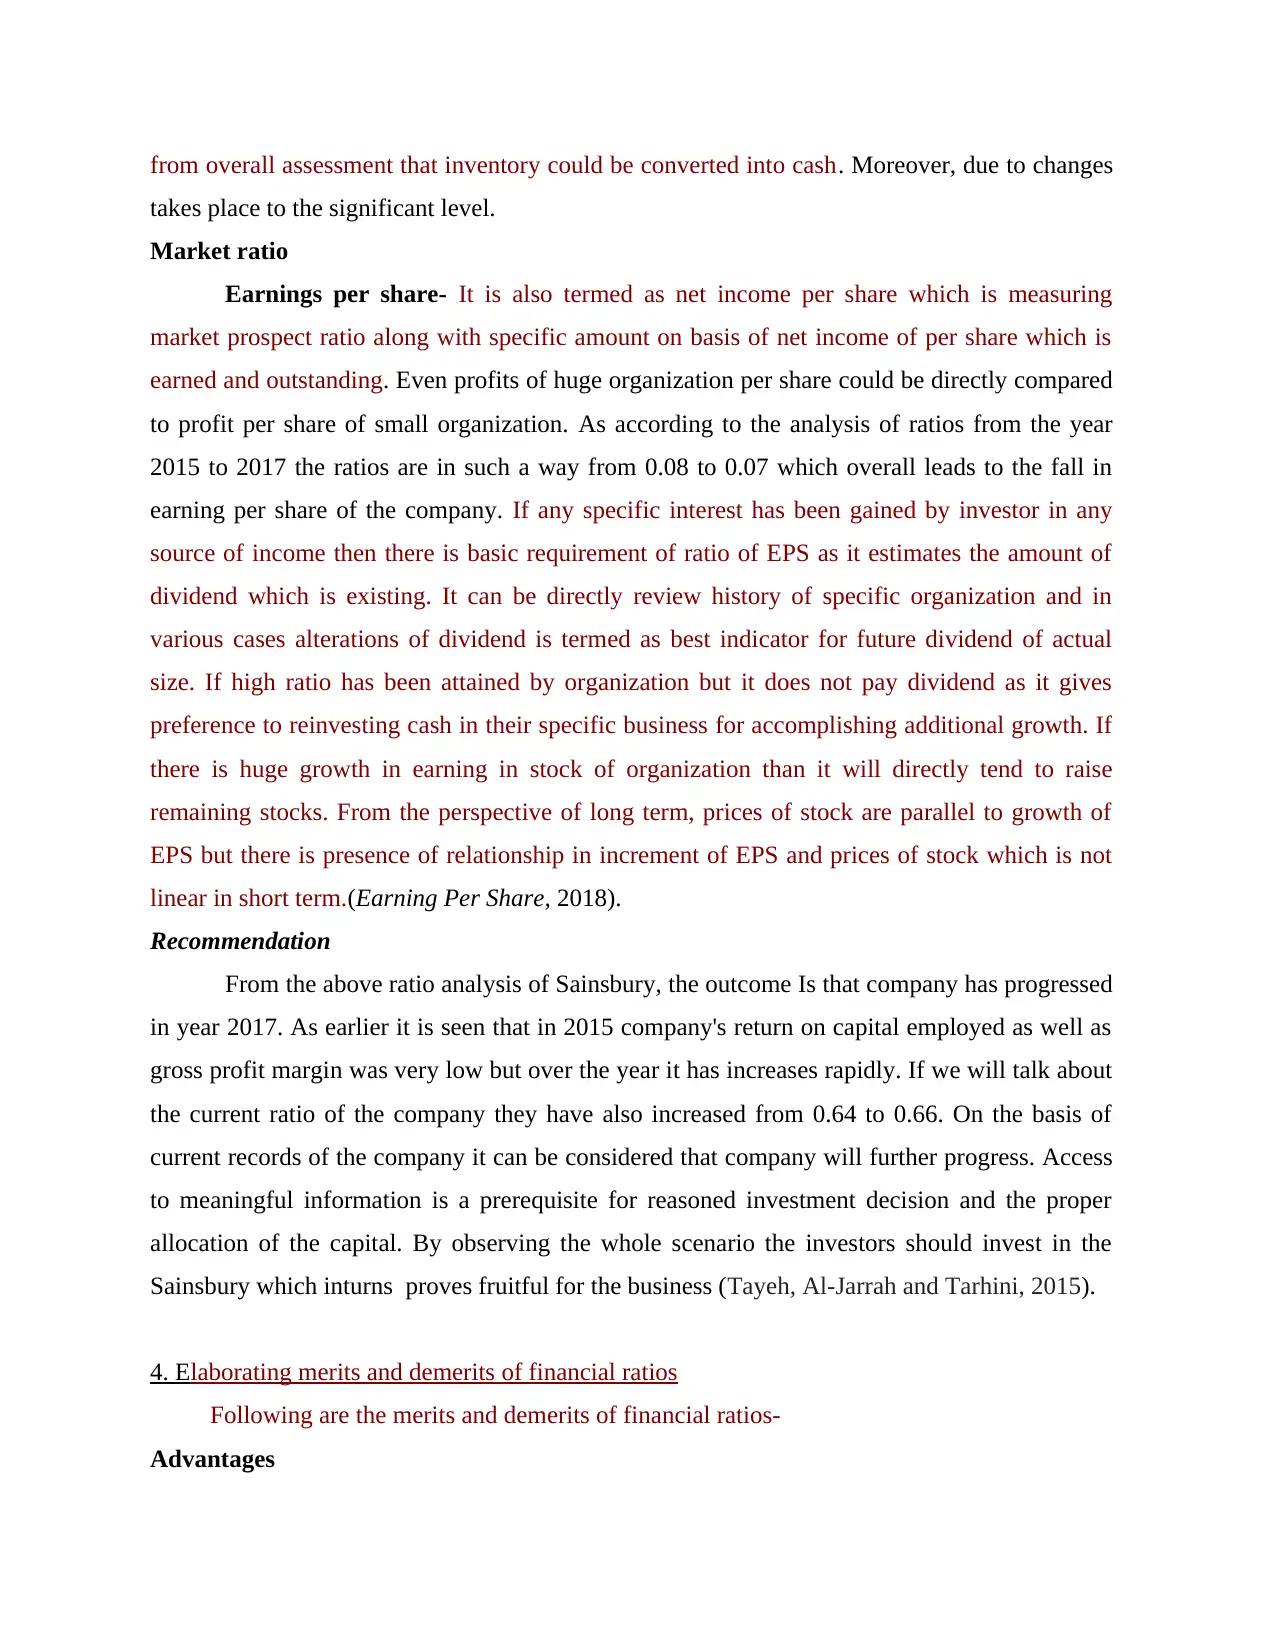
from overall assessment that inventory could be converted into cash. Moreover, due to changes
takes place to the significant level.
Market ratio
Earnings per share- It is also termed as net income per share which is measuring
market prospect ratio along with specific amount on basis of net income of per share which is
earned and outstanding. Even profits of huge organization per share could be directly compared
to profit per share of small organization. As according to the analysis of ratios from the year
2015 to 2017 the ratios are in such a way from 0.08 to 0.07 which overall leads to the fall in
earning per share of the company. If any specific interest has been gained by investor in any
source of income then there is basic requirement of ratio of EPS as it estimates the amount of
dividend which is existing. It can be directly review history of specific organization and in
various cases alterations of dividend is termed as best indicator for future dividend of actual
size. If high ratio has been attained by organization but it does not pay dividend as it gives
preference to reinvesting cash in their specific business for accomplishing additional growth. If
there is huge growth in earning in stock of organization than it will directly tend to raise
remaining stocks. From the perspective of long term, prices of stock are parallel to growth of
EPS but there is presence of relationship in increment of EPS and prices of stock which is not
linear in short term.(Earning Per Share, 2018).
Recommendation
From the above ratio analysis of Sainsbury, the outcome Is that company has progressed
in year 2017. As earlier it is seen that in 2015 company's return on capital employed as well as
gross profit margin was very low but over the year it has increases rapidly. If we will talk about
the current ratio of the company they have also increased from 0.64 to 0.66. On the basis of
current records of the company it can be considered that company will further progress. Access
to meaningful information is a prerequisite for reasoned investment decision and the proper
allocation of the capital. By observing the whole scenario the investors should invest in the
Sainsbury which inturns proves fruitful for the business (Tayeh, Al-Jarrah and Tarhini, 2015).
4. Elaborating merits and demerits of financial ratios
Following are the merits and demerits of financial ratios-
Advantages
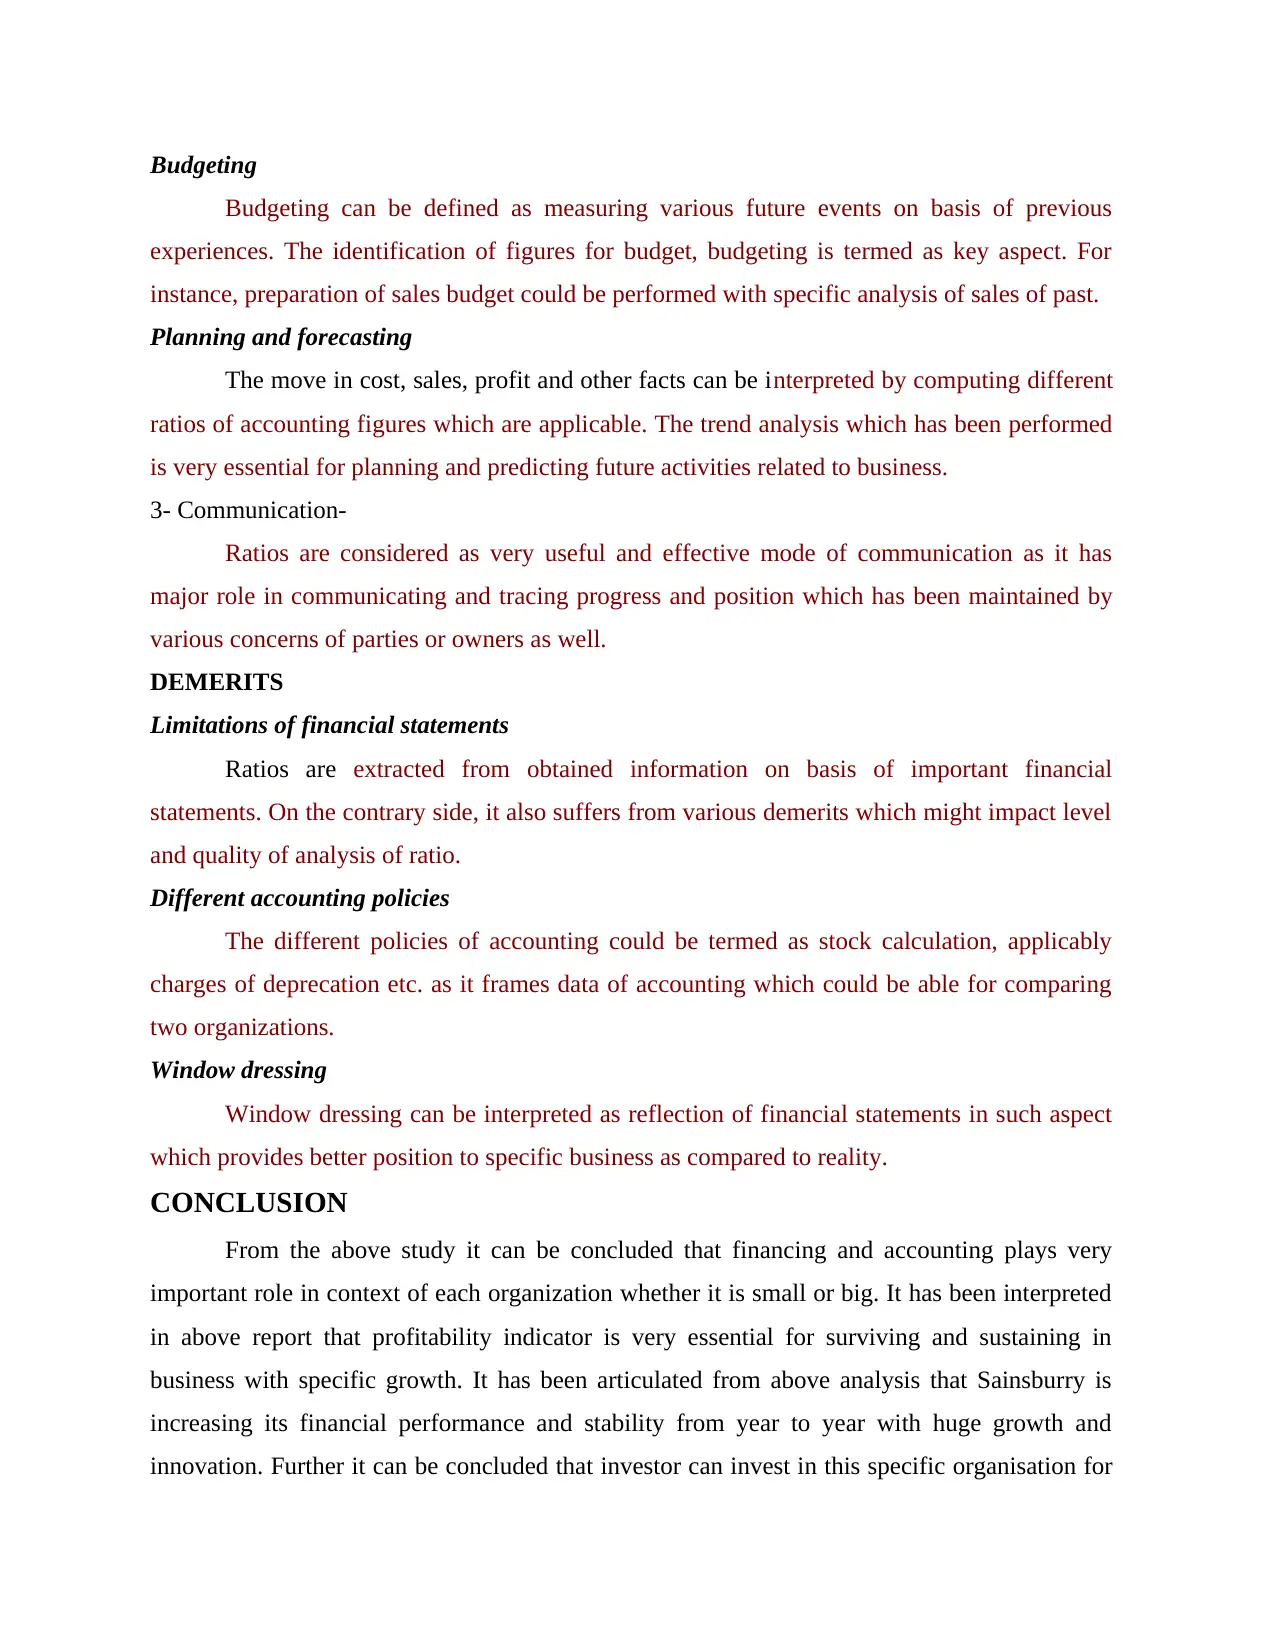
Budgeting
Budgeting can be defined as measuring various future events on basis of previous
experiences. The identification of figures for budget, budgeting is termed as key aspect. For
instance, preparation of sales budget could be performed with specific analysis of sales of past.
Planning and forecasting
The move in cost, sales, profit and other facts can be interpreted by computing different
ratios of accounting figures which are applicable. The trend analysis which has been performed
is very essential for planning and predicting future activities related to business.
3- Communication-
Ratios are considered as very useful and effective mode of communication as it has
major role in communicating and tracing progress and position which has been maintained by
various concerns of parties or owners as well.
DEMERITS
Limitations of financial statements
Ratios are extracted from obtained information on basis of important financial
statements. On the contrary side, it also suffers from various demerits which might impact level
and quality of analysis of ratio.
Different accounting policies
The different policies of accounting could be termed as stock calculation, applicably
charges of deprecation etc. as it frames data of accounting which could be able for comparing
two organizations.
Window dressing
Window dressing can be interpreted as reflection of financial statements in such aspect
which provides better position to specific business as compared to reality.
CONCLUSION
From the above study it can be concluded that financing and accounting plays very
important role in context of each organization whether it is small or big. It has been interpreted
in above report that profitability indicator is very essential for surviving and sustaining in
business with specific growth. It has been articulated from above analysis that Sainsburry is
increasing its financial performance and stability from year to year with huge growth and
innovation. Further it can be concluded that investor can invest in this specific organisation for
⊘ This is a preview!⊘
Do you want full access?
Subscribe today to unlock all pages.
Trusted by 1+ million students worldwide
purpose of accomplishing growth and better decisions regarding investment by evaluating
various merits and demerits of specific financial ratios.
various merits and demerits of specific financial ratios.
Paraphrase This Document
Need a fresh take? Get an instant paraphrase of this document with our AI Paraphraser
REFERENCES
Books and Journals
Elliot, B. and et. al., 2018. Profitability and investment‐based factor pricing models. Accounting
& Finance. 58(2). pp.397-421.
Francis, B. and et. al., 2015. Gender differences in financial reporting decision making:
Evidence from accounting conservatism. Contemporary Accounting Research. 32(3).
pp.1285-1318.
Sheidu, A. D. and Yusuf, H., 2015. Bank consolidation and improvement of shareholder value:
An empirical evaluation of return on capital employed following bank mergers in
Nigeria. American International Journal of Contemporary Research. 5(5). pp.240-246.
Stent, W. and et. al., 2017. Insights into accounting choice from the adoption timing of I
nternational F inancial R eporting S tandards. Accounting & Finance. 57. pp.255-276.
Tayeh, M., Al-Jarrah, I. M. and Tarhini, A., 2015. Accounting vs. market-based measures of
firm performance related to information technology investments. International Review of
Social Sciences and Humanities, 9(1), pp.129-145.
Weygandt, J. J., Kimmel, P. D. and Kieso, D. E., 2015. Financial & managerial accounting.
John Wiley & Sons.
ONLINE
Earning Per Share. 2018. [Online]. Available through
:<https://corporatefinanceinstitute.com/resources/knowledge/finance/earnings-per-share-
eps-formula/>.

⊘ This is a preview!⊘
Do you want full access?
Subscribe today to unlock all pages.
Trusted by 1+ million students worldwide
1 out of 12