Accounting and Finance for Executives– UUAC5300
Added on 2021-05-31
15 Pages3222 Words20 Views
1
Accounting and Finance for Executives – UUAC5300
Assignment - 2
Semester 1 - 2018
Accounting and Finance for Executives – UUAC5300
Assignment - 2
Semester 1 - 2018
2
Solution 1: Evaluation of financial statements and reporting findings
Answer 1.1:
A:
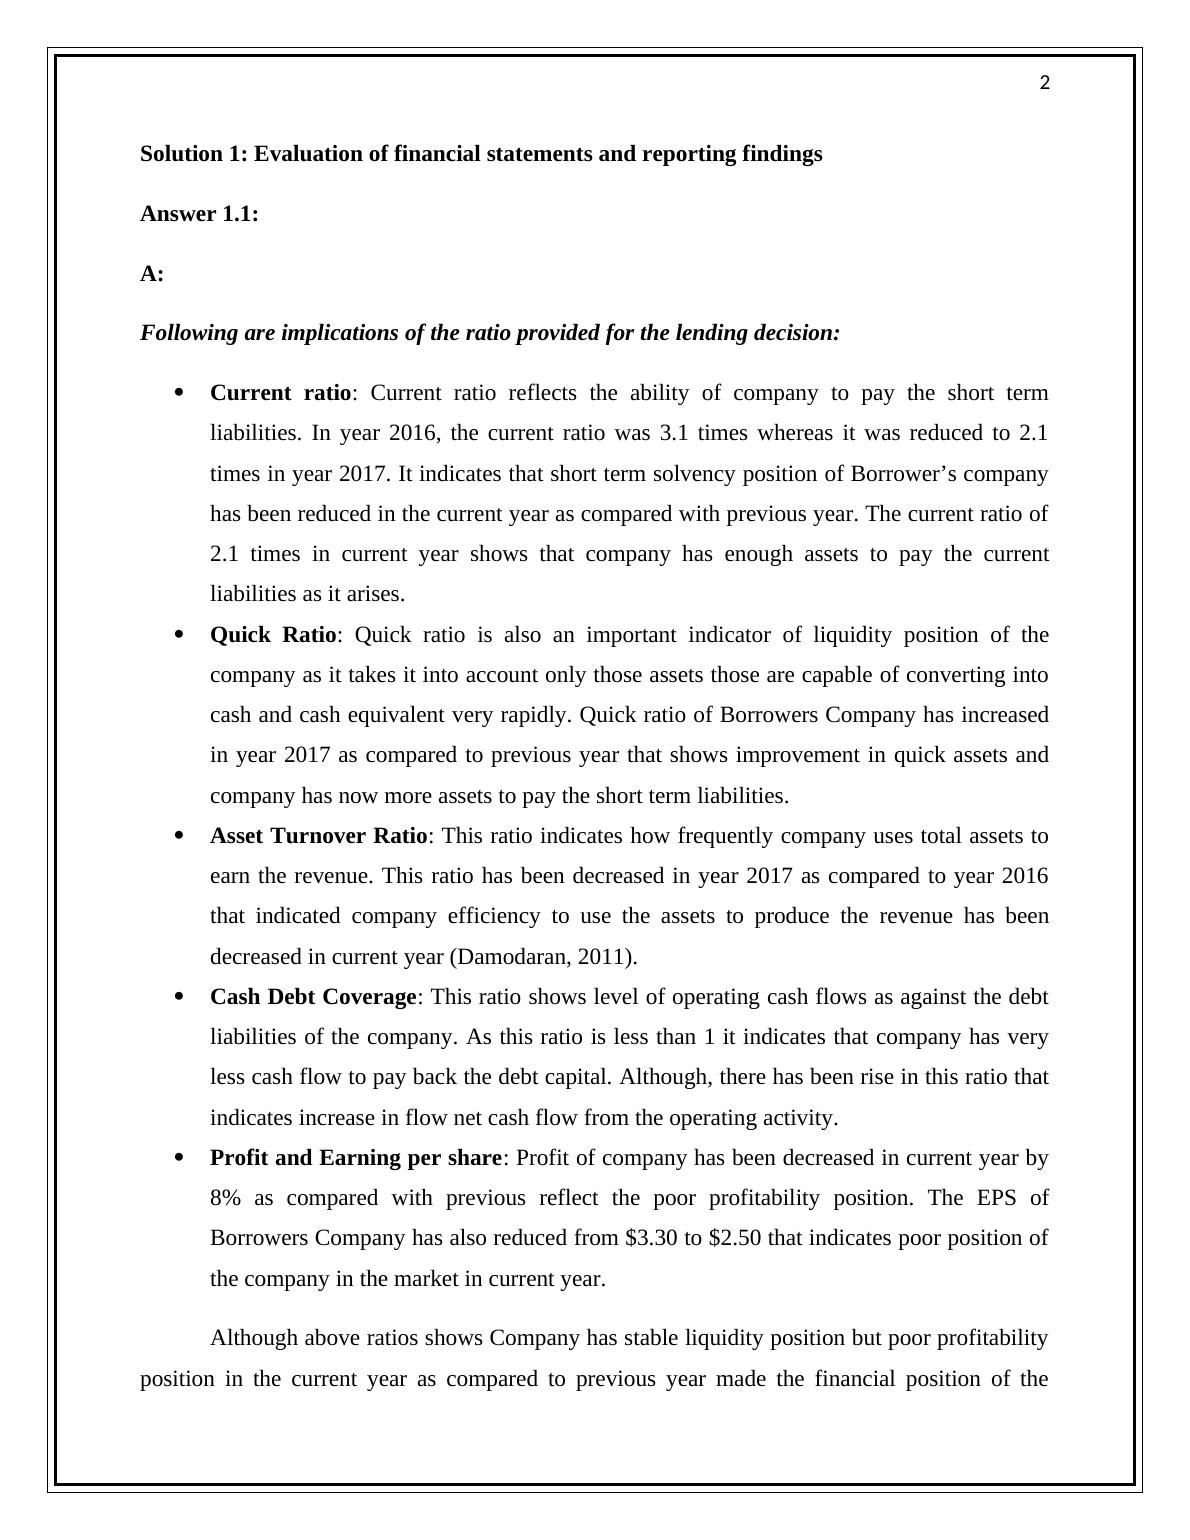
Following are implications of the ratio provided for the lending decision:
Current ratio: Current ratio reflects the ability of company to pay the short term
liabilities. In year 2016, the current ratio was 3.1 times whereas it was reduced to 2.1
times in year 2017. It indicates that short term solvency position of Borrower’s company
has been reduced in the current year as compared with previous year. The current ratio of
2.1 times in current year shows that company has enough assets to pay the current
liabilities as it arises.
Quick Ratio: Quick ratio is also an important indicator of liquidity position of the
company as it takes it into account only those assets those are capable of converting into
cash and cash equivalent very rapidly. Quick ratio of Borrowers Company has increased
in year 2017 as compared to previous year that shows improvement in quick assets and
company has now more assets to pay the short term liabilities.
Asset Turnover Ratio: This ratio indicates how frequently company uses total assets to
earn the revenue. This ratio has been decreased in year 2017 as compared to year 2016
that indicated company efficiency to use the assets to produce the revenue has been
decreased in current year (Damodaran, 2011).
Cash Debt Coverage: This ratio shows level of operating cash flows as against the debt
liabilities of the company. As this ratio is less than 1 it indicates that company has very
less cash flow to pay back the debt capital. Although, there has been rise in this ratio that
indicates increase in flow net cash flow from the operating activity.
Profit and Earning per share: Profit of company has been decreased in current year by
8% as compared with previous reflect the poor profitability position. The EPS of
Borrowers Company has also reduced from $3.30 to $2.50 that indicates poor position of
the company in the market in current year.
Although above ratios shows Company has stable liquidity position but poor profitability
position in the current year as compared to previous year made the financial position of the
Solution 1: Evaluation of financial statements and reporting findings
Answer 1.1:
A:
Following are implications of the ratio provided for the lending decision:
Current ratio: Current ratio reflects the ability of company to pay the short term
liabilities. In year 2016, the current ratio was 3.1 times whereas it was reduced to 2.1
times in year 2017. It indicates that short term solvency position of Borrower’s company
has been reduced in the current year as compared with previous year. The current ratio of
2.1 times in current year shows that company has enough assets to pay the current
liabilities as it arises.
Quick Ratio: Quick ratio is also an important indicator of liquidity position of the
company as it takes it into account only those assets those are capable of converting into
cash and cash equivalent very rapidly. Quick ratio of Borrowers Company has increased
in year 2017 as compared to previous year that shows improvement in quick assets and
company has now more assets to pay the short term liabilities.
Asset Turnover Ratio: This ratio indicates how frequently company uses total assets to
earn the revenue. This ratio has been decreased in year 2017 as compared to year 2016
that indicated company efficiency to use the assets to produce the revenue has been
decreased in current year (Damodaran, 2011).
Cash Debt Coverage: This ratio shows level of operating cash flows as against the debt
liabilities of the company. As this ratio is less than 1 it indicates that company has very
less cash flow to pay back the debt capital. Although, there has been rise in this ratio that
indicates increase in flow net cash flow from the operating activity.
Profit and Earning per share: Profit of company has been decreased in current year by
8% as compared with previous reflect the poor profitability position. The EPS of
Borrowers Company has also reduced from $3.30 to $2.50 that indicates poor position of
the company in the market in current year.
Although above ratios shows Company has stable liquidity position but poor profitability
position in the current year as compared to previous year made the financial position of the
3
company unfavorable. These ratios are not relevant for evaluating the debt worthiness of the
company.
B:
The three ratios that need to be calculated for analyzing the decision of the debt
worthiness are as follows:
Debt Equity Ratio: This ratio helps to know the level of debt against the shareholder
equity capital of the company. It will provide current level of debt and also shows
increase in debt level will change the capital structure to make it leveraged firm or not.
Interest Coverage Ratio: This ratio tells times the company can pay interest expenses on
the debt capital it is charge on the profitability of the company. This ratio will guide
whether company has enough profitability position to bear the increase in interest
expenses (Davies and Crawford, 2011).
Debt ratio: This ratio will provide information on level of debt capital used to finance
the total assets of the company.
C:
There are some drawbacks associated with the use of financial ratio analysis that limits
the application of technique in investing and credit decisions. The most significant limitation
associated with the use of ratio analysis technique is that it is not suitable to be used on a stand-
alone basis and the results obtained need to be benchmarked against some specific criteria such
as industry norm, aggregate economy and past performance. Also, it is not regarded to be a
useful technique for carrying out comparison of the financial performance of the companies that
differ on the basis of size and also belongs to different industry groups. The ratio analysis
sometimes does not provide an actual depiction of the financial performance of a company as the
financial statements are subjected to distortion by the economic and seasonal factors. In addition
to this, the use of different accounting methods and policies can provide uneven comparison of
the companies that belong to even same sectors. Also, there may be some good and some weak
financial ratios which make it difficult for investors to predict the future growth potential of the
company (Tracy, 2012).
4
Answer 1.2:
A:
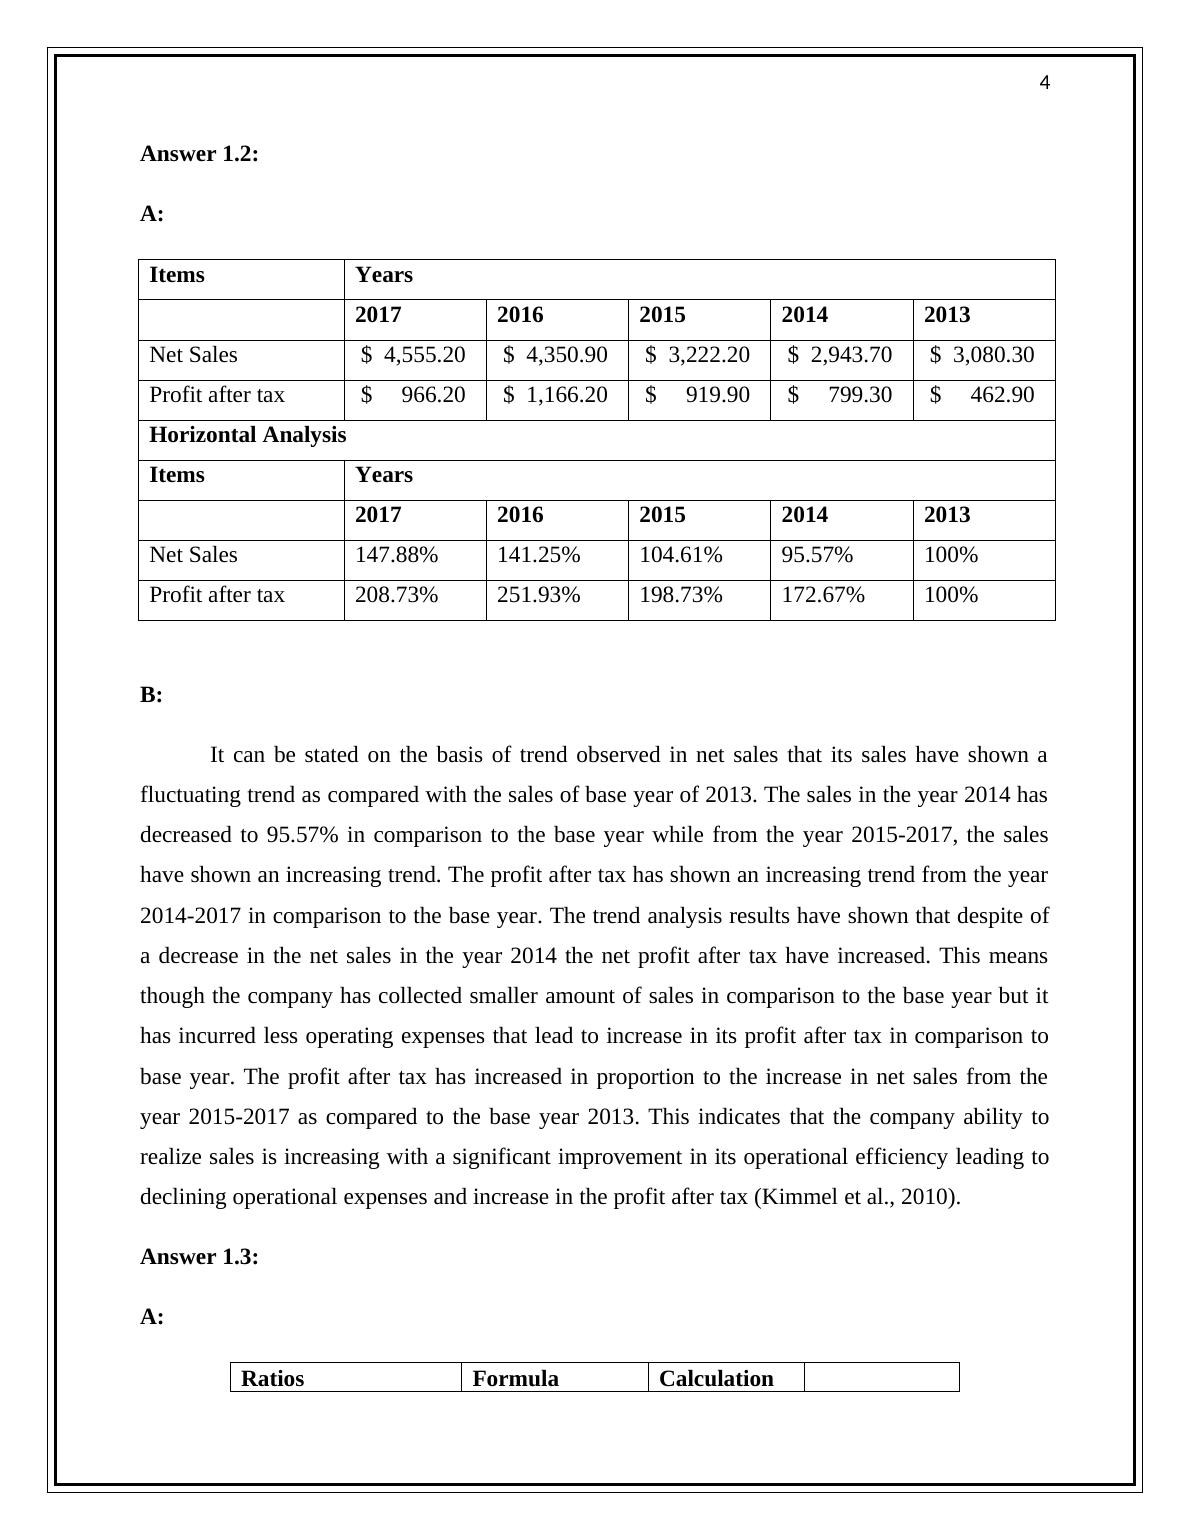
Items Years
2017 2016 2015 2014 2013
Net Sales $ 4,555.20 $ 4,350.90 $ 3,222.20 $ 2,943.70 $ 3,080.30
Profit after tax $ 966.20 $ 1,166.20 $ 919.90 $ 799.30 $ 462.90
Horizontal Analysis
Items Years
2017 2016 2015 2014 2013
Net Sales 147.88% 141.25% 104.61% 95.57% 100%
Profit after tax 208.73% 251.93% 198.73% 172.67% 100%
B:
It can be stated on the basis of trend observed in net sales that its sales have shown a
fluctuating trend as compared with the sales of base year of 2013. The sales in the year 2014 has
decreased to 95.57% in comparison to the base year while from the year 2015-2017, the sales
have shown an increasing trend. The profit after tax has shown an increasing trend from the year
2014-2017 in comparison to the base year. The trend analysis results have shown that despite of
a decrease in the net sales in the year 2014 the net profit after tax have increased. This means
though the company has collected smaller amount of sales in comparison to the base year but it
has incurred less operating expenses that lead to increase in its profit after tax in comparison to
base year. The profit after tax has increased in proportion to the increase in net sales from the
year 2015-2017 as compared to the base year 2013. This indicates that the company ability to
realize sales is increasing with a significant improvement in its operational efficiency leading to
declining operational expenses and increase in the profit after tax (Kimmel et al., 2010).
Answer 1.3:
A:
Ratios Formula Calculation
Answer 1.2:
A:
Items Years
2017 2016 2015 2014 2013
Net Sales $ 4,555.20 $ 4,350.90 $ 3,222.20 $ 2,943.70 $ 3,080.30
Profit after tax $ 966.20 $ 1,166.20 $ 919.90 $ 799.30 $ 462.90
Horizontal Analysis
Items Years
2017 2016 2015 2014 2013
Net Sales 147.88% 141.25% 104.61% 95.57% 100%
Profit after tax 208.73% 251.93% 198.73% 172.67% 100%
B:
It can be stated on the basis of trend observed in net sales that its sales have shown a
fluctuating trend as compared with the sales of base year of 2013. The sales in the year 2014 has
decreased to 95.57% in comparison to the base year while from the year 2015-2017, the sales
have shown an increasing trend. The profit after tax has shown an increasing trend from the year
2014-2017 in comparison to the base year. The trend analysis results have shown that despite of
a decrease in the net sales in the year 2014 the net profit after tax have increased. This means
though the company has collected smaller amount of sales in comparison to the base year but it
has incurred less operating expenses that lead to increase in its profit after tax in comparison to
base year. The profit after tax has increased in proportion to the increase in net sales from the
year 2015-2017 as compared to the base year 2013. This indicates that the company ability to
realize sales is increasing with a significant improvement in its operational efficiency leading to
declining operational expenses and increase in the profit after tax (Kimmel et al., 2010).
Answer 1.3:
A:
Ratios Formula Calculation
End of preview
Want to access all the pages? Upload your documents or become a member.
Related Documents
Current Ratio for the Year 2007lg...
|12
|1460
|71
Accounting And Finance For Managers in UK Discussion 2022lg...
|5
|789
|26
Financial Analysis of Reliance Worldwide PDFlg...
|25
|4658
|95
Accounting for Managers in companieslg...
|5
|1619
|106
Answer 1: Financial Statements for Managing Companieslg...
|10
|3351
|210
HI6026 - Audit, Assurance | Questions & Answerslg...
|8
|2587
|48