Comparative Financial Analysis of Wesfarmers Group 2015-2017
VerifiedAdded on 2021/05/31
|13
|2662
|27
Homework Assignment
AI Summary
This assignment analyzes the financial performance of the Wesfarmers group from 2015 to 2017, comparing key financial results and sustainability initiatives. The analysis includes a comparison of the net profit after tax, earnings per share, and return on equity, highlighting the impact of the company's conglomerate structure and investments. The report also examines key financial ratios such as net profit margin, current ratio, and debt-equity ratio to assess Wesfarmers' financial health. Furthermore, the assignment reviews the company's sustainability reports, comparing the initiatives undertaken in 2016 and 2017, with a focus on areas like safety, diversity, ethical sourcing, and climate change. The assignment also presents adjusting journal entries at June 30, 2018, and provides an income statement for Doug’s Discount Store, offering a comprehensive overview of financial accounting practices.
Accounting and Finance
1
1
Paraphrase This Document
Need a fresh take? Get an instant paraphrase of this document with our AI Paraphraser
Solution 1: Comparison of the financial results of the Wesfarmers group over the two years
The comparison of the financial results of the company can be done using financial
information published in its annual report. The annual review disclosed by the company provides
an overview of the significant improvement that has been occurred or not in its financial position
in the current year as compared to the previous year. It has been analyzed by examining the
annual report published by the company over the years 2015-2017 that it has reported an increase
in the net profit after tax (NPAT) of about $2,466 million as compared with that of the previous
year. The earnings per share has also recorded a net increase of about 21.6 per cent in
comparison to that of previous year. Also, there is increase in return on equity to 12.4 per cent of
the company in the year 2017 as compared with that of 2016. The directors of the company have
declared an increase in the fully-franked dividend to about $1.20 per share (2017 full-year
results, 2017). This indicates that the company is placing high focus on maximizing the return
for shareholders (Robinson, 2015).
It has been analyzed from the information presented in the annual report of the company
that the major reason for the growth in net profit after tax is due to its conglomerate structure.
The continued investment made by the company in improving the range of its merchandise has
resulted in delivering higher returns. This has been identified as the main reason for the increase
in the value of net profit after tax from $2,440 to $ 2,873 during the financial years 2015-2017.
The return on equity has also increased correspondingly during the financial years of 2015-2017
from 9.8% to 12.4%. This is also an increase in the operating cash flow from $861 million to
$4,226 million over the financial year 2015-2017 reflecting the improvement in its management
of inventory in all its retail divisions (Wesfarmers Limited: Annual Report, 2017). The group has
lowered its capital expenditure by 11.5 per cent in the year 2017 as compared from the previous
year. This is largely due to less number of openings of stores in its retail divisions of Bunnings
Australia and New Zealand (Wesfarmers Limited: Annual Report, 2016). The free cash flow has
also improved during the years 2015-2017 from $1,893 to $4,173 due to sales proceeds realized
from divesting the credit card receivables of its Coles unit (Kline, 2007).
The statement of financial position has been strengthened in the year 2017 as compared
with the previous year due to reduction in the net financial debt. It has been reduced to $2,216
million in the year 2017 as compared with that of $4,321 in the previous year. This is mainly due
2
to the strategy adopted by the company to diversify its funding sources and repaying the debt by
divesting the Coles credit card receivables. There is also reported a decline in the financing costs
to 14.3 per cent in the current year as compared with that of previous years driven by the active
management of debt sources (Wesfarmers Limited: Annual Report, 2017). The higher earnings
and improvement in the cash flow position of the company has resulted in causing a significant
increase in the dividend paid to the shareholders (Alexander, 2007). There is a corresponding rise
in the dividend paid from 200 cents to 223 cents during the financial years 2015-2017 that is
supported by its strong credit position in the year 2017. The individual retail division of
Wesfarmers has also reported a significant increase in the revenue position during 2015-2017.
There is increase in the revenue realized by its retail division of Coles, Bunnings, department
stores, Kmart and other significant retail divisions. However, there is reduction in the revenue
realized in its retail division of Target from $3,438 in the year 2015 to $2,950 million in the Year
2017. The significant decline in the revenue realized is because the major decision taken by the
Group for transforming the Target. This is done to reduce the operational costs for achieving its
strategic objective of everyday low prices. As such, there has been loss-making products and
reduction in the promotional activities resulting in decline of its sale and thus revenue
(Wesfarmers Limited: Annual Report, 2017).
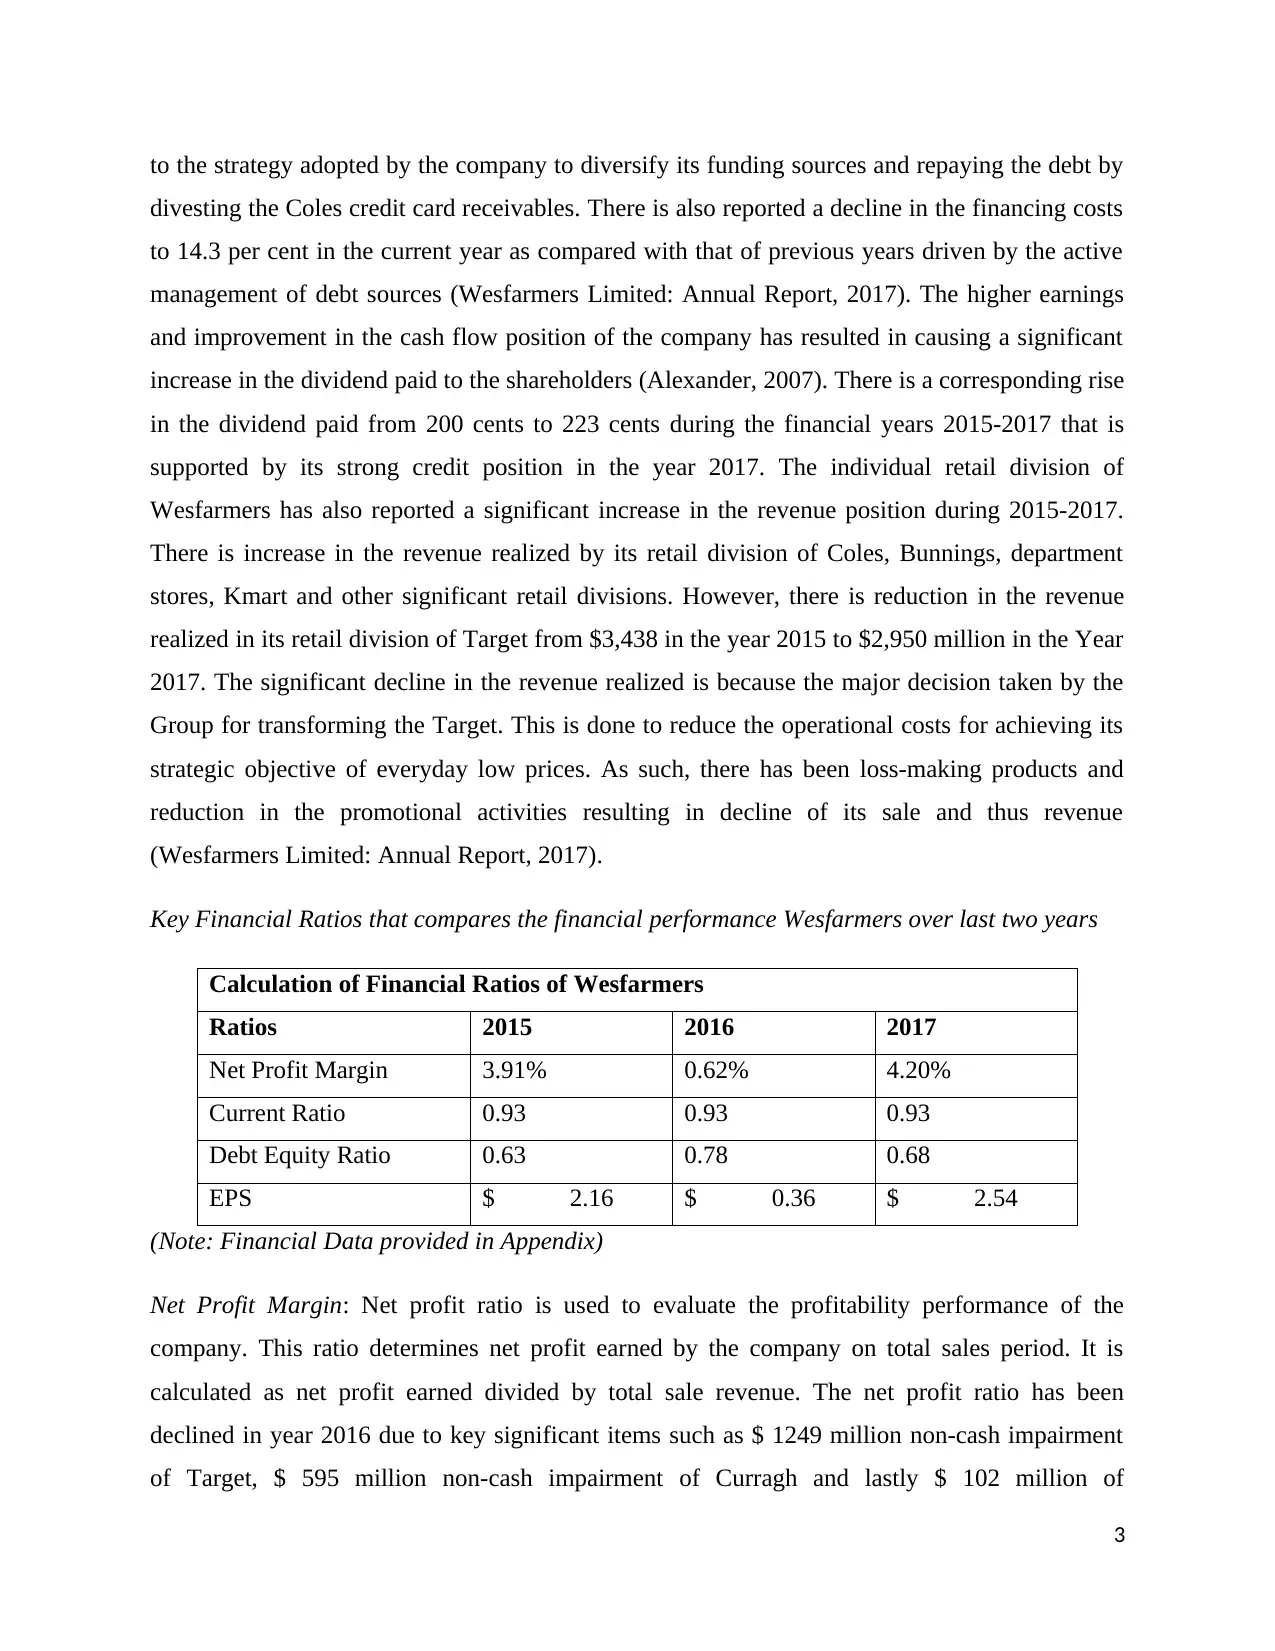
Key Financial Ratios that compares the financial performance Wesfarmers over last two years
Calculation of Financial Ratios of Wesfarmers
Ratios 2015 2016 2017
Net Profit Margin 3.91% 0.62% 4.20%
Current Ratio 0.93 0.93 0.93
Debt Equity Ratio 0.63 0.78 0.68
EPS $ 2.16 $ 0.36 $ 2.54
(Note: Financial Data provided in Appendix)
Net Profit Margin: Net profit ratio is used to evaluate the profitability performance of the
company. This ratio determines net profit earned by the company on total sales period. It is
calculated as net profit earned divided by total sale revenue. The net profit ratio has been
declined in year 2016 due to key significant items such as $ 1249 million non-cash impairment
of Target, $ 595 million non-cash impairment of Curragh and lastly $ 102 million of
3
divesting the Coles credit card receivables. There is also reported a decline in the financing costs
to 14.3 per cent in the current year as compared with that of previous years driven by the active
management of debt sources (Wesfarmers Limited: Annual Report, 2017). The higher earnings
and improvement in the cash flow position of the company has resulted in causing a significant
increase in the dividend paid to the shareholders (Alexander, 2007). There is a corresponding rise
in the dividend paid from 200 cents to 223 cents during the financial years 2015-2017 that is
supported by its strong credit position in the year 2017. The individual retail division of
Wesfarmers has also reported a significant increase in the revenue position during 2015-2017.
There is increase in the revenue realized by its retail division of Coles, Bunnings, department
stores, Kmart and other significant retail divisions. However, there is reduction in the revenue
realized in its retail division of Target from $3,438 in the year 2015 to $2,950 million in the Year
2017. The significant decline in the revenue realized is because the major decision taken by the
Group for transforming the Target. This is done to reduce the operational costs for achieving its
strategic objective of everyday low prices. As such, there has been loss-making products and
reduction in the promotional activities resulting in decline of its sale and thus revenue
(Wesfarmers Limited: Annual Report, 2017).
Key Financial Ratios that compares the financial performance Wesfarmers over last two years
Calculation of Financial Ratios of Wesfarmers
Ratios 2015 2016 2017
Net Profit Margin 3.91% 0.62% 4.20%
Current Ratio 0.93 0.93 0.93
Debt Equity Ratio 0.63 0.78 0.68
EPS $ 2.16 $ 0.36 $ 2.54
(Note: Financial Data provided in Appendix)
Net Profit Margin: Net profit ratio is used to evaluate the profitability performance of the
company. This ratio determines net profit earned by the company on total sales period. It is
calculated as net profit earned divided by total sale revenue. The net profit ratio has been
declined in year 2016 due to key significant items such as $ 1249 million non-cash impairment
of Target, $ 595 million non-cash impairment of Curragh and lastly $ 102 million of
3
⊘ This is a preview!⊘
Do you want full access?
Subscribe today to unlock all pages.
Trusted by 1+ million students worldwide
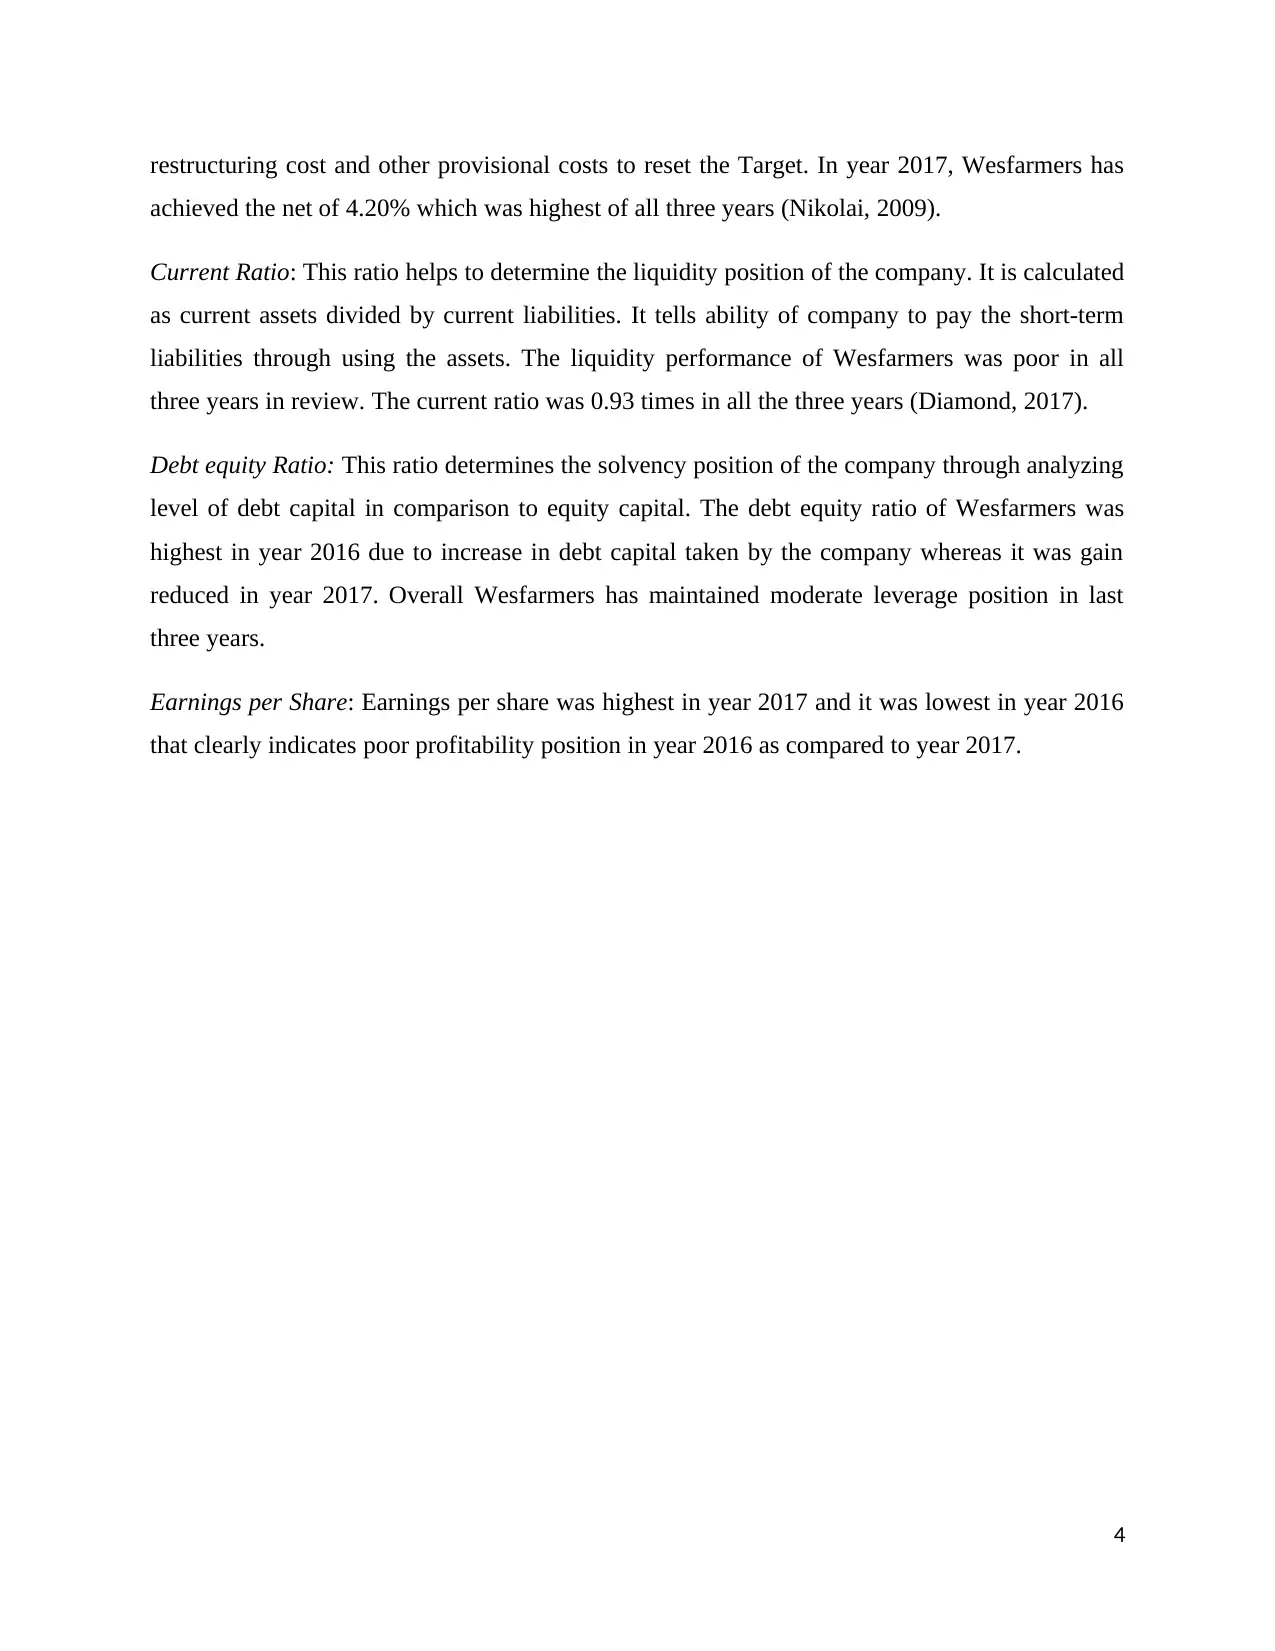
restructuring cost and other provisional costs to reset the Target. In year 2017, Wesfarmers has
achieved the net of 4.20% which was highest of all three years (Nikolai, 2009).
Current Ratio: This ratio helps to determine the liquidity position of the company. It is calculated
as current assets divided by current liabilities. It tells ability of company to pay the short-term
liabilities through using the assets. The liquidity performance of Wesfarmers was poor in all
three years in review. The current ratio was 0.93 times in all the three years (Diamond, 2017).
Debt equity Ratio: This ratio determines the solvency position of the company through analyzing
level of debt capital in comparison to equity capital. The debt equity ratio of Wesfarmers was
highest in year 2016 due to increase in debt capital taken by the company whereas it was gain
reduced in year 2017. Overall Wesfarmers has maintained moderate leverage position in last
three years.
Earnings per Share: Earnings per share was highest in year 2017 and it was lowest in year 2016
that clearly indicates poor profitability position in year 2016 as compared to year 2017.
4
Paraphrase This Document
Need a fresh take? Get an instant paraphrase of this document with our AI Paraphraser
Solution 2: Comparison of the sustainability initiatives of Wesfarmers for the year 2016 &
2017
The business entities worldwide are placing increasing importance on development of
sustainable reports for reflecting the initiatives taken by them to promote social, economic and
environmental development. Wesfarmers is also engaged in development of sustainability
reports for promoting transparency and authenticity in its business operations and ensuring that
all the business activities are carried out as per the ethical principles and rules. It has been found
out from the overall analysis of the sustainability report of the company that it is highly
committed to promote the welfare of society and environment by maintaining a safe workplace.
It has disclosed adequate information in its sustainability report about the strategies adopted in its
various business operations such as people, sourcing, community, environment and governance
for promoting the societal and environmental development (Wesfarmers Limited: Sustainability
Report 2017, 2017).
The comparison of the company’s sustainability report has indicated that it has enhanced
the amount of information disclosed in context of its sustainability issues in the year 2017 as
compared with that of 2016. For example, the company in its sustainability report for the year
2017 has added the information regarding its materiality issues in its approach that is not
mentioned in the report of the year 2016 (Wesfarmers Limited: Sustainability Report 2016,
2016). The materiality issues at the starting of the sustainability report reflects the major social
and environmental impacts of its operations that can have a large impact on the decision-making
process of its stakeholders (Wesfarmers Limited: Sustainability Report 2017, 2017).
This section of the sustainability report has summarized the key improvements achieved
by the company in its key sustainability areas such as safety, diversity, ethical sourcing and
climate change. Thus, it will facilitate the stakeholders to gain a glimpse of the overall
sustainability issues in brief and results in better understanding of them. The people section of
the sustainability report of the company has also included a leadership model. The model is
developed for providing an explanation to the approach adopted by the company for promoting
the developments of a leader. The approach consists of the use of individual development
investments, 360 assessments, development planning, external coaching and mentoring for
fostering the process of collective learning. Also, in the sourcing section of the report for the
5
year 2017, the company has included a human rights and modern slavery statements for
reflecting its policies in opposition to slavery. The policies and governing framework adopted for
opposing slavery and protecting the human rights has been disclosed in detail in the report. Also,
the risk assessment and mitigation procedure followed for addressing the issues related with
slavery and its impact on business relationships has been included in the community section
(Wesfarmers Limited: Sustainability Report 2017, 2017).
The contribution of the company in promoting community development has been
explained in more detail in the sustainability report of the year 2017. This includes graphical
representation of the amount contributed by the company to the community. The company also
discussed the contribution made by it for promoting the health and medical researches and to the
indigenous programs. The climate section of the report has included the information about the
climate change strategy and governance policy adopted by it for managing the significant risks
associated due to climatic change. It has also included a climate change risk management section
for detailing the type of climate risks faced by the company and the strategies adopted for
reducing it. It has also taken initiatives in the year 2017 for helping its customers to recycle the
waste materials. In addition to this, the significant commitments made by its retailers to reduce
the generation of waste materials by the adoption of a packaging strategy that minimize waste
generation ahs also been discussed in this report. Also, the company has taken sustainability
initiatives in the year 2017 across all its business divisions such as Coles, Kmart and others for
providing enhanced information in relation to their sustainability performance. The governance
section also included additional information about the role and responsibilities of various
committees established by the Board. This includes disclosing the roles and responsibilities of
the audit and risk committee in addition with analyzing the roles of Board and management
(Wesfarmers Limited: Sustainability Report 2017, 2017).
Thus, it can be said from the comparison of the sustainability report of the company over
two significant years that the company ahs taken various sustainability initiative in the year
2017. As per my views, these initiatives are adopted by the company to seek more trust and
confidence from its stakeholders and improving the transparency in its business operations. The
company is aiming to become a recognized retail bard within Australia that has attained
6
⊘ This is a preview!⊘
Do you want full access?
Subscribe today to unlock all pages.
Trusted by 1+ million students worldwide
competency in its sustainability performance by placing it as a priority across its operational
segments (Schaltegger, 2006).
7
segments (Schaltegger, 2006).
7
Paraphrase This Document
Need a fresh take? Get an instant paraphrase of this document with our AI Paraphraser
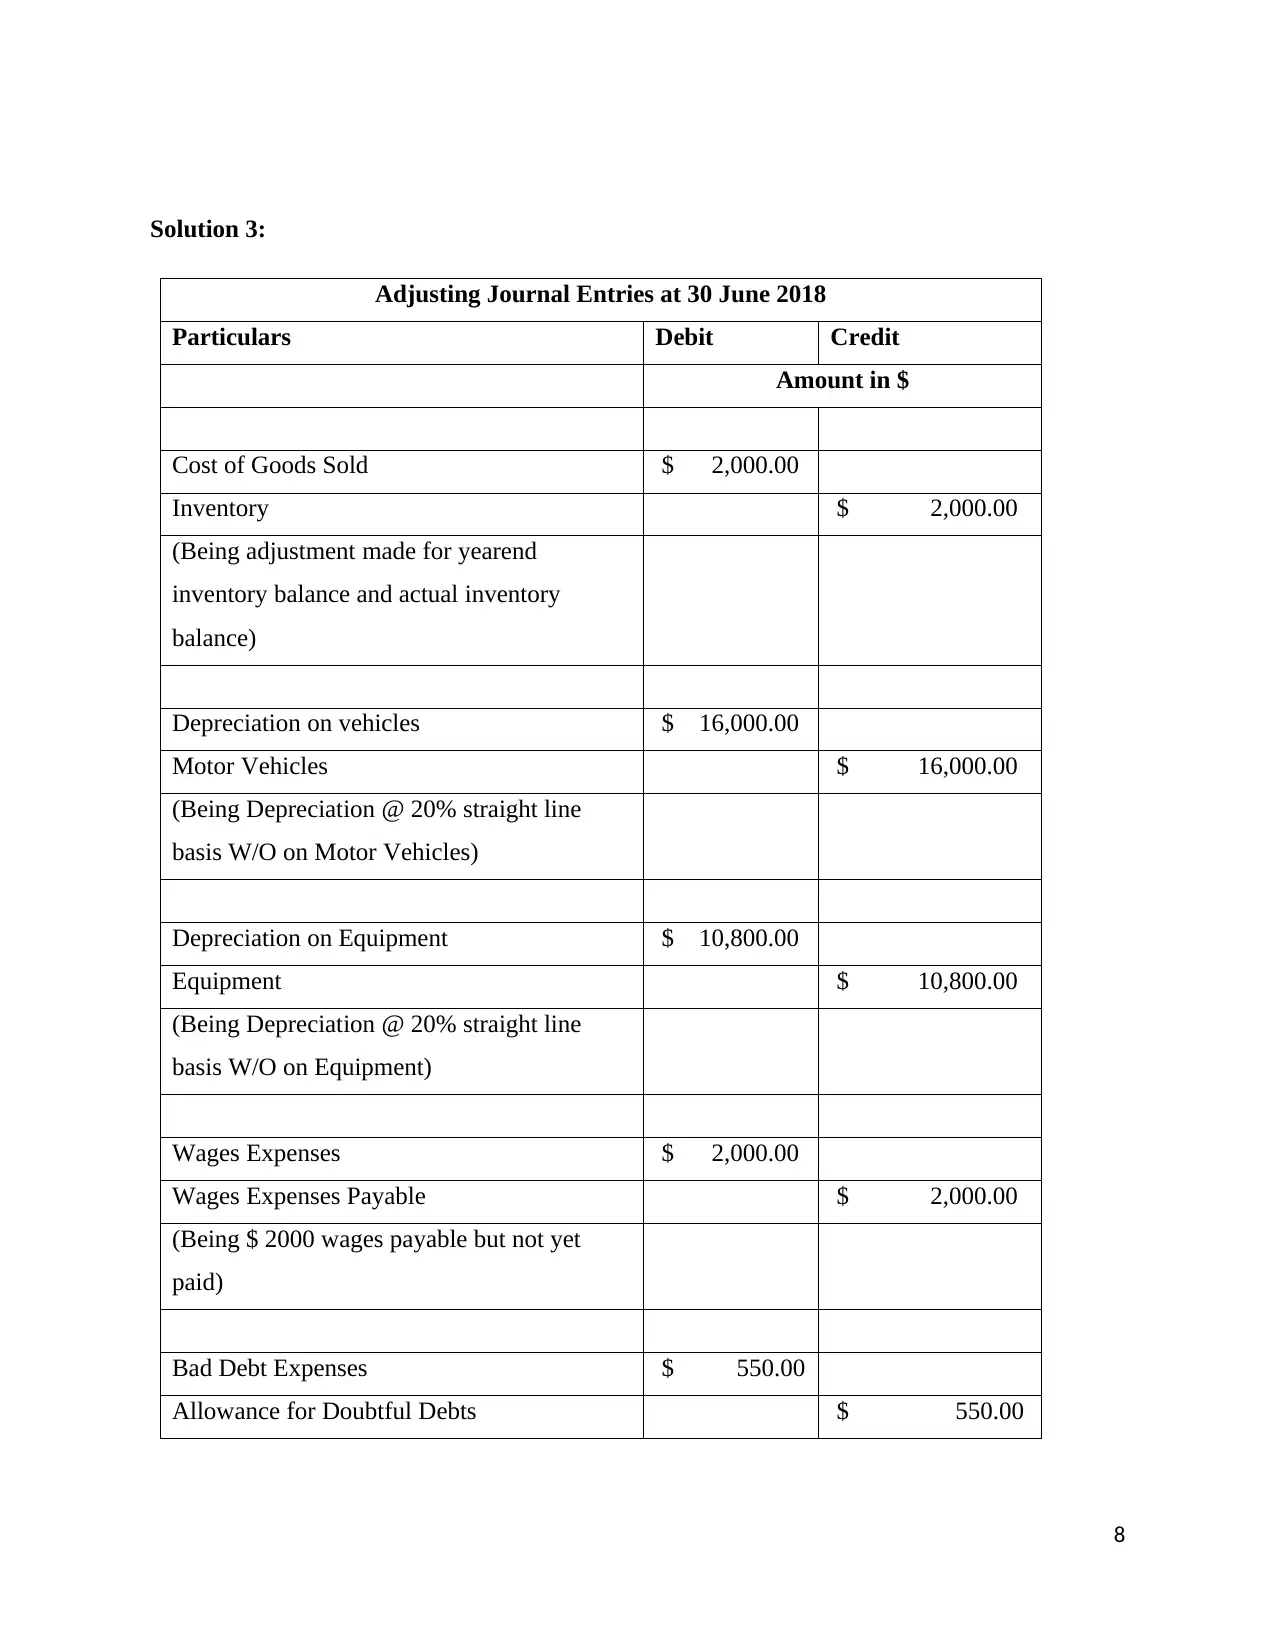
Solution 3:
Adjusting Journal Entries at 30 June 2018
Particulars Debit Credit
Amount in $
Cost of Goods Sold $ 2,000.00
Inventory $ 2,000.00
(Being adjustment made for yearend
inventory balance and actual inventory
balance)
Depreciation on vehicles $ 16,000.00
Motor Vehicles $ 16,000.00
(Being Depreciation @ 20% straight line
basis W/O on Motor Vehicles)
Depreciation on Equipment $ 10,800.00
Equipment $ 10,800.00
(Being Depreciation @ 20% straight line
basis W/O on Equipment)
Wages Expenses $ 2,000.00
Wages Expenses Payable $ 2,000.00
(Being $ 2000 wages payable but not yet
paid)
Bad Debt Expenses $ 550.00
Allowance for Doubtful Debts $ 550.00
8
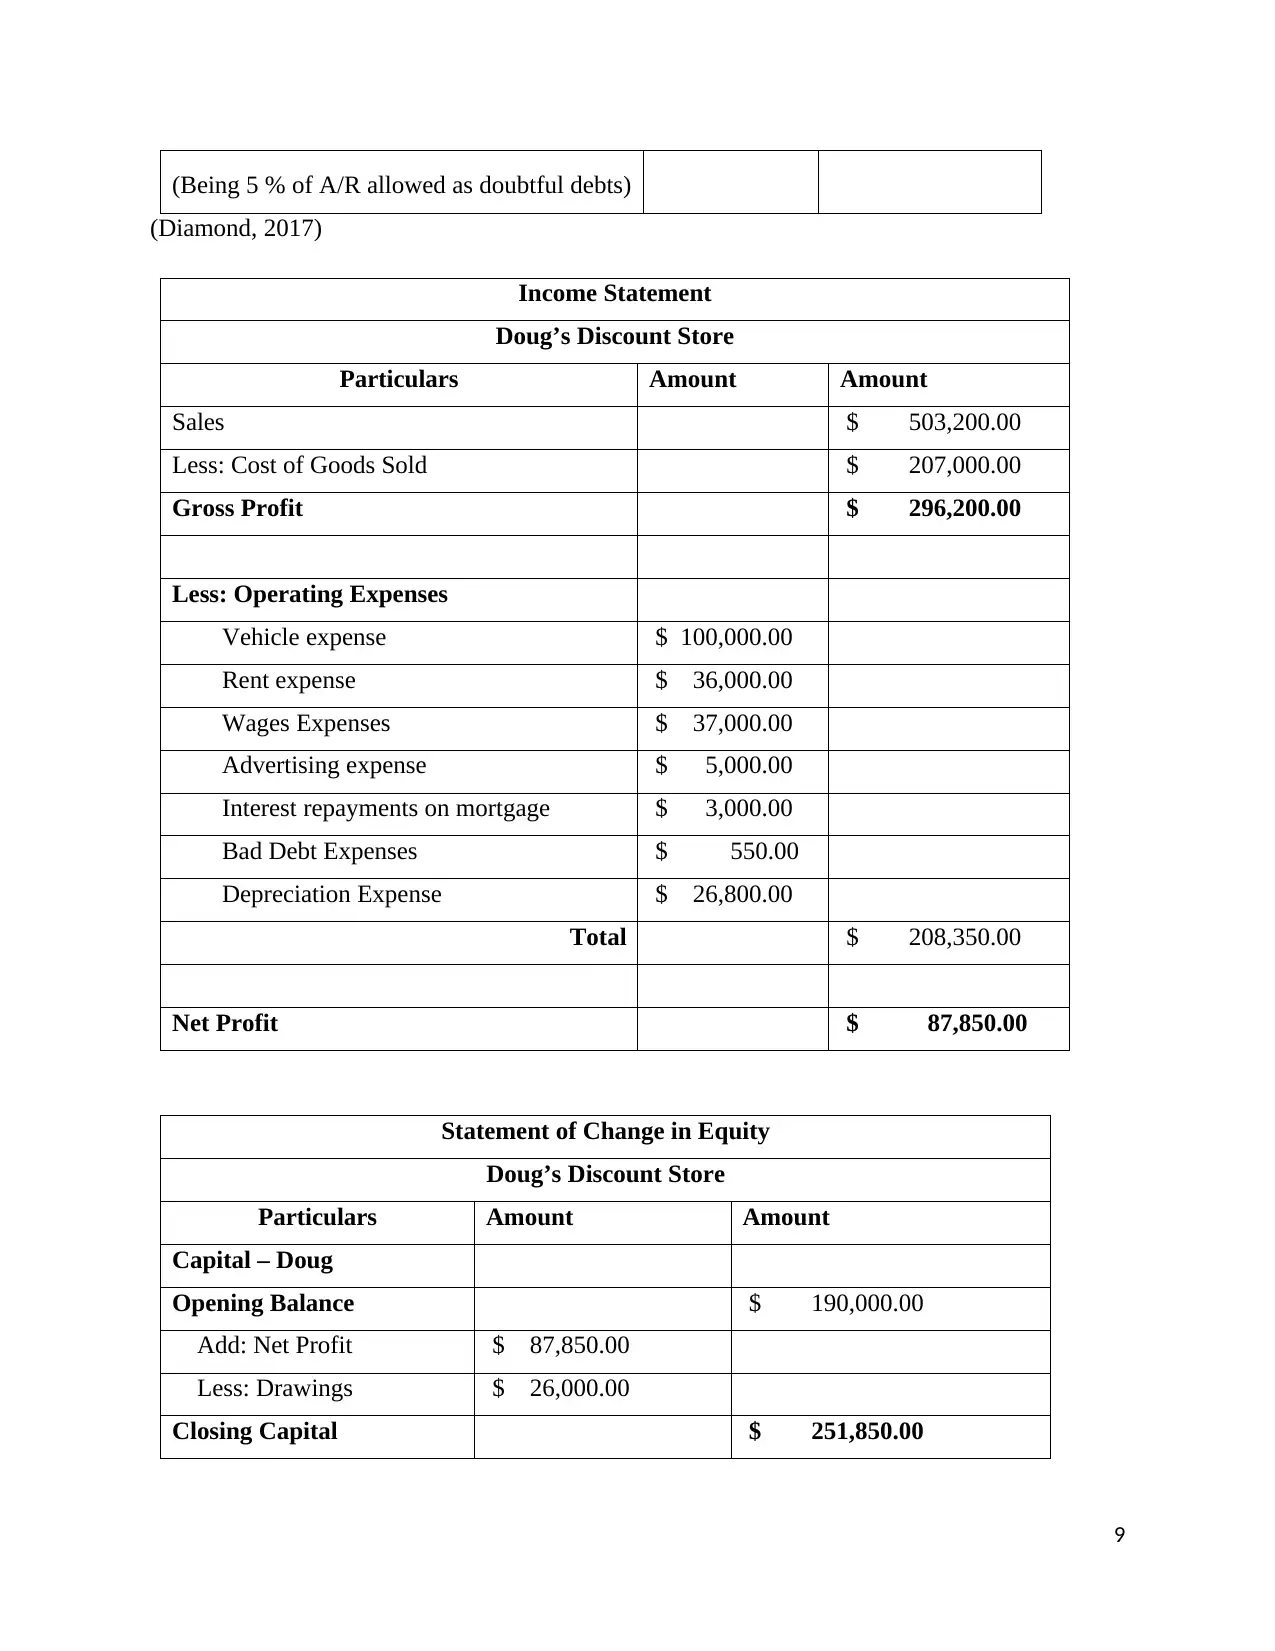
(Being 5 % of A/R allowed as doubtful debts)
(Diamond, 2017)
Income Statement
Doug’s Discount Store
Particulars Amount Amount
Sales $ 503,200.00
Less: Cost of Goods Sold $ 207,000.00
Gross Profit $ 296,200.00
Less: Operating Expenses
Vehicle expense $ 100,000.00
Rent expense $ 36,000.00
Wages Expenses $ 37,000.00
Advertising expense $ 5,000.00
Interest repayments on mortgage $ 3,000.00
Bad Debt Expenses $ 550.00
Depreciation Expense $ 26,800.00
Total $ 208,350.00
Net Profit $ 87,850.00
Statement of Change in Equity
Doug’s Discount Store
Particulars Amount Amount
Capital – Doug
Opening Balance $ 190,000.00
Add: Net Profit $ 87,850.00
Less: Drawings $ 26,000.00
Closing Capital $ 251,850.00
9
⊘ This is a preview!⊘
Do you want full access?
Subscribe today to unlock all pages.
Trusted by 1+ million students worldwide
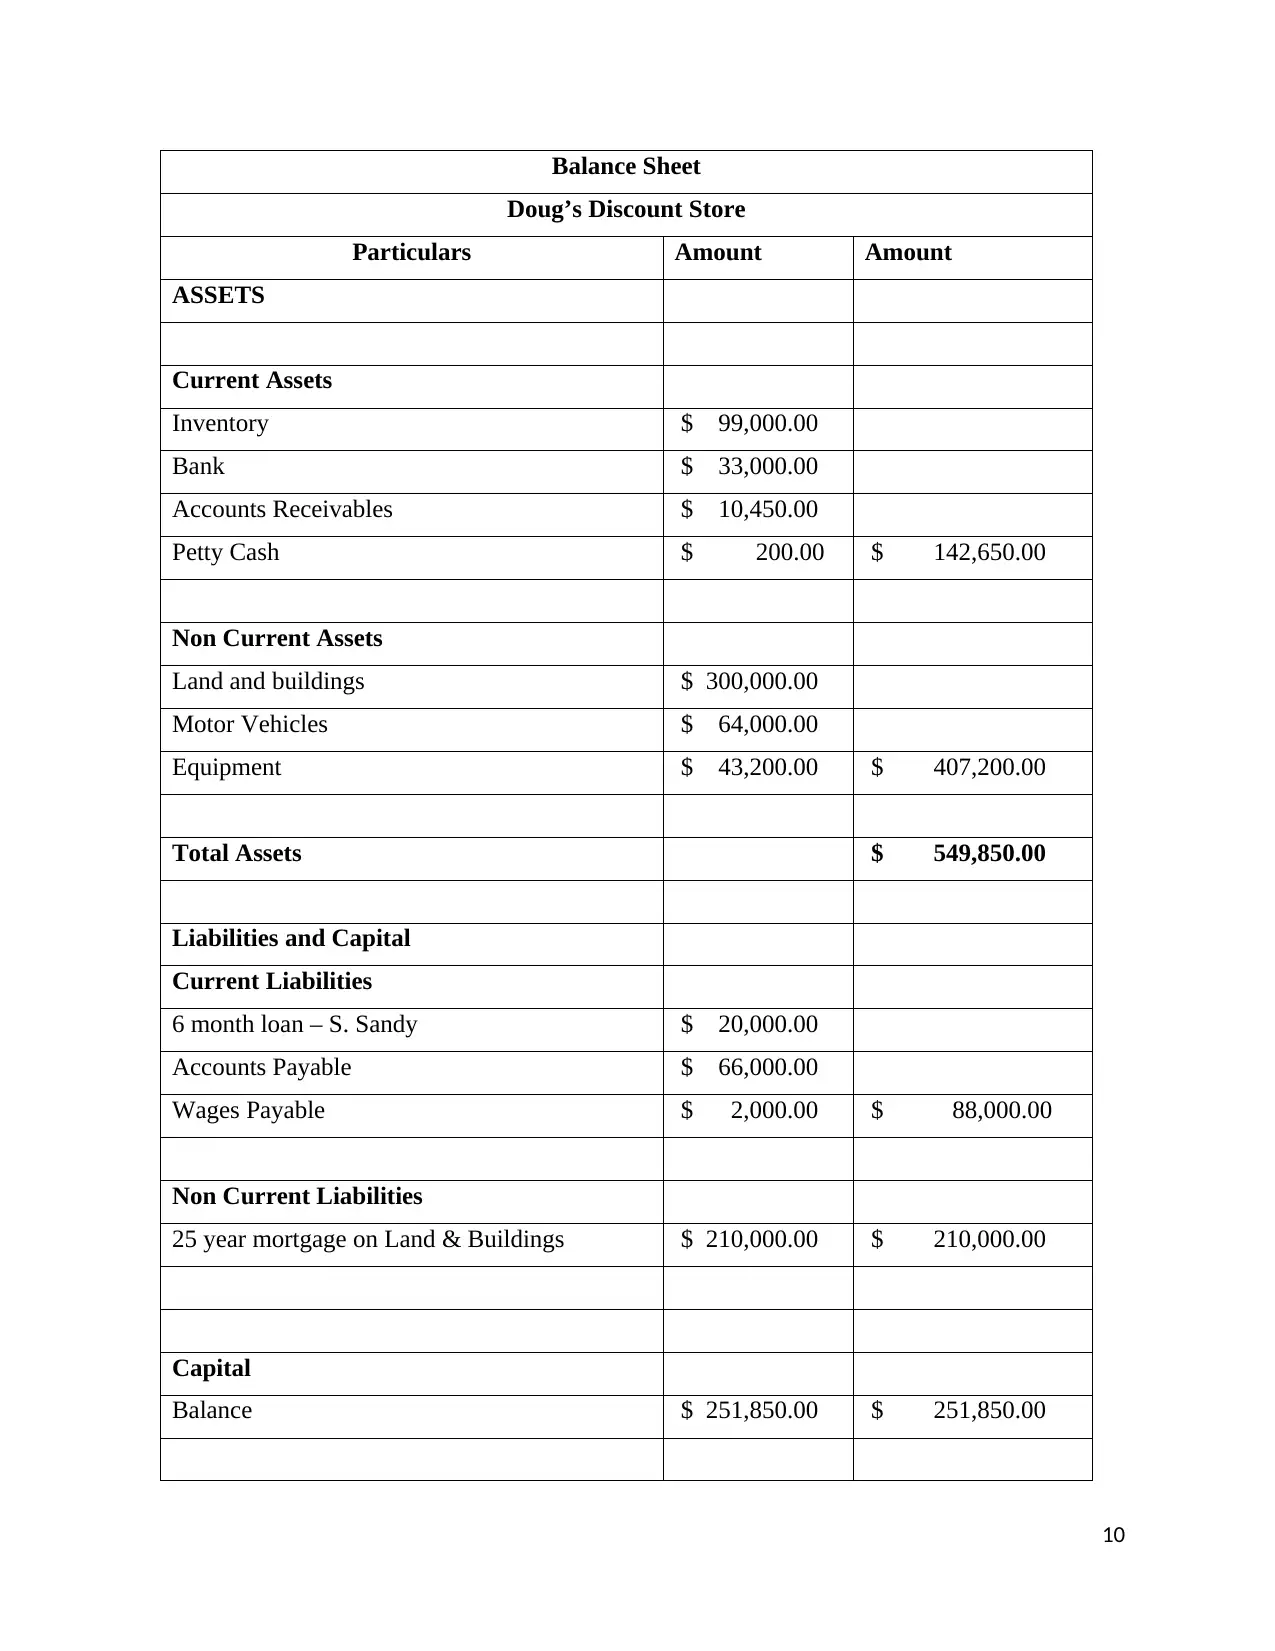
Balance Sheet
Doug’s Discount Store
Particulars Amount Amount
ASSETS
Current Assets
Inventory $ 99,000.00
Bank $ 33,000.00
Accounts Receivables $ 10,450.00
Petty Cash $ 200.00 $ 142,650.00
Non Current Assets
Land and buildings $ 300,000.00
Motor Vehicles $ 64,000.00
Equipment $ 43,200.00 $ 407,200.00
Total Assets $ 549,850.00
Liabilities and Capital
Current Liabilities
6 month loan – S. Sandy $ 20,000.00
Accounts Payable $ 66,000.00
Wages Payable $ 2,000.00 $ 88,000.00
Non Current Liabilities
25 year mortgage on Land & Buildings $ 210,000.00 $ 210,000.00
Capital
Balance $ 251,850.00 $ 251,850.00
10
Paraphrase This Document
Need a fresh take? Get an instant paraphrase of this document with our AI Paraphraser
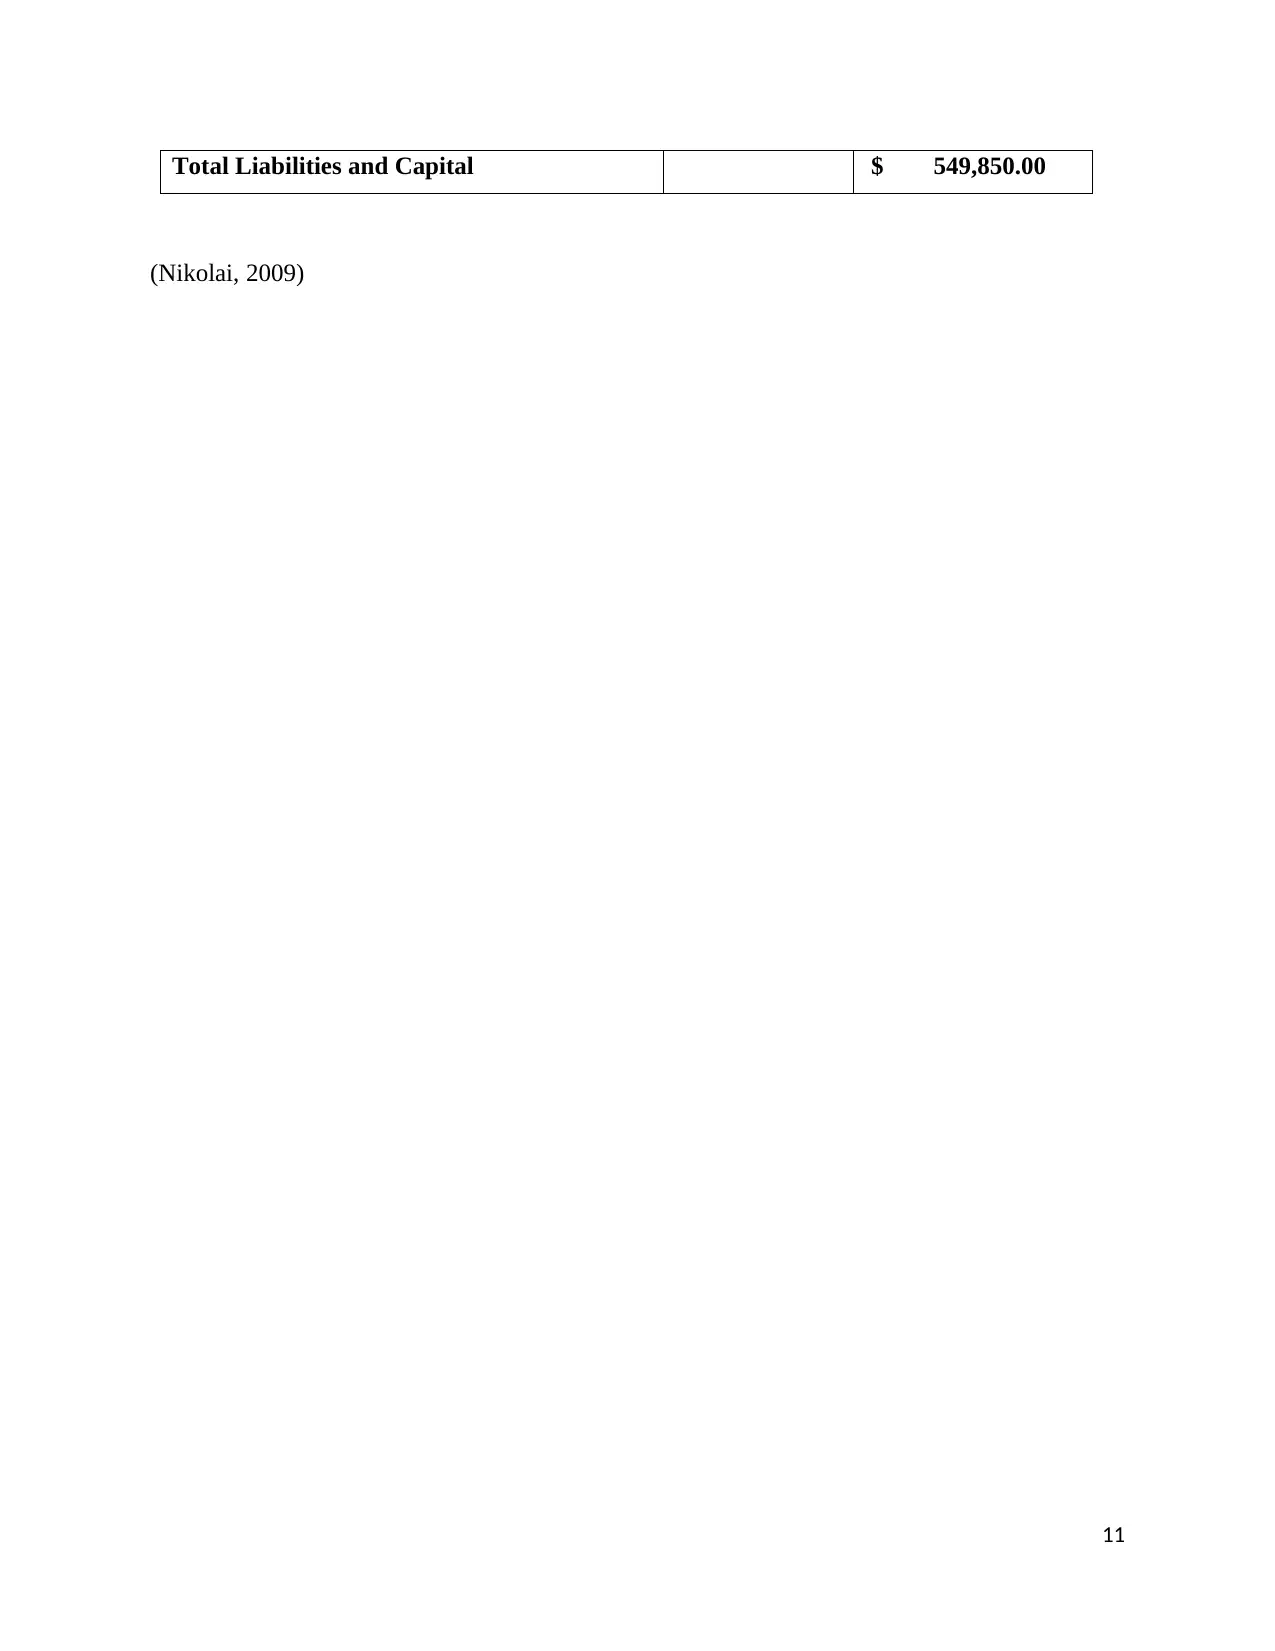
Total Liabilities and Capital $ 549,850.00
(Nikolai, 2009)
11
(Nikolai, 2009)
11
References
2017 full-year results. (2017). Retrieved 18 September, 2018, from
http://www.wesfarmers.com.au/util/news-media/article/2017/08/17/2017-full-year-results
Alexander, D. (2007). International Financial Reporting and Analysis. Cengage Learning
EMEA.
Diamond, S. (2017). Finnancial Accounting and Its Environtment: Financial Accounting.
Bukupedia.
Kline, B. (2007). How to Read and Understand Financial Statements when You Don't Know
what You are Looking at. Atlantic Publishing Company.
Nikolai, A. (2009). Intermediate Accounting (Book Only). Cengage Learning.
Robinson, T. (2015). International Financial Statement Analysis. John Wiley & Sons.
Schaltegger, S. (2006). Sustainability Accounting and Reporting. Springer Science & Business
Media.
Wesfarmers Limited: Annual Report. (2016). Retrieved 18 September, 2018, from
https://www.wesfarmers.com.au/docs/default-source/reports/2016-annual-report.pdf?
sfvrsn=4
Wesfarmers Limited: Annual Report. (2017). Retrieved 18 September, 2018, from
https://www.wesfarmers.com.au/docs/default-source/default-document-library/2017-
annual-report.pdf?sfvrsn=0
Wesfarmers Limited: Sustainability Report 2016. (2016). Retrieved 18 September, 2018, from
https://sustainability.wesfarmers.com.au/media/1835/edited-extract-of-wesfarmers-2016-
sustainability-report.pdf
Wesfarmers Limited: Sustainability Report 2017. (2017). Retrieved 18 September, 2018, from
https://sustainability.wesfarmers.com.au/media/2464/2017-wesfarmers-sustainability-
full-report.pdf
12
⊘ This is a preview!⊘
Do you want full access?
Subscribe today to unlock all pages.
Trusted by 1+ million students worldwide
1 out of 13
Related Documents


Your All-in-One AI-Powered Toolkit for Academic Success.
+13062052269
info@desklib.com
Available 24*7 on WhatsApp / Email
![[object Object]](/_next/static/media/star-bottom.7253800d.svg)
Unlock your academic potential
Copyright © 2020–2026 A2Z Services. All Rights Reserved. Developed and managed by ZUCOL.