Financial Performance Analysis Report for Bitmap plc (PGBM12, 2019)
VerifiedAdded on 2023/01/18
|26
|6897
|44
Report
AI Summary
This report presents a comprehensive financial analysis of Bitmap plc, a London-based furniture manufacturer. Part A focuses on ratio analysis, including profitability, liquidity, gearing, asset utilization, and investor potential ratios, comparing 2016 and 2017 data. It also examines the company's working capital cycle. Part B delves into investment appraisal techniques, such as payback period, along with the benefits, limitations, and sources of finance. Part C defines budgeting, its link to the business, and the budgeting process. The report aims to provide the directors of Bitmap plc with a clear understanding of the company's financial position and performance, offering recommendations for improvement.

Running Head: Accounting and Financial Management
1
Project Report: Accounting and Financial Management
1
Project Report: Accounting and Financial Management
Paraphrase This Document
Need a fresh take? Get an instant paraphrase of this document with our AI Paraphraser
Accounting and Financial Management 2
Contents
Part A................................................................................................................................3
Introduction...................................................................................................................3
Case overview...............................................................................................................3
Ratio analysis................................................................................................................3
Working capital cycle...................................................................................................6
Conclusion and recommendation.................................................................................6
Part B................................................................................................................................7
Introduction...................................................................................................................7
Investment appraisal technique.....................................................................................7
Key benefits and limitations of investment appraisal techniques.................................9
Suitable source of finance...........................................................................................11
Part C..............................................................................................................................12
Budget definition and its link to business...................................................................12
Budgeting process.......................................................................................................13
References.......................................................................................................................14
Appendix.........................................................................................................................16
Accounting and Financial Management 3
Part A:
Introduction:
The report has been prepared for the directors of Bitmap plc in order to present them
about the financial position and performance of the company. In order to depict about the
financial performance of the company, ratio analysis study has been presented on the
company. Further, the working capital cycle of the company has also been prepared to
measure the operational and efficiency performance of the company.
Case overview:
Bitmap plc is a London based company which manufactures furniture. Board of
directors of the company are interested to know the significant changes in the company in
current year from the last year. In order to measure the changes and its impact on the
financial performance of the company, various financial ratios have been calculated. The
study of ratio analysis is as follows:
Ratio analysis:
Ratio analysis is one of the most used financial analysis types. It is used by the
companies, investors and the financial analyst to obtain quick information and indication
about the financial position and financial performance of the company at various key places.
Ratios are basically categorized as liquidity ratio, profitability ratio, gearing ratio, investor
potential ratio and asset utilization ratio (Kaplan and Atkinson, 2015). The study over these
ratios has been performed to measure the financial changes in the business and the
performance of the company.
Profitability ratio:
Profitability ratios are one of the financial analysis methods which are used by the
investors, stakeholders and the organizations to identify the ability of the business to generate
the earnings against the revenues, cost of goods sold, operating cost, shareholder’s equity and
total assets of the business (Romney, Steinbart, Zhang and Xu, 2016). In this report, return on
capital employed and met profit margin of the company has been evaluated to measure the
financial performance of the company.
Return on capital employed measure the profitability position of the company on the
basis of total capital available. In case of Bitmap plc, it has been found that return on capital
⊘ This is a preview!⊘
Do you want full access?
Subscribe today to unlock all pages.
Trusted by 1+ million students worldwide
Accounting and Financial Management 4
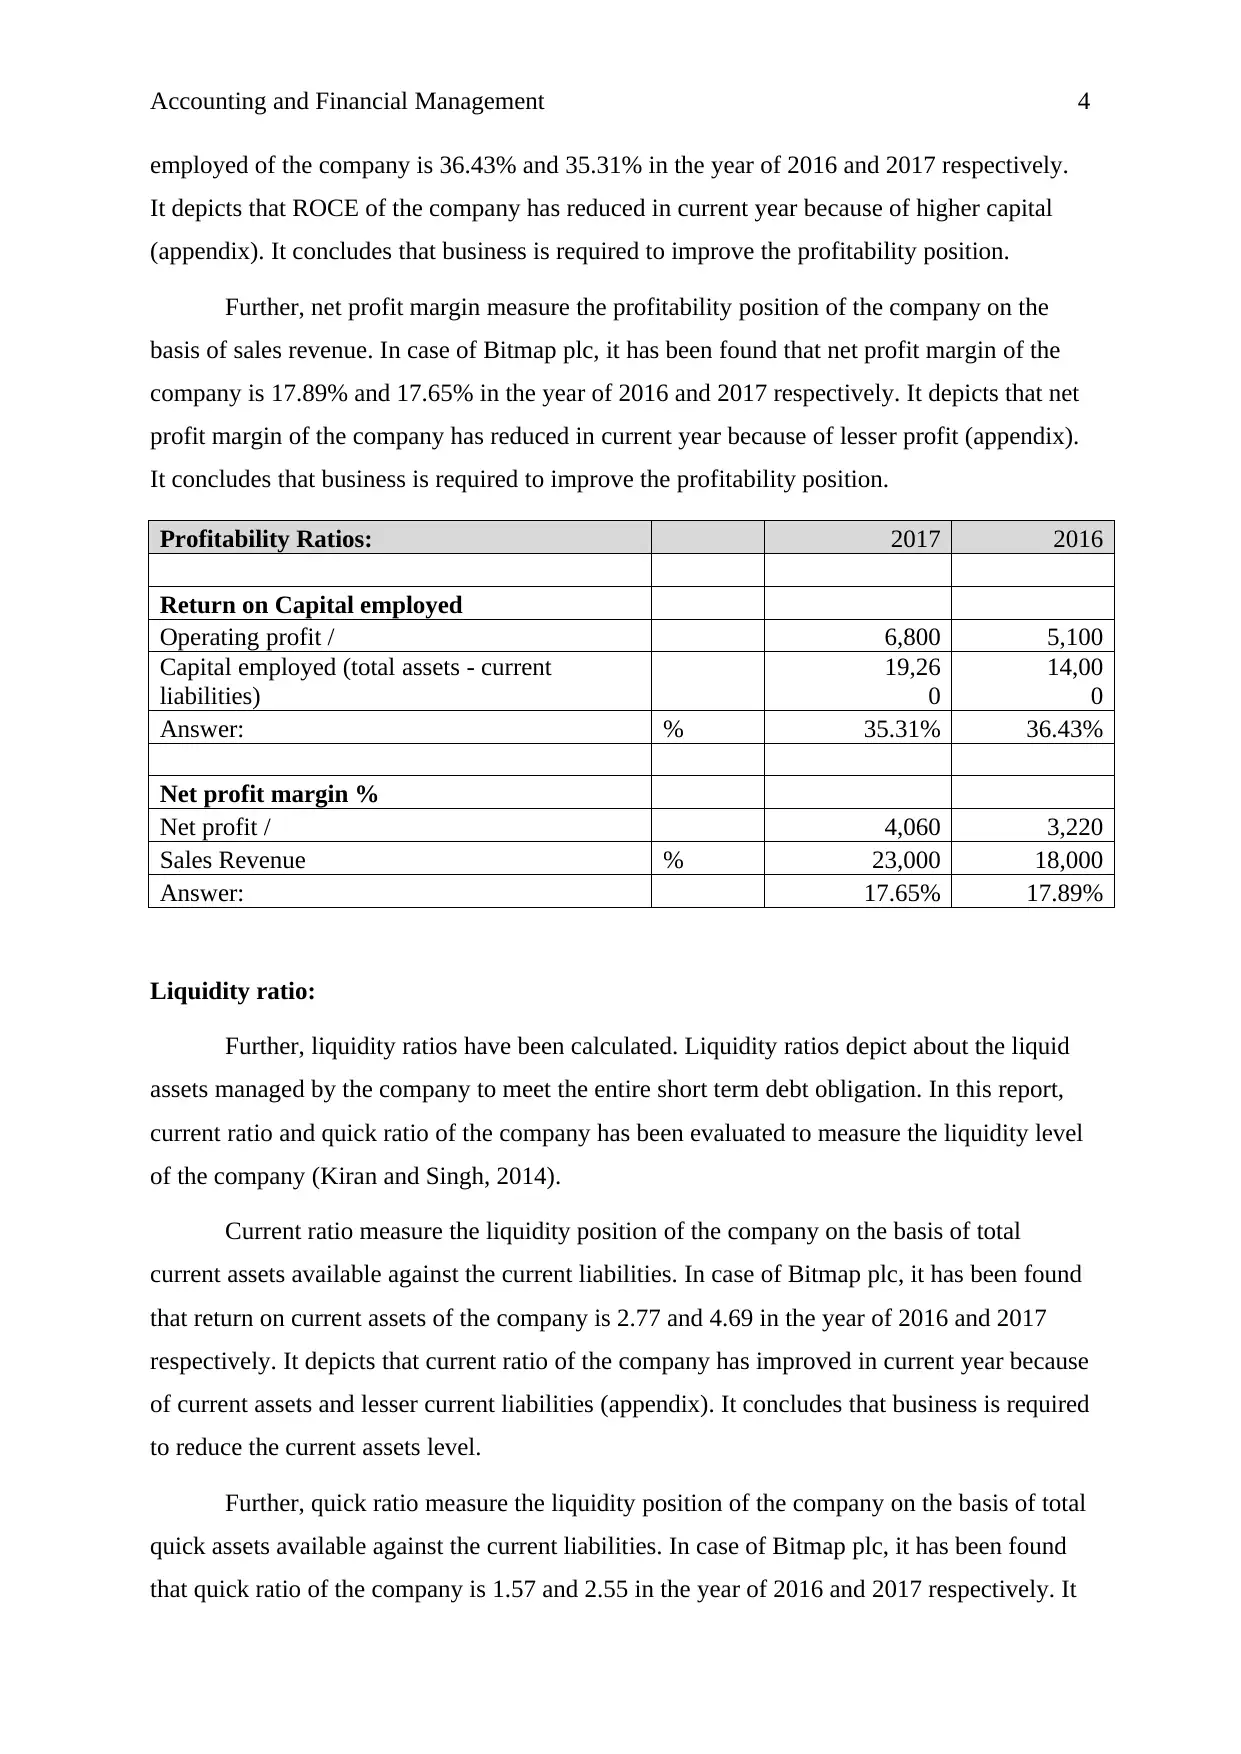
employed of the company is 36.43% and 35.31% in the year of 2016 and 2017 respectively.
It depicts that ROCE of the company has reduced in current year because of higher capital
(appendix). It concludes that business is required to improve the profitability position.
Further, net profit margin measure the profitability position of the company on the
basis of sales revenue. In case of Bitmap plc, it has been found that net profit margin of the
company is 17.89% and 17.65% in the year of 2016 and 2017 respectively. It depicts that net
profit margin of the company has reduced in current year because of lesser profit (appendix).
It concludes that business is required to improve the profitability position.
Profitability Ratios: 2017 2016
Return on Capital employed
Operating profit / 6,800 5,100
Capital employed (total assets - current
liabilities)
19,26
0
14,00
0
Answer: % 35.31% 36.43%
Net profit margin %
Net profit / 4,060 3,220
Sales Revenue % 23,000 18,000
Answer: 17.65% 17.89%
Liquidity ratio:
Further, liquidity ratios have been calculated. Liquidity ratios depict about the liquid
assets managed by the company to meet the entire short term debt obligation. In this report,
current ratio and quick ratio of the company has been evaluated to measure the liquidity level
of the company (Kiran and Singh, 2014).
Current ratio measure the liquidity position of the company on the basis of total
current assets available against the current liabilities. In case of Bitmap plc, it has been found
that return on current assets of the company is 2.77 and 4.69 in the year of 2016 and 2017
respectively. It depicts that current ratio of the company has improved in current year because
of current assets and lesser current liabilities (appendix). It concludes that business is required
to reduce the current assets level.
Further, quick ratio measure the liquidity position of the company on the basis of total
quick assets available against the current liabilities. In case of Bitmap plc, it has been found
that quick ratio of the company is 1.57 and 2.55 in the year of 2016 and 2017 respectively. It
Paraphrase This Document
Need a fresh take? Get an instant paraphrase of this document with our AI Paraphraser
Accounting and Financial Management 5
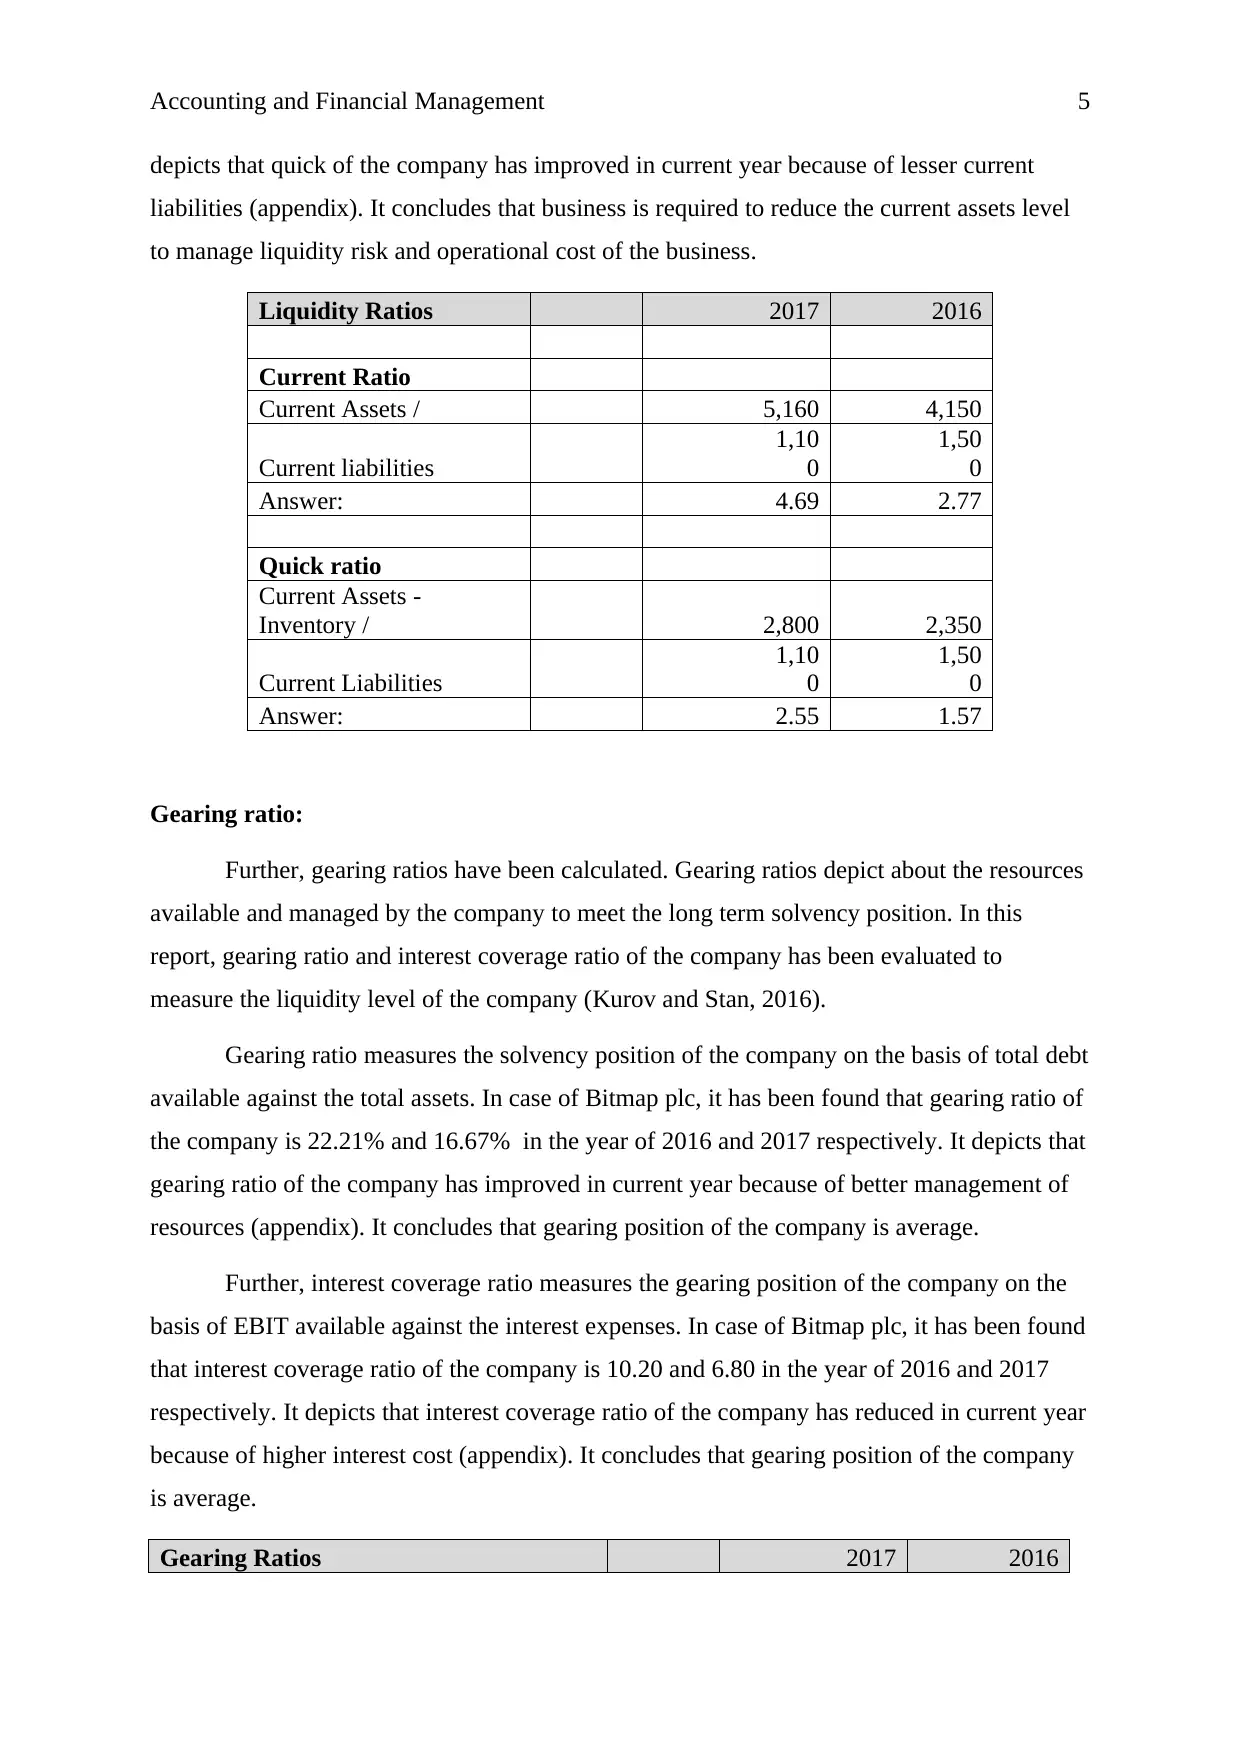
depicts that quick of the company has improved in current year because of lesser current
liabilities (appendix). It concludes that business is required to reduce the current assets level
to manage liquidity risk and operational cost of the business.
Liquidity Ratios 2017 2016
Current Ratio
Current Assets / 5,160 4,150
Current liabilities
1,10
0
1,50
0
Answer: 4.69 2.77
Quick ratio
Current Assets -
Inventory / 2,800 2,350
Current Liabilities
1,10
0
1,50
0
Answer: 2.55 1.57
Gearing ratio:
Further, gearing ratios have been calculated. Gearing ratios depict about the resources
available and managed by the company to meet the long term solvency position. In this
report, gearing ratio and interest coverage ratio of the company has been evaluated to
measure the liquidity level of the company (Kurov and Stan, 2016).
Gearing ratio measures the solvency position of the company on the basis of total debt
available against the total assets. In case of Bitmap plc, it has been found that gearing ratio of
the company is 22.21% and 16.67% in the year of 2016 and 2017 respectively. It depicts that
gearing ratio of the company has improved in current year because of better management of
resources (appendix). It concludes that gearing position of the company is average.
Further, interest coverage ratio measures the gearing position of the company on the
basis of EBIT available against the interest expenses. In case of Bitmap plc, it has been found
that interest coverage ratio of the company is 10.20 and 6.80 in the year of 2016 and 2017
respectively. It depicts that interest coverage ratio of the company has reduced in current year
because of higher interest cost (appendix). It concludes that gearing position of the company
is average.
Gearing Ratios 2017 2016
Accounting and Financial Management 6
Gearing ratio
Total debt / 3,500 2,000
Total assets 15,760 12,000
Answer: % 22.21% 16.67%
Interest Coverage Ratio
EBIT / 6,800 5,100
Net Finance Costs (used net interest
expense) 1,000 500
Answer:
times
p.a
6.8
0
10.2
0
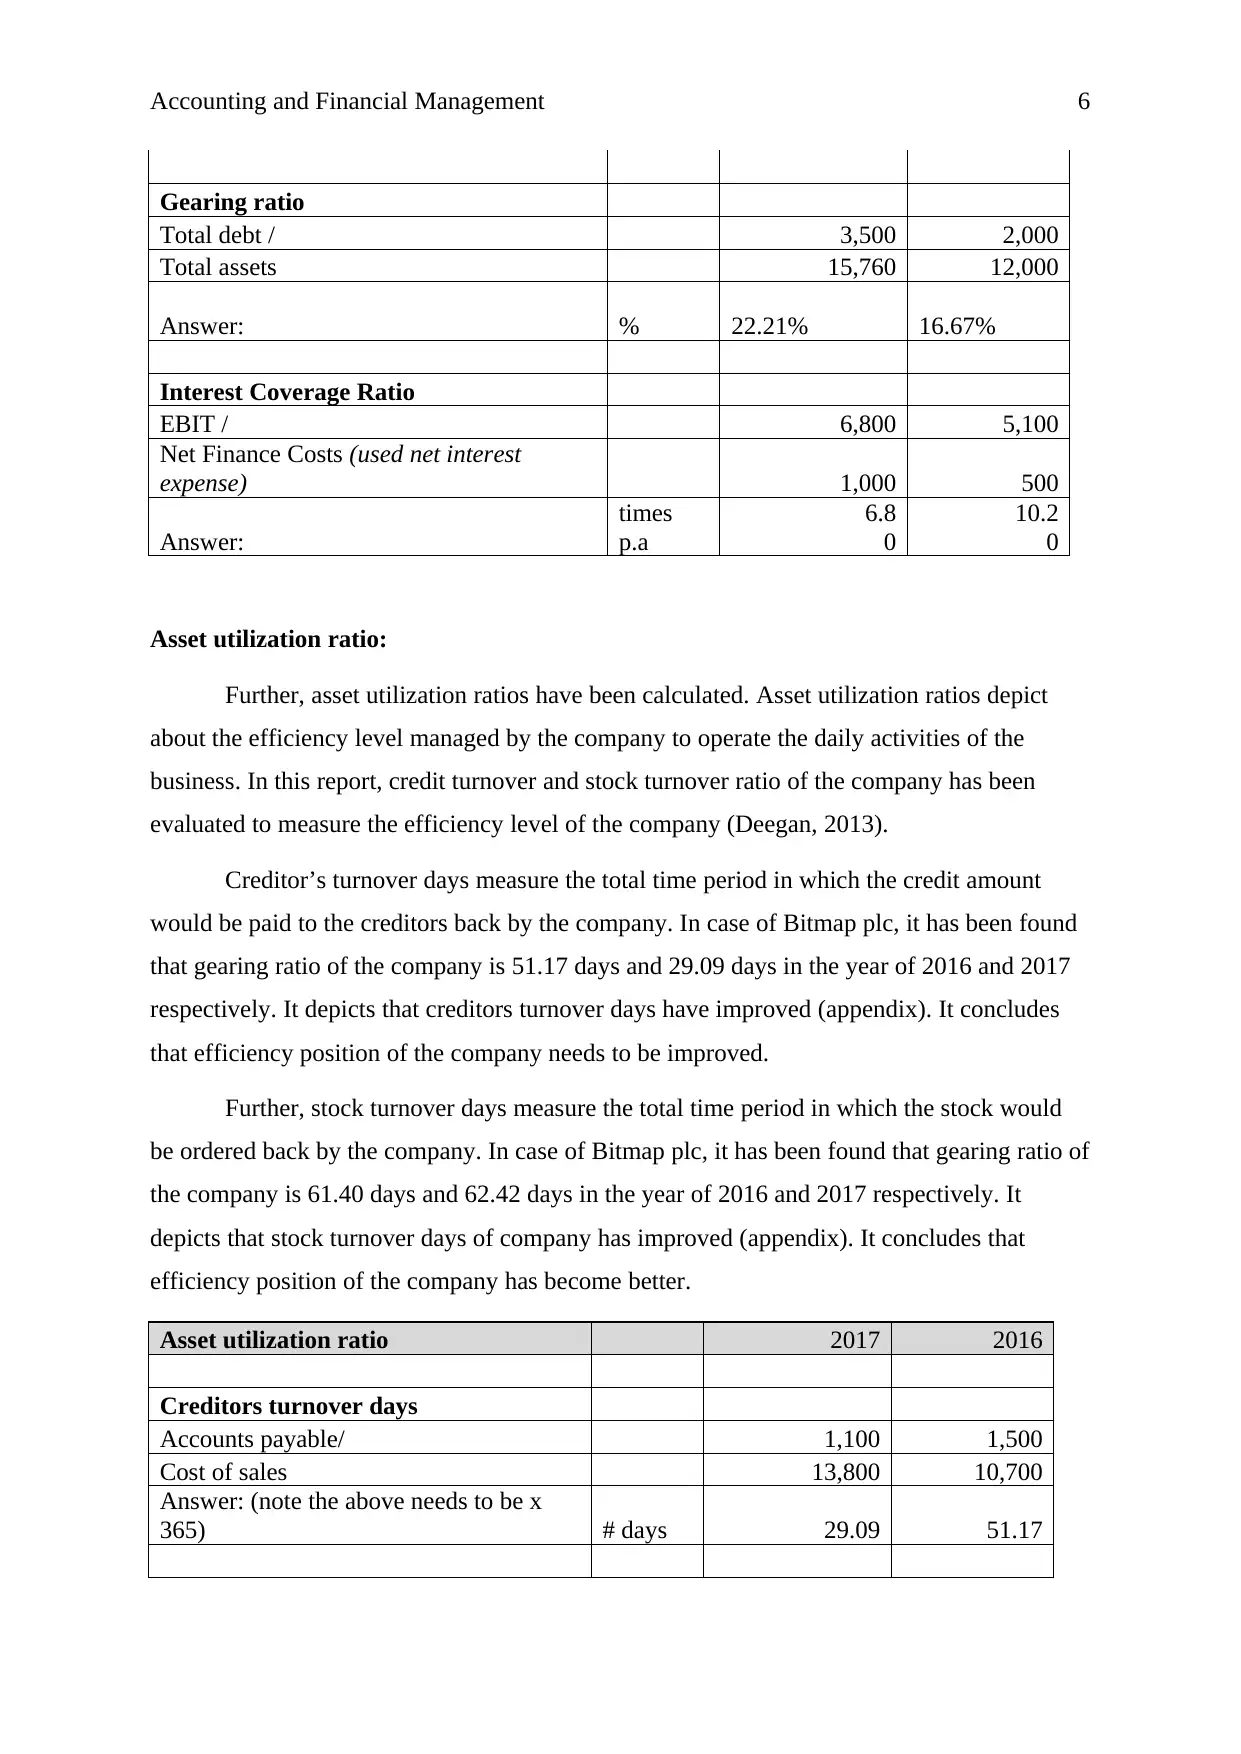
Asset utilization ratio:
Further, asset utilization ratios have been calculated. Asset utilization ratios depict
about the efficiency level managed by the company to operate the daily activities of the
business. In this report, credit turnover and stock turnover ratio of the company has been
evaluated to measure the efficiency level of the company (Deegan, 2013).
Creditor’s turnover days measure the total time period in which the credit amount
would be paid to the creditors back by the company. In case of Bitmap plc, it has been found
that gearing ratio of the company is 51.17 days and 29.09 days in the year of 2016 and 2017
respectively. It depicts that creditors turnover days have improved (appendix). It concludes
that efficiency position of the company needs to be improved.
Further, stock turnover days measure the total time period in which the stock would
be ordered back by the company. In case of Bitmap plc, it has been found that gearing ratio of
the company is 61.40 days and 62.42 days in the year of 2016 and 2017 respectively. It
depicts that stock turnover days of company has improved (appendix). It concludes that
efficiency position of the company has become better.
Asset utilization ratio 2017 2016
Creditors turnover days
Accounts payable/ 1,100 1,500
Cost of sales 13,800 10,700
Answer: (note the above needs to be x
365) # days 29.09 51.17
Gearing ratio
Total debt / 3,500 2,000
Total assets 15,760 12,000
Answer: % 22.21% 16.67%
Interest Coverage Ratio
EBIT / 6,800 5,100
Net Finance Costs (used net interest
expense) 1,000 500
Answer:
times
p.a
6.8
0
10.2
0
Asset utilization ratio:
Further, asset utilization ratios have been calculated. Asset utilization ratios depict
about the efficiency level managed by the company to operate the daily activities of the
business. In this report, credit turnover and stock turnover ratio of the company has been
evaluated to measure the efficiency level of the company (Deegan, 2013).
Creditor’s turnover days measure the total time period in which the credit amount
would be paid to the creditors back by the company. In case of Bitmap plc, it has been found
that gearing ratio of the company is 51.17 days and 29.09 days in the year of 2016 and 2017
respectively. It depicts that creditors turnover days have improved (appendix). It concludes
that efficiency position of the company needs to be improved.
Further, stock turnover days measure the total time period in which the stock would
be ordered back by the company. In case of Bitmap plc, it has been found that gearing ratio of
the company is 61.40 days and 62.42 days in the year of 2016 and 2017 respectively. It
depicts that stock turnover days of company has improved (appendix). It concludes that
efficiency position of the company has become better.
Asset utilization ratio 2017 2016
Creditors turnover days
Accounts payable/ 1,100 1,500
Cost of sales 13,800 10,700
Answer: (note the above needs to be x
365) # days 29.09 51.17
⊘ This is a preview!⊘
Do you want full access?
Subscribe today to unlock all pages.
Trusted by 1+ million students worldwide
Accounting and Financial Management 7
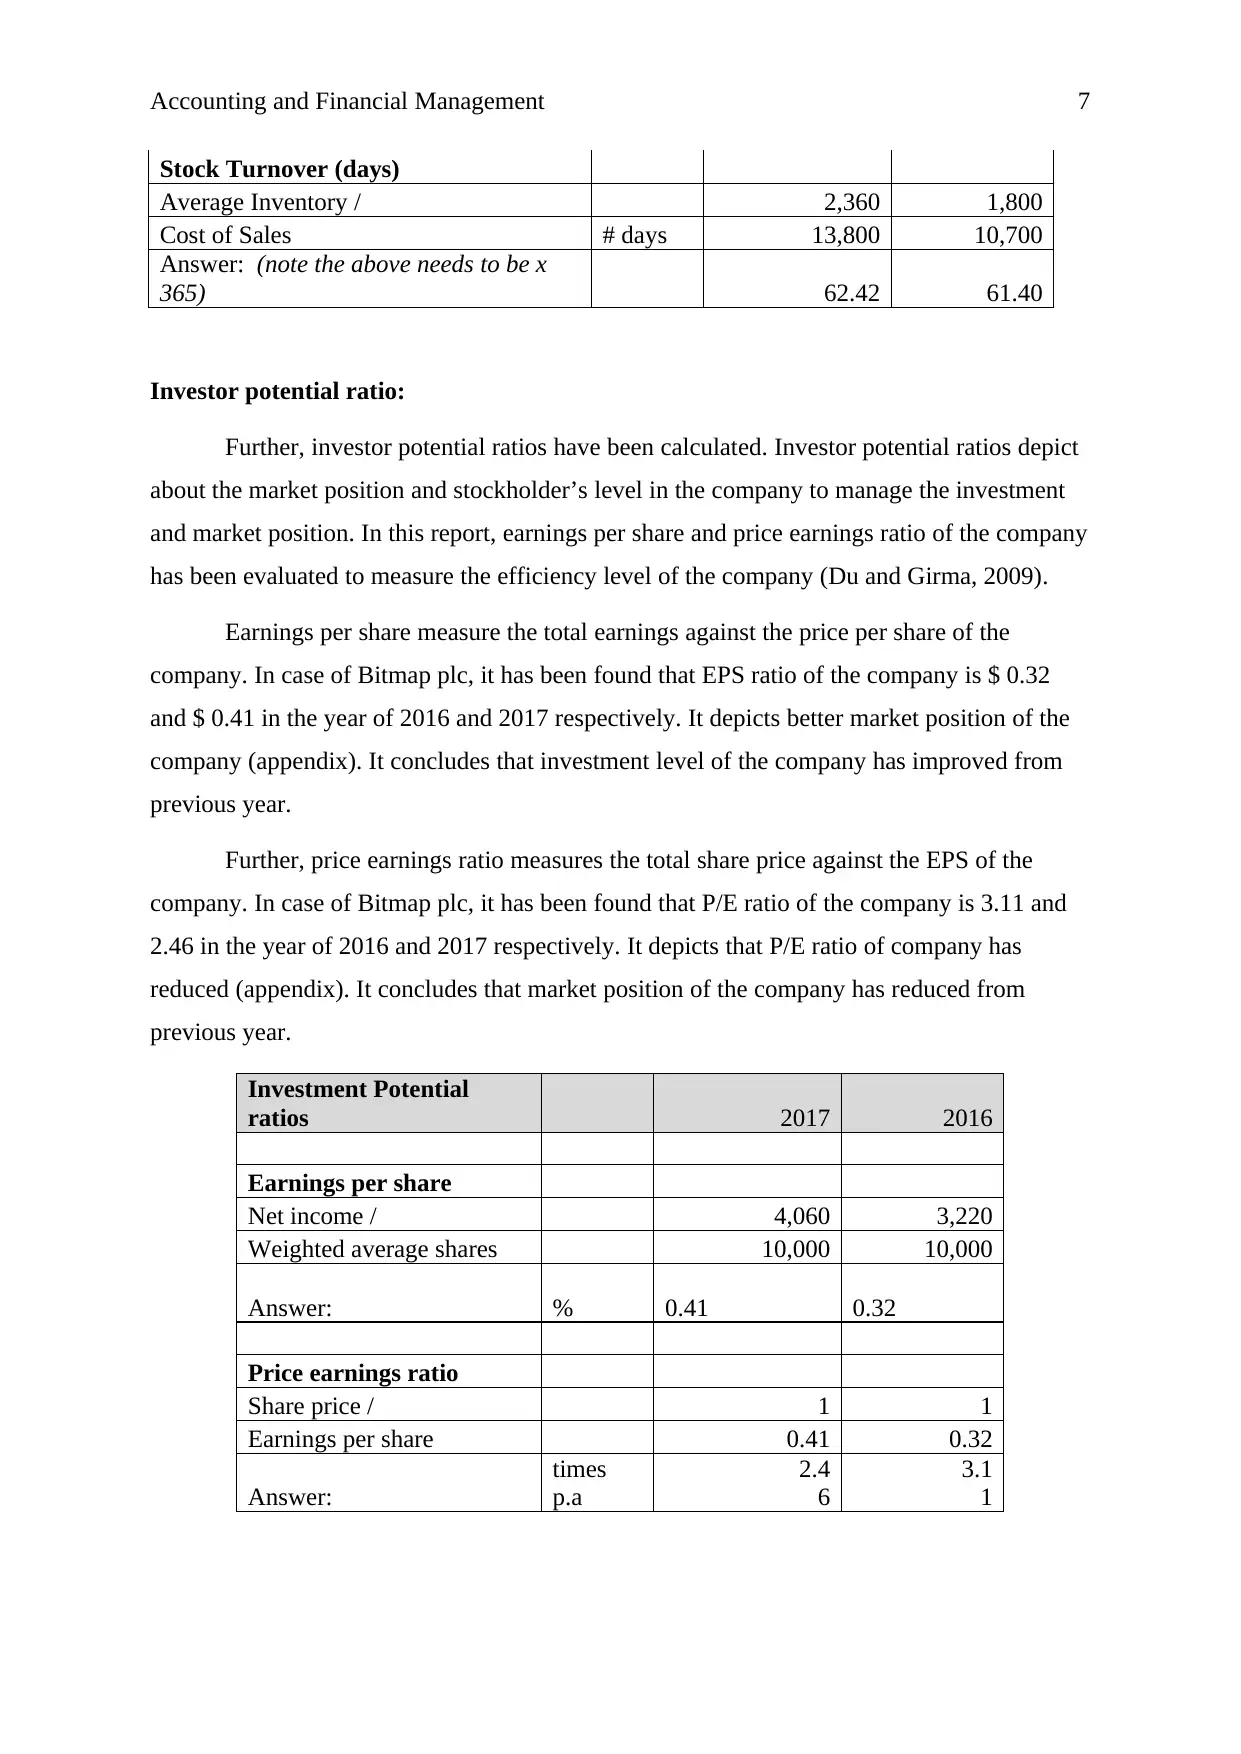
Stock Turnover (days)
Average Inventory / 2,360 1,800
Cost of Sales # days 13,800 10,700
Answer: (note the above needs to be x
365) 62.42 61.40
Investor potential ratio:
Further, investor potential ratios have been calculated. Investor potential ratios depict
about the market position and stockholder’s level in the company to manage the investment
and market position. In this report, earnings per share and price earnings ratio of the company
has been evaluated to measure the efficiency level of the company (Du and Girma, 2009).
Earnings per share measure the total earnings against the price per share of the
company. In case of Bitmap plc, it has been found that EPS ratio of the company is $ 0.32
and $ 0.41 in the year of 2016 and 2017 respectively. It depicts better market position of the
company (appendix). It concludes that investment level of the company has improved from
previous year.
Further, price earnings ratio measures the total share price against the EPS of the
company. In case of Bitmap plc, it has been found that P/E ratio of the company is 3.11 and
2.46 in the year of 2016 and 2017 respectively. It depicts that P/E ratio of company has
reduced (appendix). It concludes that market position of the company has reduced from
previous year.
Investment Potential
ratios 2017 2016
Earnings per share
Net income / 4,060 3,220
Weighted average shares 10,000 10,000
Answer: % 0.41 0.32
Price earnings ratio
Share price / 1 1
Earnings per share 0.41 0.32
Answer:
times
p.a
2.4
6
3.1
1
Paraphrase This Document
Need a fresh take? Get an instant paraphrase of this document with our AI Paraphraser
Accounting and Financial Management 8
Working capital cycle:
Working capital cycle is one of the important aspects for a business. It is calculated to
measure the total time period which would take by the business to convert net working
capital into the cash equivalents. In case of Bitmap plc, it has been recognized that inventory
conversion cycle, receivable collection period and payable deferral period of the company is
62.42 days, 36.50 days and 29.09 days which defines that working capital cycle of the
company is 69.83 days (appendix). It defines that the efficiency level of the company is quite
better and company could manage its operations in lesser cash and cash equivalent resources.
Conclusion and recommendation:
On the basis of entire study over financial analysis and working capital cycle of the
business, it has been recognized that business is required to improve profitability position in
the market to improve the performance of the company. Further, liquidity level could be
reduced by the business. Efficiency level, solvency position and investment potential
performance of the company is quite better. Few changes into business can lead the business
towards better performance.
Accounting and Financial Management 9
Part B:
Introduction:
The report has been prepared for the directors of Toyland ltd in order to present them
about the different investment option available in the market. In order to depict about the
better option for the investment, capital budgeting techniques has been presented on the
company. Further, the limitations, advantages and sources of capital of the company have
also been prepared to measure the financial opportunities of the company.
Investment appraisal technique:
In order to measure the feasibility of two available options, various capital budgeting
techniques have been applied on the company which are as follows:
The payback period:
Payback period is capital investment appraisal method which is used by the
companies to measure the total time period in which the investment amount would be got
back by the company. The calculations of payback period have been applied on both the
investment appraisal techniques of the company to measure the better feasible option for the
company. Below is the formula of payback period of the company:
Pay Back Period= Initial investment/ cash inflow per period (Gali, 2015)
Through applying the payback period formula over both the investment options of the
company, it has been found that the investment amount would be got back by the company in
1.8 years if the investment would be done in Machinery A. and in case of machinery B,
investment amount would be got back in 4.32 years (Appendix). It explains that Machinery A
is more feasible due to the fact that amount would be got back by the company sooner in this
case.
The discounted payback period:
Discounted payback period modified version of payback period. In addition to the
payback period method, this technique considers the time factor. The calculations of
discounted payback period have been applied on both the investment appraisal techniques of
the company to measure the better feasible option for the company. Below is the formula of
discounted payback period of the company:
⊘ This is a preview!⊘
Do you want full access?
Subscribe today to unlock all pages.
Trusted by 1+ million students worldwide
Accounting and Financial Management 10
Discounted pay Back Period= (Initial investment * time factor) / cash inflow per period
(Fernandes, Lynch and Netemeyer, 2014)
Through applying the payback period formula over both the investment options of the
company, it has been found that the investment amount would be got back by the company in
2.14 years if the investment would be done in Machinery A. and in case of machinery B,
investment amount would be got back in 5.18 years (Appendix). It explains that Machinery A
is more feasible due to the fact that amount would be got back by the company sooner in this
case.
The accounting rate of return:
ARR method is used by the companies to measure the total return which would be got
through investing in the investment option available. The calculations of ARR have been
applied on both the investment appraisal techniques of the company to measure the better
feasible option for the company. Below is the formula of ARR of the company:
ARR= AVERAGE ACCOUNTING PROFIT/ AVERAGE INVESTMENT (Borio, 2014)
Through applying the ARR formula over both the investment options of the company,
it has been found that the total average return from Machinery A and Machinery B would be
34.55% and 34.55% respectively (appendix). It explains that Machinery A and B both have
same return.
The net present value:
Net present value is used by the companies to measure the total profit from the
investment opportunity. The calculations of Net present value have been applied on both the
investment appraisal techniques of the company to measure the better feasible option for the
company. Below is the formula of Net present value of the company:
NPV= Total Cash Inflow-Total cash outflow (Grinblatt and Titman, 2016)
Through applying the NPV formula over both the investment options of the company,
it has been found that the total net profit from Machinery A and Machinery B would be £
302,380 and £161,380.00 respectively (appendix). It explains that Machinery A is more
feasible due to the higher return.
The internal rate of return:
Paraphrase This Document
Need a fresh take? Get an instant paraphrase of this document with our AI Paraphraser
Accounting and Financial Management 11
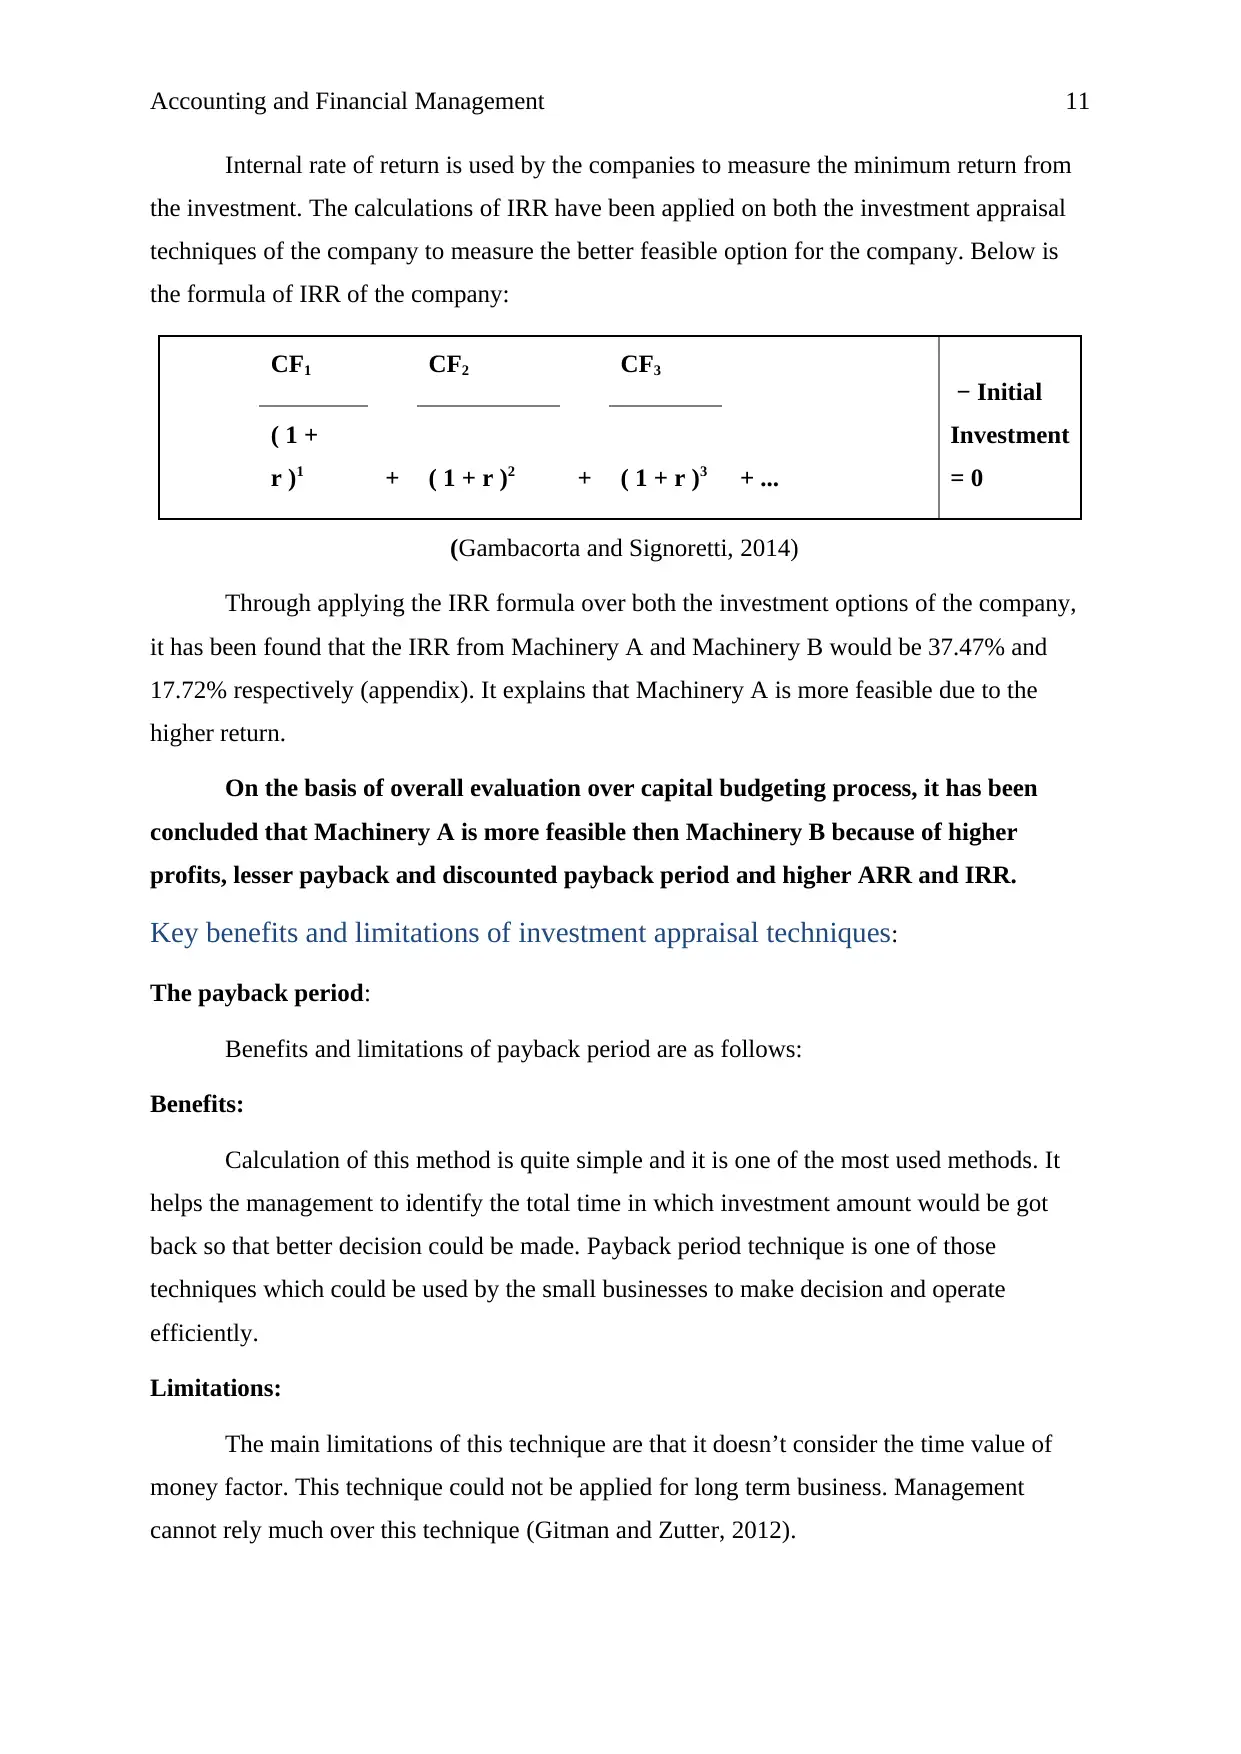
Internal rate of return is used by the companies to measure the minimum return from
the investment. The calculations of IRR have been applied on both the investment appraisal
techniques of the company to measure the better feasible option for the company. Below is
the formula of IRR of the company:
CF1
+
CF2
+
CF3
+ ...
− Initial
Investment
= 0
( 1 +
r )1 ( 1 + r )2 ( 1 + r )3
(Gambacorta and Signoretti, 2014)
Through applying the IRR formula over both the investment options of the company,
it has been found that the IRR from Machinery A and Machinery B would be 37.47% and
17.72% respectively (appendix). It explains that Machinery A is more feasible due to the
higher return.
On the basis of overall evaluation over capital budgeting process, it has been
concluded that Machinery A is more feasible then Machinery B because of higher
profits, lesser payback and discounted payback period and higher ARR and IRR.
Key benefits and limitations of investment appraisal techniques:
The payback period:
Benefits and limitations of payback period are as follows:
Benefits:
Calculation of this method is quite simple and it is one of the most used methods. It
helps the management to identify the total time in which investment amount would be got
back so that better decision could be made. Payback period technique is one of those
techniques which could be used by the small businesses to make decision and operate
efficiently.
Limitations:
The main limitations of this technique are that it doesn’t consider the time value of
money factor. This technique could not be applied for long term business. Management
cannot rely much over this technique (Gitman and Zutter, 2012).

Accounting and Financial Management 12
To conclude, this technique is not one of the better choices to be considered by the
businesses in order to make decision about long term project. It can help the small business to
make better decisions.
The discounted payback period:
Benefits and limitations of discounted payback period are as follows:
Benefits:
Unlike payback period technique, this technique considers the time value of money to
identify the actual time in which the worth of investment amount could be got back. Process
is quite simple and helps the management to make better decisions. It helps the management
to decide about the actual time in which the worth of invested amount would be got back by
the business. this makes it simple for the management to identify that investment must be
done or not.
Limitations:
This is limited to identify the time period. Complexity level of calculation is quite
higher. It cannot be used by the small and medium businesses because of higher intelligence
required and complexity. It doesn’t take the concern over other cash flows after the total time
period in which invested amount would be got back by the company. This is limited to time
period only.
To conclude, this method could be used for long term project by the large businesses.
It would help them to get better result and make decision about investment.
The accounting rate of return:
Benefits and limitations accounting rate of return are as follows:
Benefits:
Because of lesser complexity and reliable result, it is one of the most used techniques.
It helps the small as well as large companies to identify the average return from the
investment and make better decision about the performance of the company (Horngren et al,
2015).
Limitations:
This technique ignores the worth of time value of money. It takes the consideration of
average result which can’t be reliable.
⊘ This is a preview!⊘
Do you want full access?
Subscribe today to unlock all pages.
Trusted by 1+ million students worldwide
1 out of 26
Related Documents


Your All-in-One AI-Powered Toolkit for Academic Success.
+13062052269
info@desklib.com
Available 24*7 on WhatsApp / Email
![[object Object]](/_next/static/media/star-bottom.7253800d.svg)
Unlock your academic potential
Copyright © 2020–2026 A2Z Services. All Rights Reserved. Developed and managed by ZUCOL.