GSBS6200 Accounting and Financial Management: JB Hi-Fi Analysis Report
VerifiedAdded on 2023/04/20
|25
|4703
|203
Report
AI Summary
This report provides a comprehensive financial analysis of JB Hi-Fi, utilizing financial data from 2016 to 2018 to assess the company's performance. The analysis includes a trend analysis of sales, profit/loss, assets, liabilities, and equity, along with ratio analysis covering profitability, efficiency, liquidity, and market performance. The report identifies the company's strengths and weaknesses, offering an overall assessment of its financial health and recommendations for future improvement, while also acknowledging the limitations of the analysis. The data is accumulated from the annual reports of JB Hi-Fi, which are then interpreted to understand the financial trends of the company.

Running head: ACCOUNTING AND FINANCIAL MANAGEMENT
Accounting and Financial Management
Name of the student:
Name of the university:
Author Note:
Accounting and Financial Management
Name of the student:
Name of the university:
Author Note:
Paraphrase This Document
Need a fresh take? Get an instant paraphrase of this document with our AI Paraphraser
1ACCOUNTING AND FINANCIAL MANAGEMENT
Table of Contents
I. LIST OF FIGURES..............................................................................................................2
II. LIST OF TABLES..............................................................................................................3
III. LIST OF FORMULAS......................................................................................................4
EXECUTIVE SUMMARY......................................................................................................5
1. INTRODUCTION...............................................................................................................6
2. COMPANY INFO AND NATURE OF THE BUSINESS...............................................6
3. TREND ANALYSIS............................................................................................................7
3.1 SALES ANALYSIS............................................................................................................8
3.2 PROFIT/LOSS ANALYSIS..............................................................................................9
3.3 ASSET ANALYSIS..........................................................................................................10
3.4 LIABILITIES AND EQUITY.........................................................................................11
4. RATIO ANALYSIS..........................................................................................................13
4.1 THE DATA.......................................................................................................................13
4.2 PROFITABILITY RATIOS...........................................................................................13
4.3 EFFICIENCY RATIOS...................................................................................................14
4.4 LIQUIDITY ANALYSIS.................................................................................................15
4.5 MARKET PERFORMANCE ANALYSIS....................................................................15
5. OVERALL ANALYSIS....................................................................................................16
6. LIMITATIONS OF ANALYSIS.....................................................................................17
7. CONCLUSION..................................................................................................................18
2ACCOUNTING AND FINANCIAL MANAGEMENT
References...............................................................................................................................19
Appendix.................................................................................................................................22
I. LIST OF FIGURES
Figure 1: JB Hi-Fi revenue........................................................................................ 9
Figure 2: Year Wise comparison of Income, Expenses and Operating Profit ............. 10
Figure 3: Year Wise absolute change percentage comparison of EBIT, Profit before income
tax expense, and total Profit the year..............................................................................11
Figure 4: Development of current, non-current and total assets 2016 to 2018 (base 2016)... 12
Figure 5: The development of the liabilities and the total equity with 2016 as base (100%)
…………………………………………………………………………………………….. 13
Figure 6: Development of current assets (CA) with the year 2016 as base (100%) ............ 13
⊘ This is a preview!⊘
Do you want full access?
Subscribe today to unlock all pages.
Trusted by 1+ million students worldwide
3ACCOUNTING AND FINANCIAL MANAGEMENT
II. LIST OF TABLES
Table 1: Revenue, Expenses and the resulting Operating Profit of the years 2016 to 2018.... 5
Table 2: EBIT, Profit before income tax and total profit of the year...................................... 6
Table 3: Values of the current assets, non-current assets, and total assets of JB Hi-Fi...........8
Table 4: Values of the current liabilities, non-current liabilities, total liabilities and the total
Equity of JB Hi-Fi in the years 2016 to 2018.......................................................................... 9
Table 5: Probability ratios ...................................................................................................... 12
Table 6: Efficiency ratios ...................................................................................................... 13
Table 7: Liquidity analysis..................................................................................................... 14
Table 8: Market performance analysis................................................................................... 14
Paraphrase This Document
Need a fresh take? Get an instant paraphrase of this document with our AI Paraphraser
4ACCOUNTING AND FINANCIAL MANAGEMENT
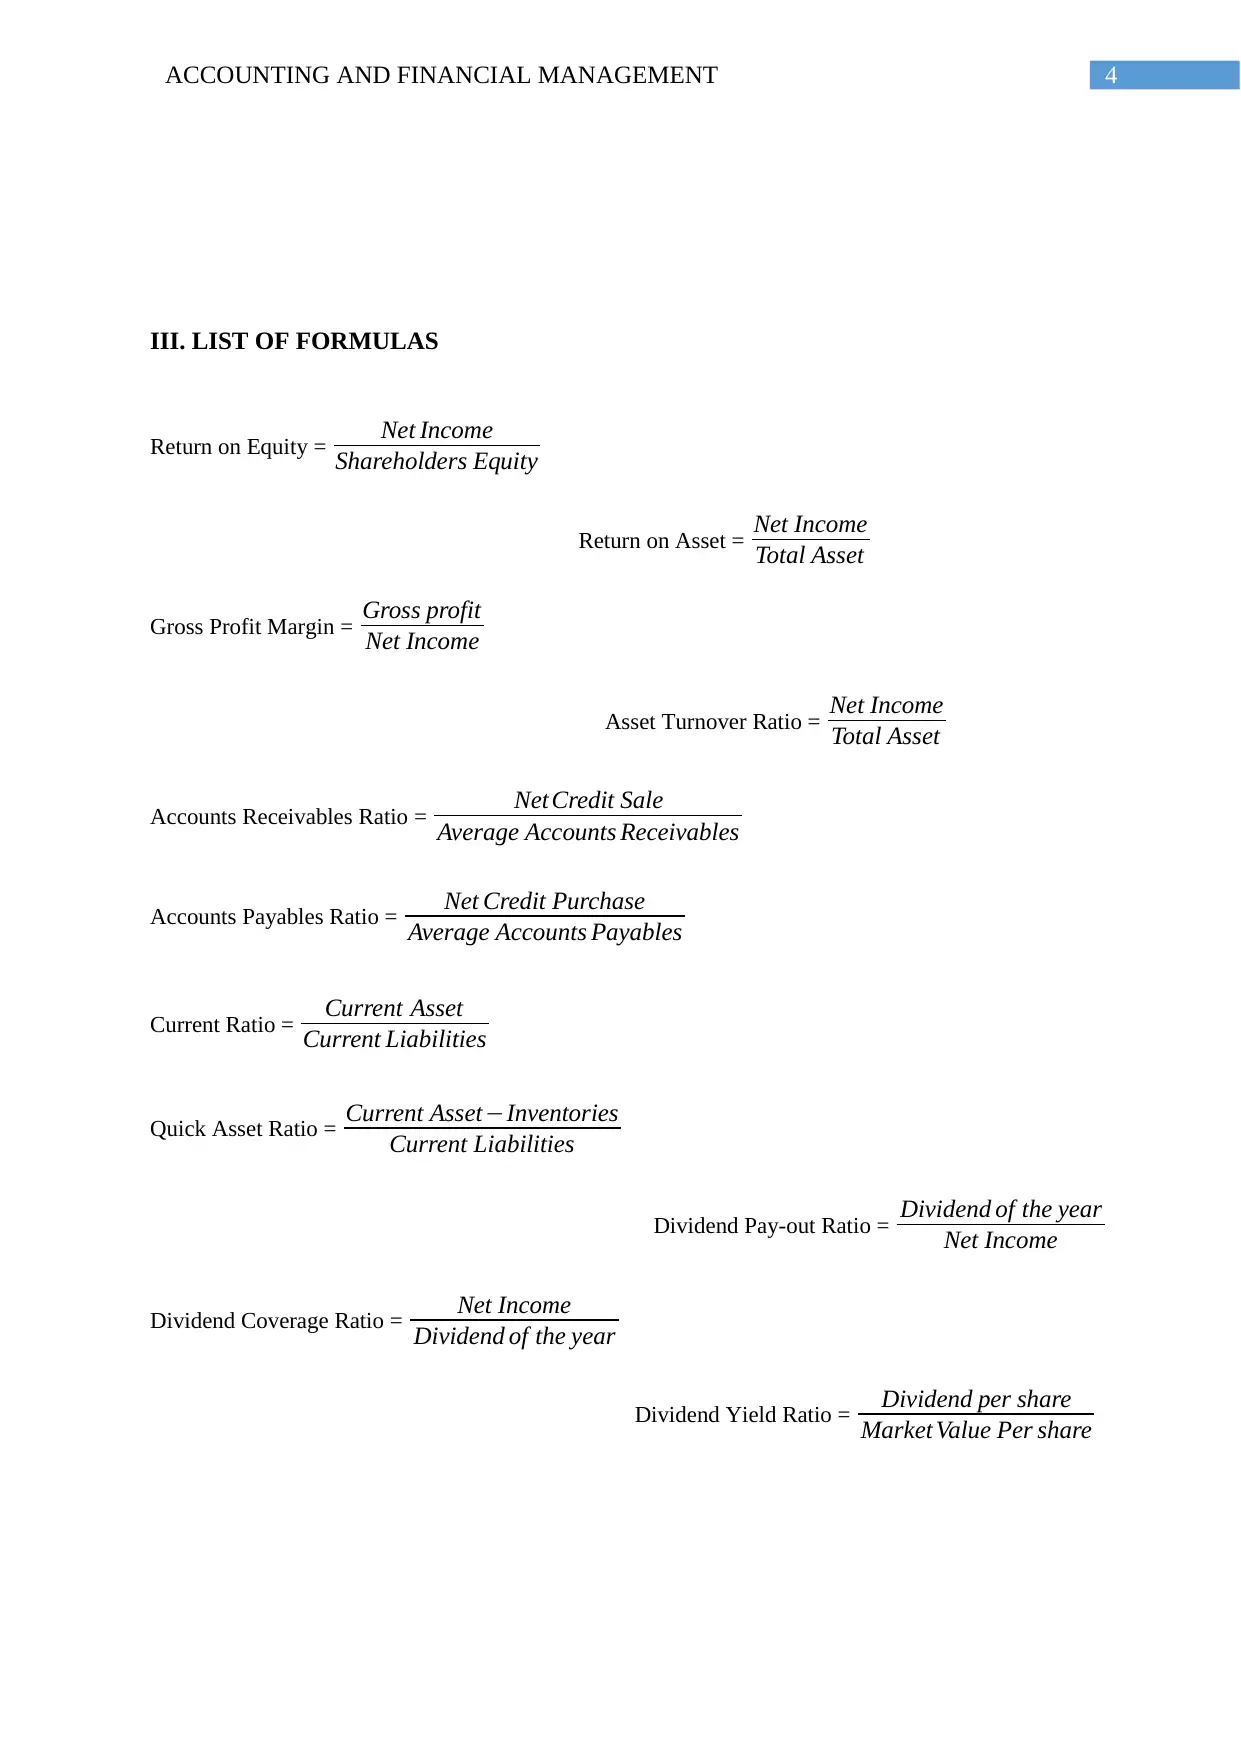
III. LIST OF FORMULAS
Return on Equity = Net Income
Shareholders Equity
Return on Asset = Net Income
Total Asset
Gross Profit Margin = Gross profit
Net Income
Asset Turnover Ratio = Net Income
Total Asset
Accounts Receivables Ratio = Net Credit Sale
Average Accounts Receivables
Accounts Payables Ratio = Net Credit Purchase
Average Accounts Payables
Current Ratio = Current Asset
Current Liabilities
Quick Asset Ratio = Current Asset−Inventories
Current Liabilities
Dividend Pay-out Ratio = Dividend of the year
Net Income
Dividend Coverage Ratio = Net Income
Dividend of the year
Dividend Yield Ratio = Dividend per share
Market Value Per share
5ACCOUNTING AND FINANCIAL MANAGEMENT
EXECUTIVE SUMMARY
The report deals with the overall financial performance of JB Hi-Fi limited and accordingly
the trend analysis is performed with the help of the various parameters. The strength and the
weakness of the company is hereby identified according with the help of the ratio analysis.
As per the annual report of the last three years of the company which are the 2016, 2017 and
2018 is performed. The company’s strong performance gas been identified in a detailed
manner in this conducted study.
⊘ This is a preview!⊘
Do you want full access?
Subscribe today to unlock all pages.
Trusted by 1+ million students worldwide
6ACCOUNTING AND FINANCIAL MANAGEMENT
1. INTRODUCTION
The aims of the assignment is to perform the financial position of the business of the
chosen company which is the JB Hi-Fi limited. The business of the company is analyzed
which are the retail products of the company. The range of the retail products of the company
is large which further deals with the large retailers of similar kind of business (Banerjee et al.,
2016). The trend analysis of the chosen company is analyzed which are the sales, profit and
loss, ratios and many other conducted in this assignment. The various business strategy
adopted by the company in order to enlarge the business of the company is analyzed (Barr &
McClellan, 2018). Finally recommendations of the overall analysis of the business is
provided according with the limitations to such study. The current position of the business of
the company is analyzed in various dimensions from the three year annual report of the
company which is 2016, 2017 and 2018 in order to understand the financial health of the
business for the last three years.
2. COMPANY INFO AND NATURE OF THE BUSINESS
JB Hi-Fi limited is the chosen company in the assignment which is a retailer company
of the consumer goods. This company deals with the products which is related to the video
games such as the Blu-rays, DVDs, home electronic appliances, mobile phones and many
more. This company is established during the year 1974 in Melbourne by John Barbuto. In
today’s modern world which is the technological era JB stores offers its clients the world’s
leading brands which are the computers, tablets, speakers, home theaters, and many more.
This company is also known for the worlds famous in terms of the gaming videos like the
PlayStation 4, Xbox one and many more gaming consoles like this, apart from that the
Paraphrase This Document
Need a fresh take? Get an instant paraphrase of this document with our AI Paraphraser
7ACCOUNTING AND FINANCIAL MANAGEMENT
movies, TV shows, and other products. This company also offers the best price of the
products at various ranges and its cheapest price attracts most of the customers which further
makes the brand much more famous (Chang et al., 2015). At present the CEO of the company
is Richard Murray where the top companies in the line ups is the Harvey Norman, Scaale,
Simon, Ikea and others competing with this company. This company sources their products
from the world leading global manufacturers which are the Sony, Samsung, LG, Apple, HP
and other leading brands who deals with this kind of products. The retail product dealt by the
company is such a business which dominates the technological era in today’s modernized
technological era.
As per the IBIS World, JB Hi-Fi’s retail department which are the domestic appliance
industry’s largest heavyweight, having an estimated of 31.1% market share in the year 2016-
17. The domestic appliance retailing industry is further expected to generate over $13.8
billion in terms of revenue in the financial year 2016-17, with an estimated growth of about
2.4% over the five years through 2016-17. IBIS World senior industry analyst, Brian Lo said
that JB Hi-Fi has made significant changes in the last five years in capturing a greater share
of the domestic appliance retailing industry in order to create a strong dominance in this
industry. The company substantially boosted its market share following the launch of its JB
Hi-Fi Home stores in the year 2012, which are the retail white goods, cooking and other
household appliances.
3. TREND ANALYSIS
In order to perform the trend analysis of the Jb Hi-Fi Company the data are
accumulated from the annual report of the financial year 2016, 2017 and 2018. The trend
analysis is technical analysis which is performed in order to understand the financial trend of
the evaluated data. Basically trend analysis of the company is done in order to understand the
8ACCOUNTING AND FINANCIAL MANAGEMENT
price movements and the overall momentum of the market. In this particular company trend
analysis is done to understand the income statement and the balance sheet of JB Hi-Fi limited
for the financial year 2016, 2017 and 2018.
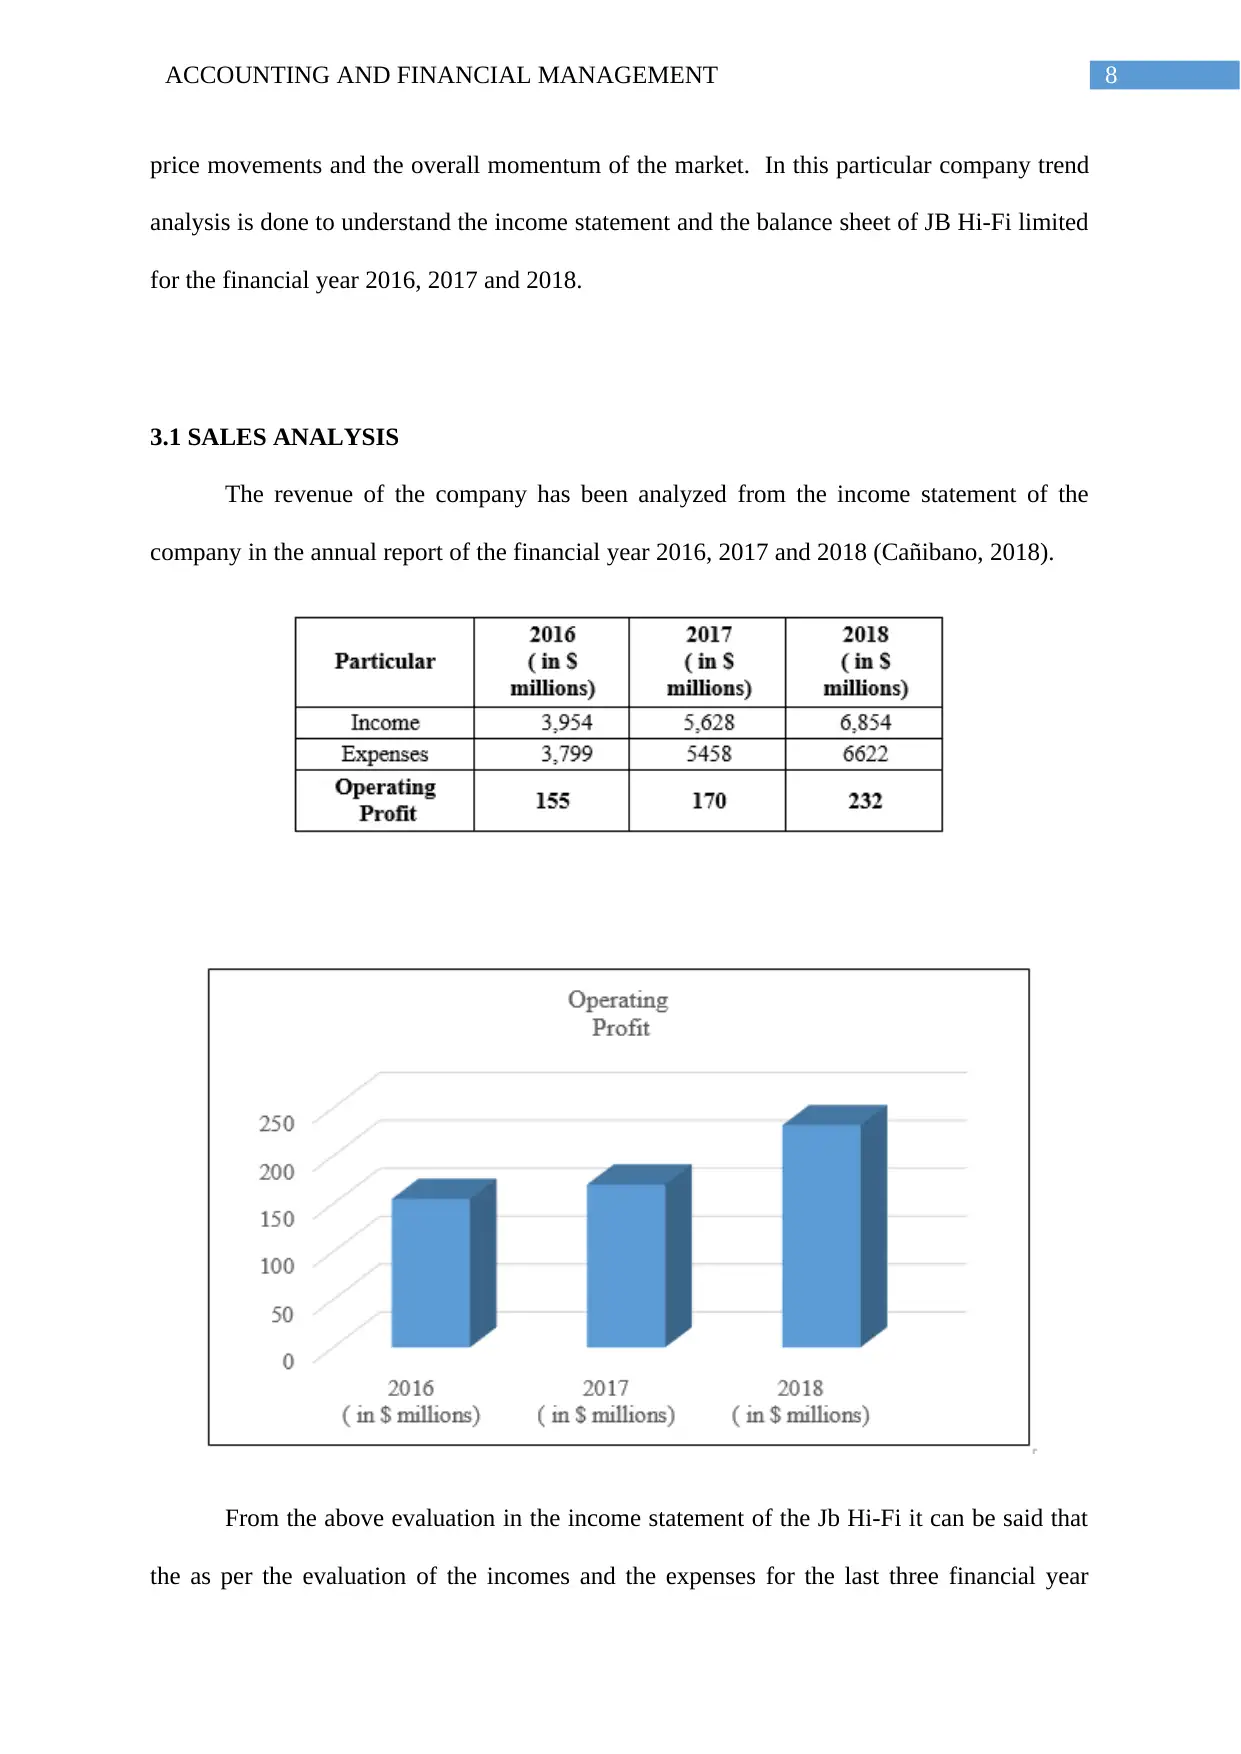
3.1 SALES ANALYSIS
The revenue of the company has been analyzed from the income statement of the
company in the annual report of the financial year 2016, 2017 and 2018 (Cañibano, 2018).
From the above evaluation in the income statement of the Jb Hi-Fi it can be said that
the as per the evaluation of the incomes and the expenses for the last three financial year
price movements and the overall momentum of the market. In this particular company trend
analysis is done to understand the income statement and the balance sheet of JB Hi-Fi limited
for the financial year 2016, 2017 and 2018.
3.1 SALES ANALYSIS
The revenue of the company has been analyzed from the income statement of the
company in the annual report of the financial year 2016, 2017 and 2018 (Cañibano, 2018).
From the above evaluation in the income statement of the Jb Hi-Fi it can be said that
the as per the evaluation of the incomes and the expenses for the last three financial year
⊘ This is a preview!⊘
Do you want full access?
Subscribe today to unlock all pages.
Trusted by 1+ million students worldwide
9ACCOUNTING AND FINANCIAL MANAGEMENT
which is the 2016, 2017 and 2018. The profit of the company is increasing gradually which is
a satisfactory sign indicates that the company is expanding the business in the retail sectors.
Gradually the revenue of the company is increasing in terms of the operating profit of the
business. The business of the company is in peak which indicates that the operations of the
company is effective and efficient. The investment of the firm is also good which is able to
generate returns in the last three years comparison that’s why the revenue of the company is
increasing gradually. The profitability position of the business is strong as the technological
enhancement is further driving this kind of business to the next level.
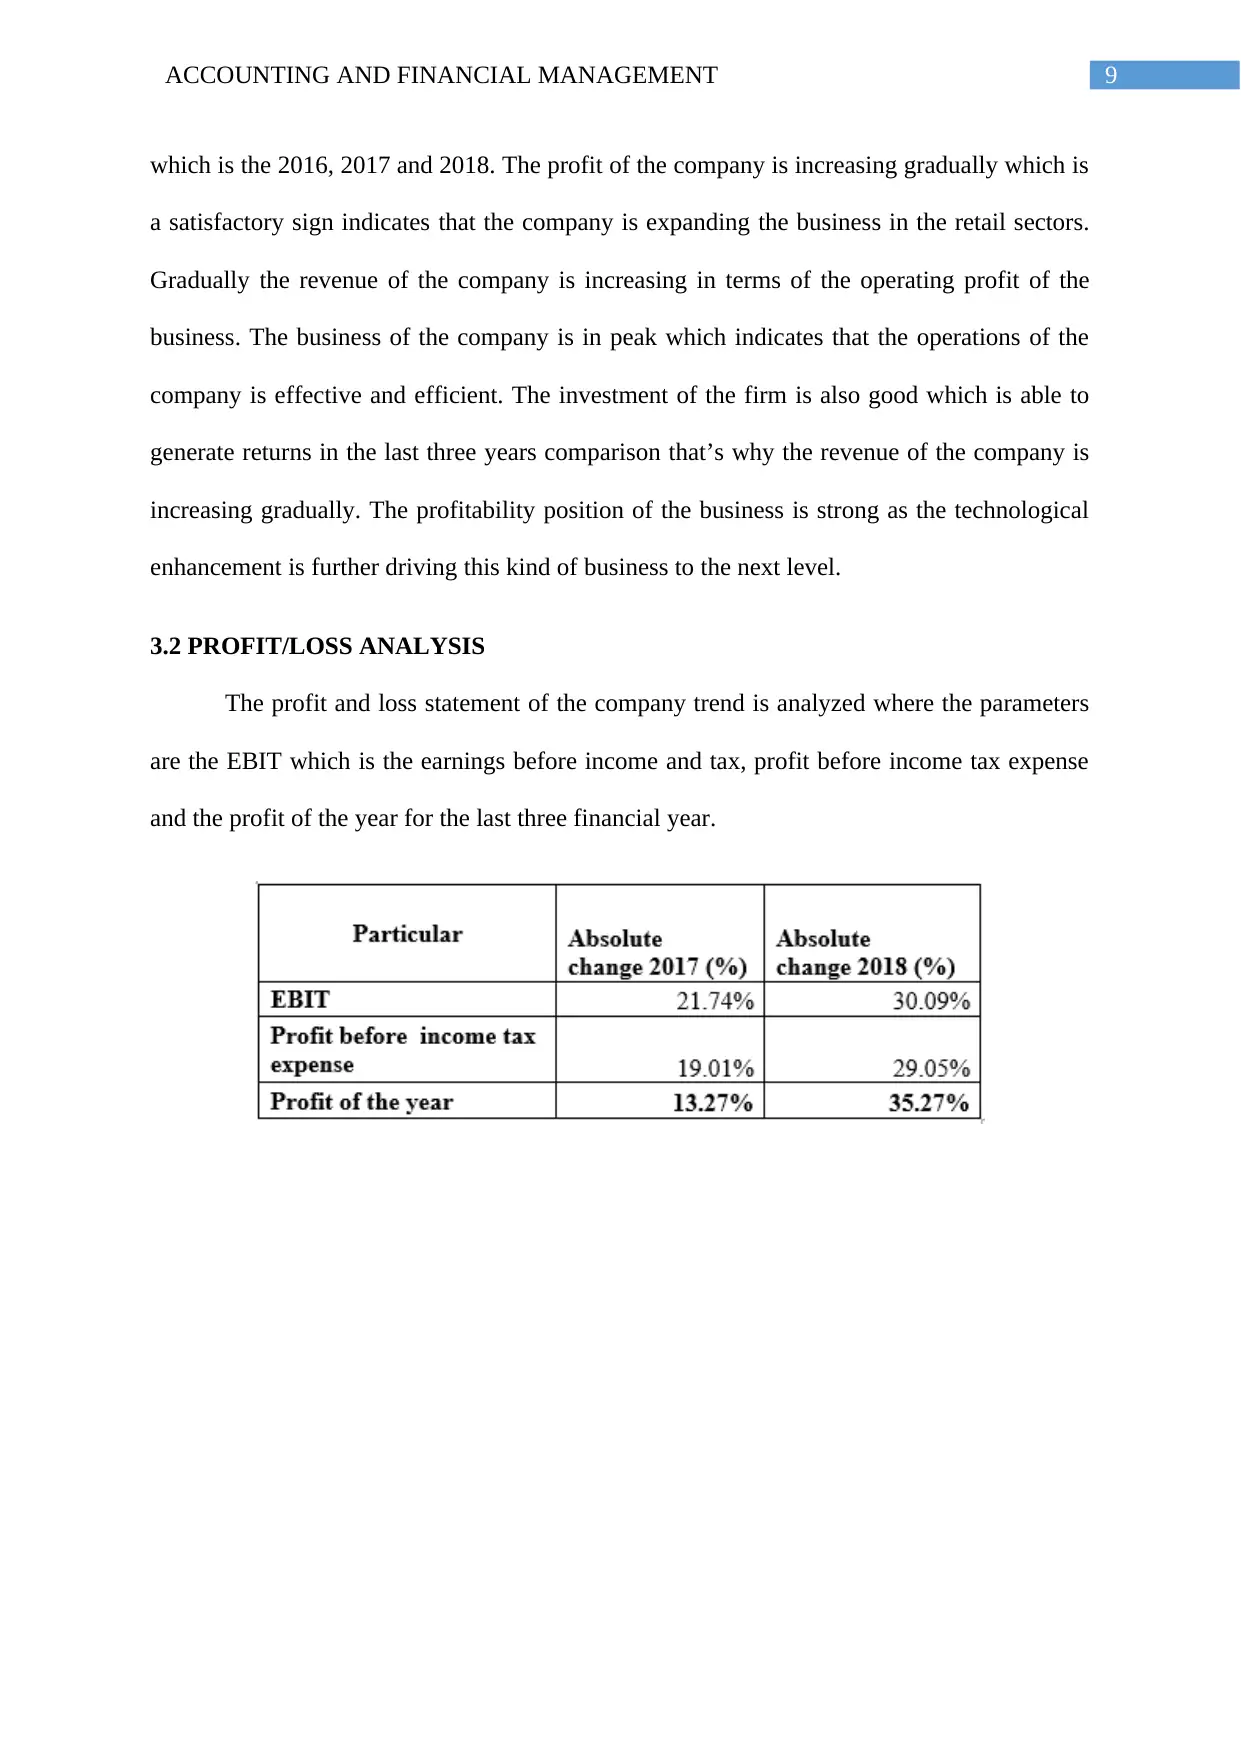
3.2 PROFIT/LOSS ANALYSIS
The profit and loss statement of the company trend is analyzed where the parameters
are the EBIT which is the earnings before income and tax, profit before income tax expense
and the profit of the year for the last three financial year.
which is the 2016, 2017 and 2018. The profit of the company is increasing gradually which is
a satisfactory sign indicates that the company is expanding the business in the retail sectors.
Gradually the revenue of the company is increasing in terms of the operating profit of the
business. The business of the company is in peak which indicates that the operations of the
company is effective and efficient. The investment of the firm is also good which is able to
generate returns in the last three years comparison that’s why the revenue of the company is
increasing gradually. The profitability position of the business is strong as the technological
enhancement is further driving this kind of business to the next level.
3.2 PROFIT/LOSS ANALYSIS
The profit and loss statement of the company trend is analyzed where the parameters
are the EBIT which is the earnings before income and tax, profit before income tax expense
and the profit of the year for the last three financial year.
Paraphrase This Document
Need a fresh take? Get an instant paraphrase of this document with our AI Paraphraser
10ACCOUNTING AND FINANCIAL MANAGEMENT
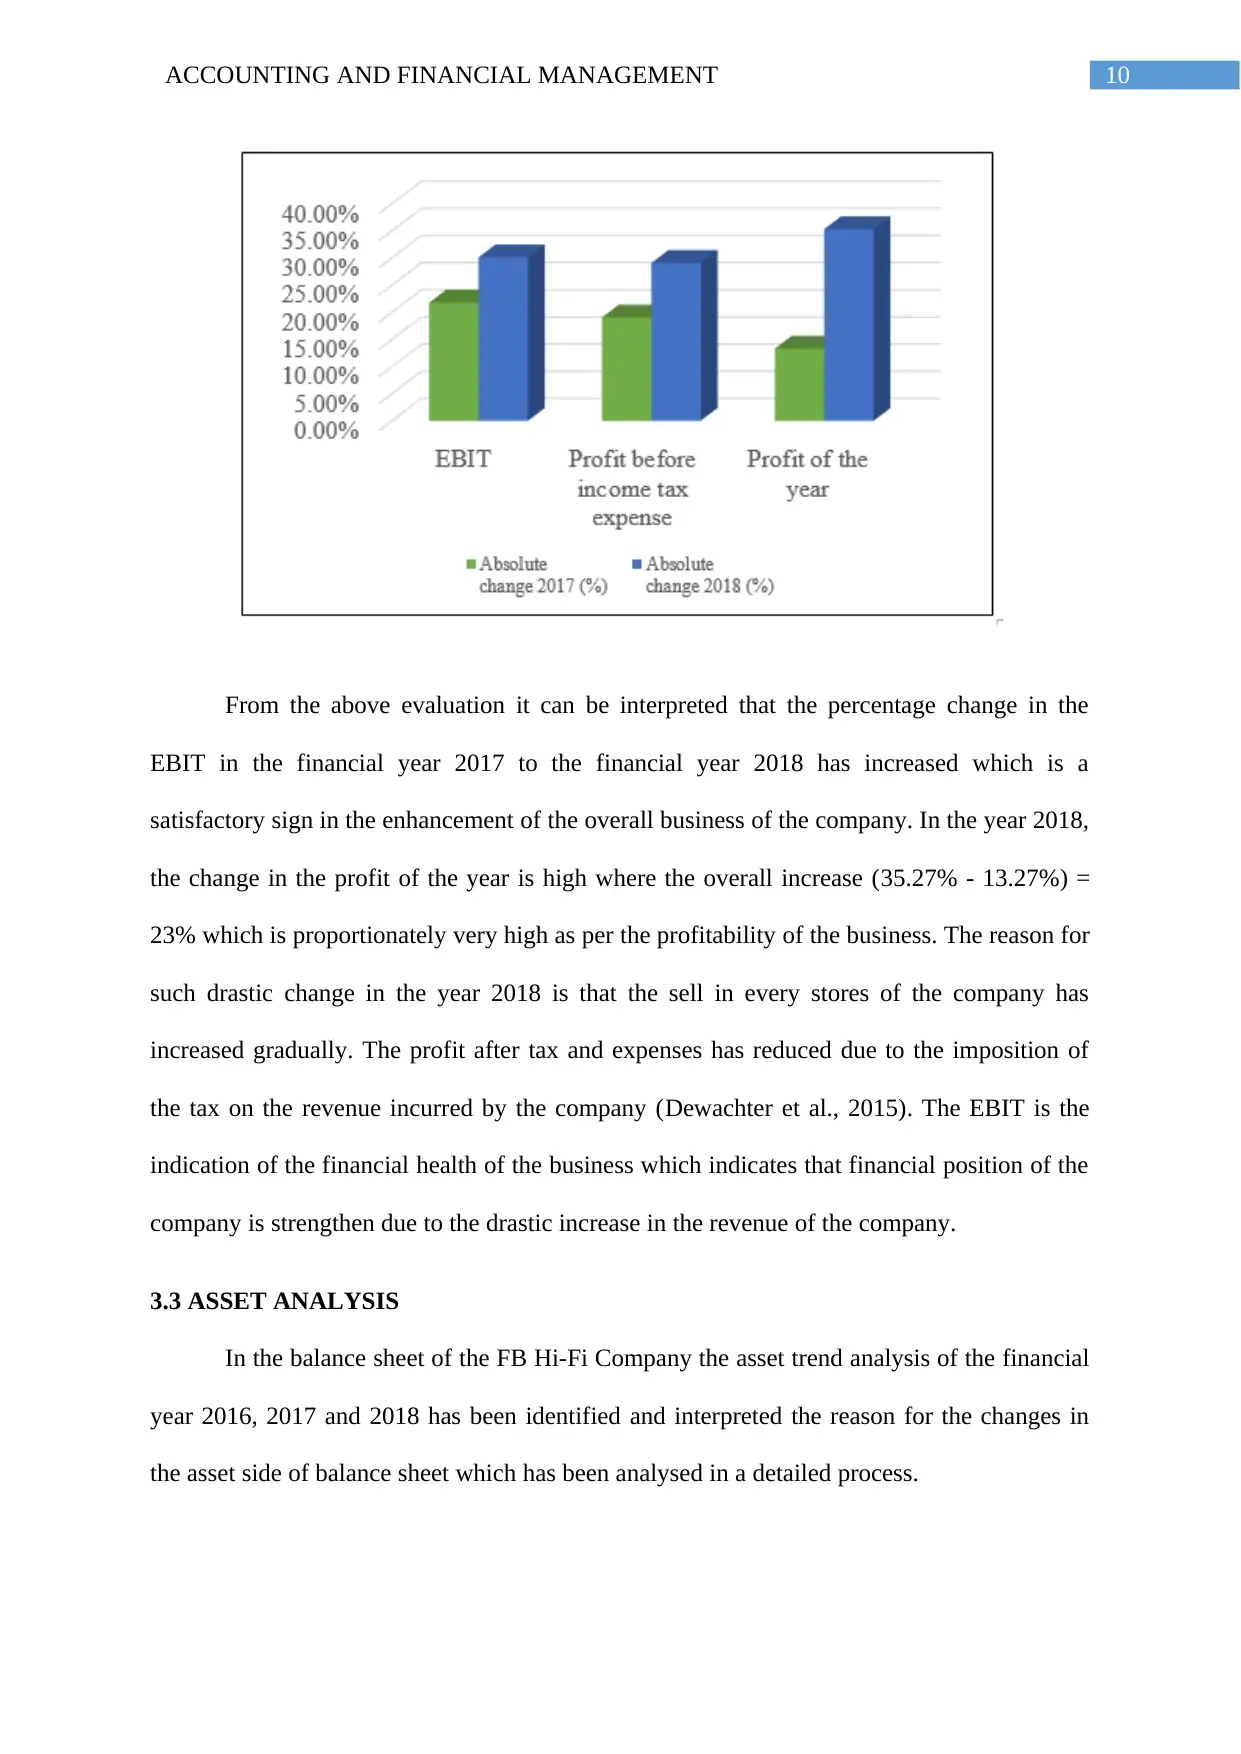
From the above evaluation it can be interpreted that the percentage change in the
EBIT in the financial year 2017 to the financial year 2018 has increased which is a
satisfactory sign in the enhancement of the overall business of the company. In the year 2018,
the change in the profit of the year is high where the overall increase (35.27% - 13.27%) =
23% which is proportionately very high as per the profitability of the business. The reason for
such drastic change in the year 2018 is that the sell in every stores of the company has
increased gradually. The profit after tax and expenses has reduced due to the imposition of
the tax on the revenue incurred by the company (Dewachter et al., 2015). The EBIT is the
indication of the financial health of the business which indicates that financial position of the
company is strengthen due to the drastic increase in the revenue of the company.
3.3 ASSET ANALYSIS
In the balance sheet of the FB Hi-Fi Company the asset trend analysis of the financial
year 2016, 2017 and 2018 has been identified and interpreted the reason for the changes in
the asset side of balance sheet which has been analysed in a detailed process.
11ACCOUNTING AND FINANCIAL MANAGEMENT
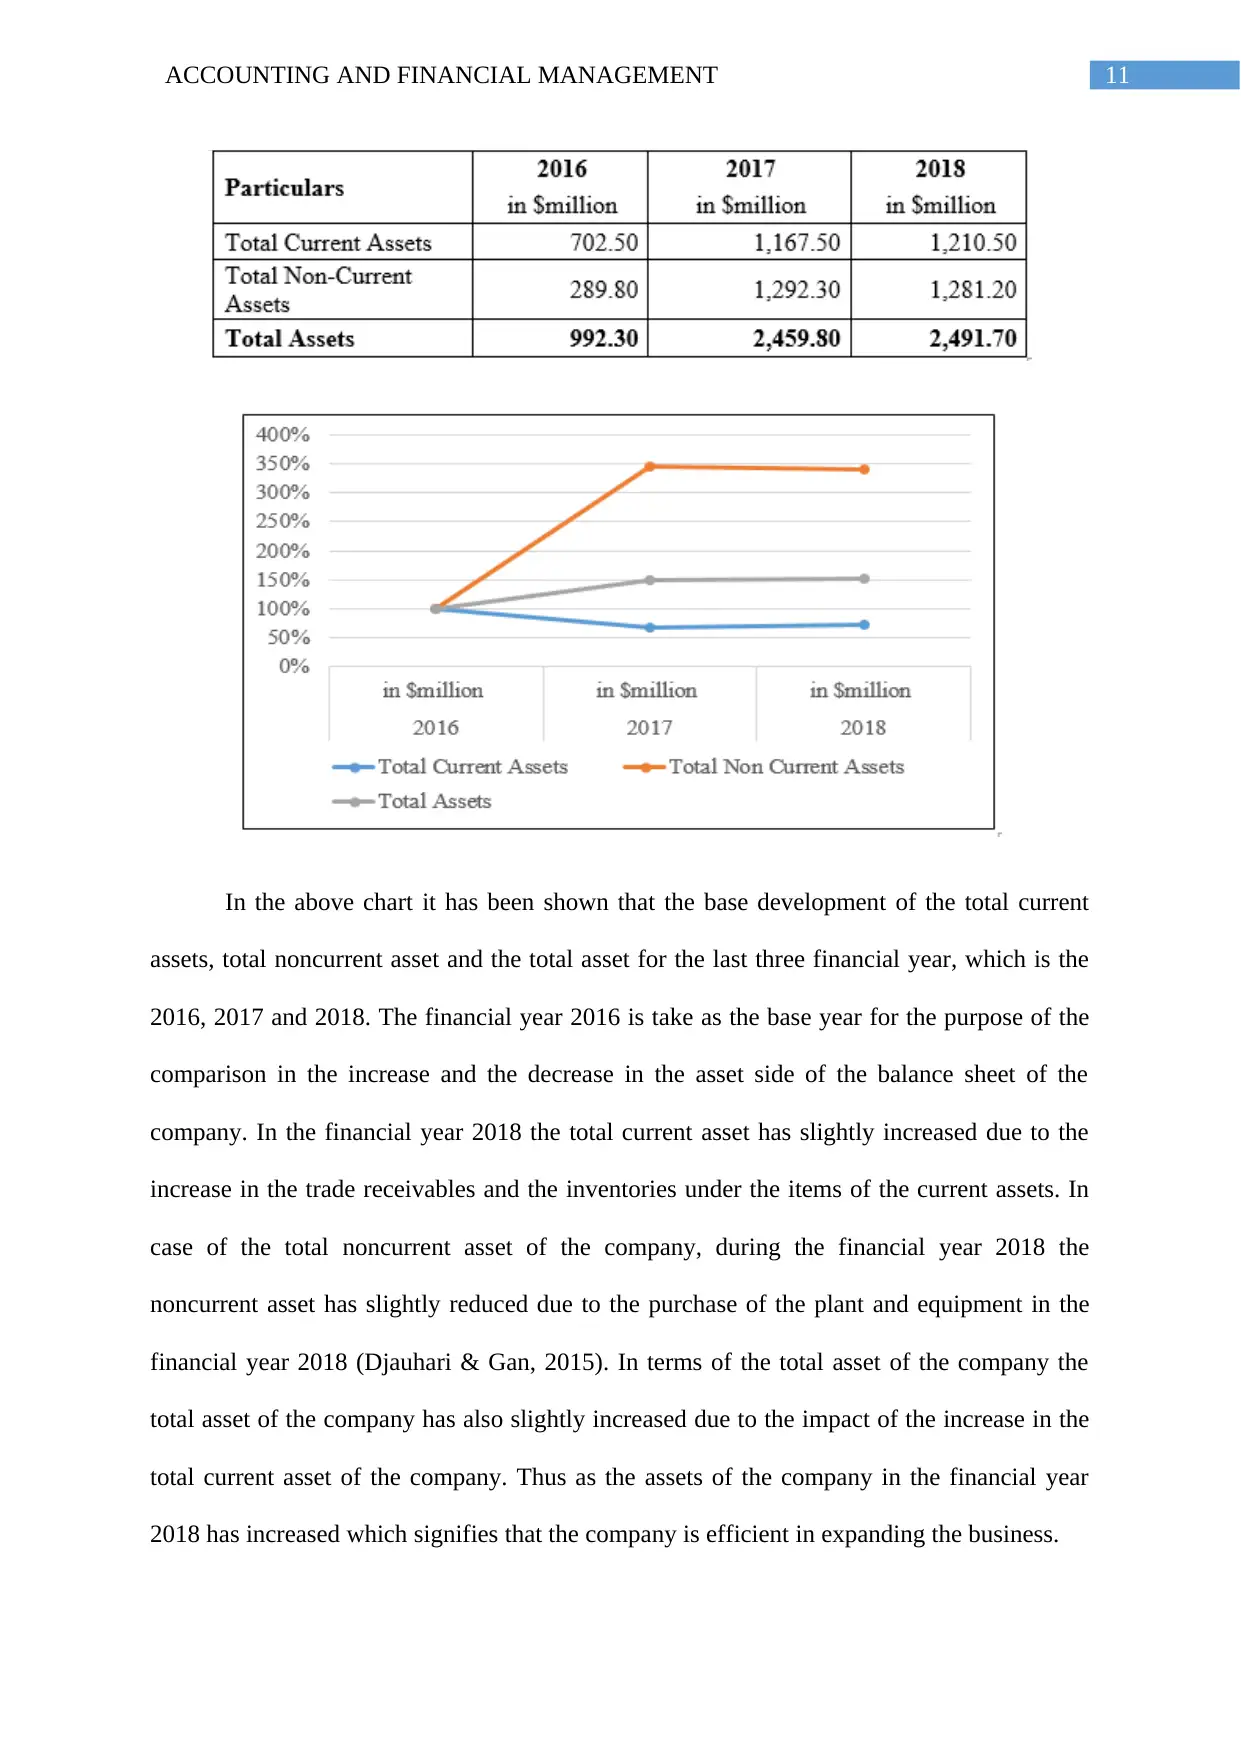
In the above chart it has been shown that the base development of the total current
assets, total noncurrent asset and the total asset for the last three financial year, which is the
2016, 2017 and 2018. The financial year 2016 is take as the base year for the purpose of the
comparison in the increase and the decrease in the asset side of the balance sheet of the
company. In the financial year 2018 the total current asset has slightly increased due to the
increase in the trade receivables and the inventories under the items of the current assets. In
case of the total noncurrent asset of the company, during the financial year 2018 the
noncurrent asset has slightly reduced due to the purchase of the plant and equipment in the
financial year 2018 (Djauhari & Gan, 2015). In terms of the total asset of the company the
total asset of the company has also slightly increased due to the impact of the increase in the
total current asset of the company. Thus as the assets of the company in the financial year
2018 has increased which signifies that the company is efficient in expanding the business.
⊘ This is a preview!⊘
Do you want full access?
Subscribe today to unlock all pages.
Trusted by 1+ million students worldwide
1 out of 25
Related Documents


Your All-in-One AI-Powered Toolkit for Academic Success.
+13062052269
info@desklib.com
Available 24*7 on WhatsApp / Email
![[object Object]](/_next/static/media/star-bottom.7253800d.svg)
Unlock your academic potential
Copyright © 2020–2025 A2Z Services. All Rights Reserved. Developed and managed by ZUCOL.