Accounting Assignment
VerifiedAdded on 2023/06/15
|7
|1625
|160
AI Summary
This Accounting Assignment includes solved questions in excel file, Cost-Volume-profit Graph, Break-even point, Quality of Income, Income over cash flow from operations, AAP's financial metrics and comparing performance measures.
Contribute Materials
Your contribution can guide someone’s learning journey. Share your
documents today.
Running Head: ACCOUNTING ASSIGNMENT
Accounting
Accounting
Secure Best Marks with AI Grader
Need help grading? Try our AI Grader for instant feedback on your assignments.
Accounting Assignment 1
Part 1
Question 1-4 solved in excel file
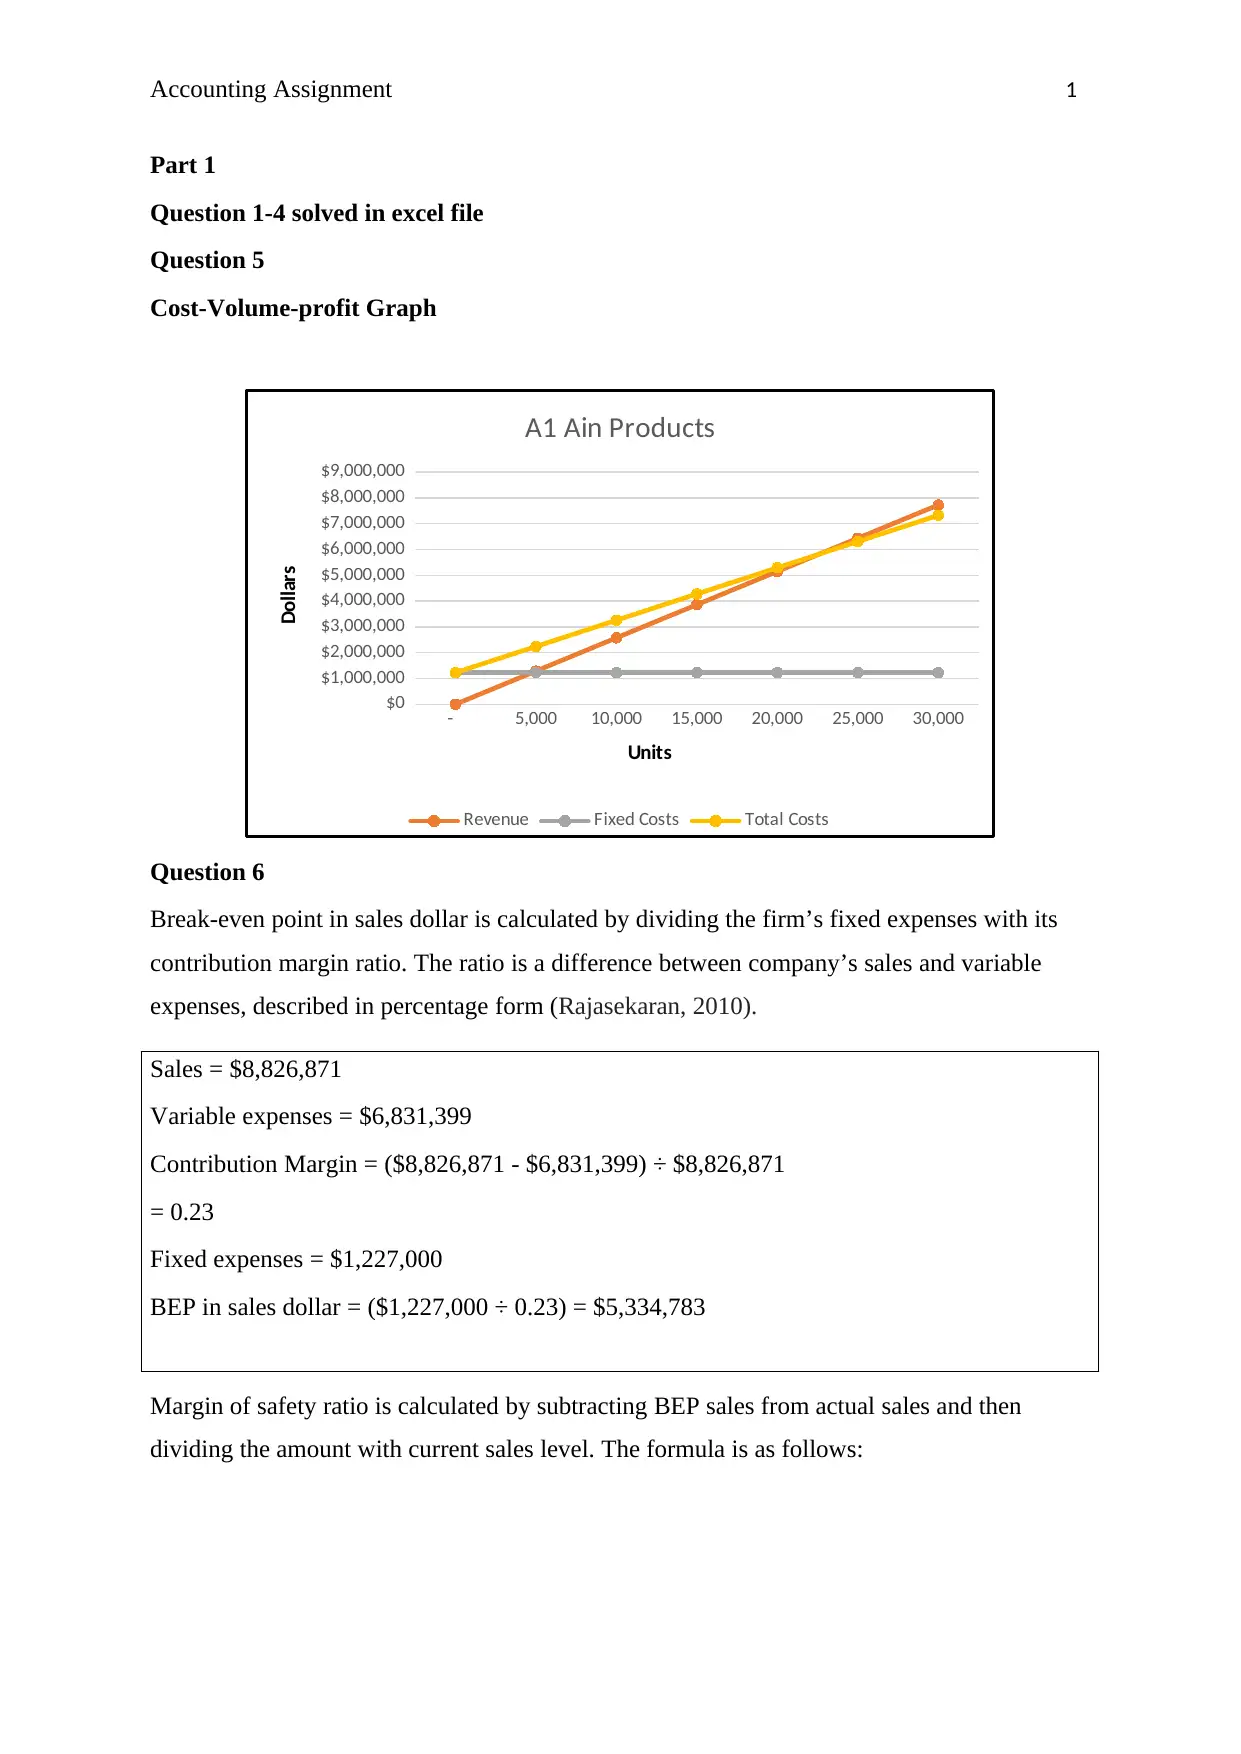
Question 5
Cost-Volume-profit Graph
- 5,000 10,000 15,000 20,000 25,000 30,000
$0
$1,000,000
$2,000,000
$3,000,000
$4,000,000
$5,000,000
$6,000,000
$7,000,000
$8,000,000
$9,000,000
A1 Ain Products
Revenue Fixed Costs Total Costs
Units
Dollars
Question 6
Break-even point in sales dollar is calculated by dividing the firm’s fixed expenses with its
contribution margin ratio. The ratio is a difference between company’s sales and variable
expenses, described in percentage form (Rajasekaran, 2010).
Sales = $8,826,871
Variable expenses = $6,831,399
Contribution Margin = ($8,826,871 - $6,831,399) ÷ $8,826,871
= 0.23
Fixed expenses = $1,227,000
BEP in sales dollar = ($1,227,000 ÷ 0.23) = $5,334,783
Margin of safety ratio is calculated by subtracting BEP sales from actual sales and then
dividing the amount with current sales level. The formula is as follows:
Part 1
Question 1-4 solved in excel file
Question 5
Cost-Volume-profit Graph
- 5,000 10,000 15,000 20,000 25,000 30,000
$0
$1,000,000
$2,000,000
$3,000,000
$4,000,000
$5,000,000
$6,000,000
$7,000,000
$8,000,000
$9,000,000
A1 Ain Products
Revenue Fixed Costs Total Costs
Units
Dollars
Question 6
Break-even point in sales dollar is calculated by dividing the firm’s fixed expenses with its
contribution margin ratio. The ratio is a difference between company’s sales and variable
expenses, described in percentage form (Rajasekaran, 2010).
Sales = $8,826,871
Variable expenses = $6,831,399
Contribution Margin = ($8,826,871 - $6,831,399) ÷ $8,826,871
= 0.23
Fixed expenses = $1,227,000
BEP in sales dollar = ($1,227,000 ÷ 0.23) = $5,334,783
Margin of safety ratio is calculated by subtracting BEP sales from actual sales and then
dividing the amount with current sales level. The formula is as follows:
Accounting Assignment 2
Actual sales−BEP sales
Actual sales X 10 0
Actual sales = $8,826,871
BEP sales = $5,334,783
MOS = [($8,826,871 - $5,334,783) ÷ $8,826,871]
= 0.40 * 100 = 40%
Question 7
(a) Quality of Income
It is a concept related to the earning quality. It is basically a ratio which measures the
performance of business’s earnings. It generally indicate that how accurately, the earnings
measures the value of company and reflect about is future financial performance. It is very
important to determine the quality of earnings because different companies uses different
methods to report their earnings (Kimmel, Weygandt and Kieso, 2010). Although it can be
measured in several ways, but most commonly used is ratio analysis. The quality of income
ratio is:
Operatingcash flow
Net income
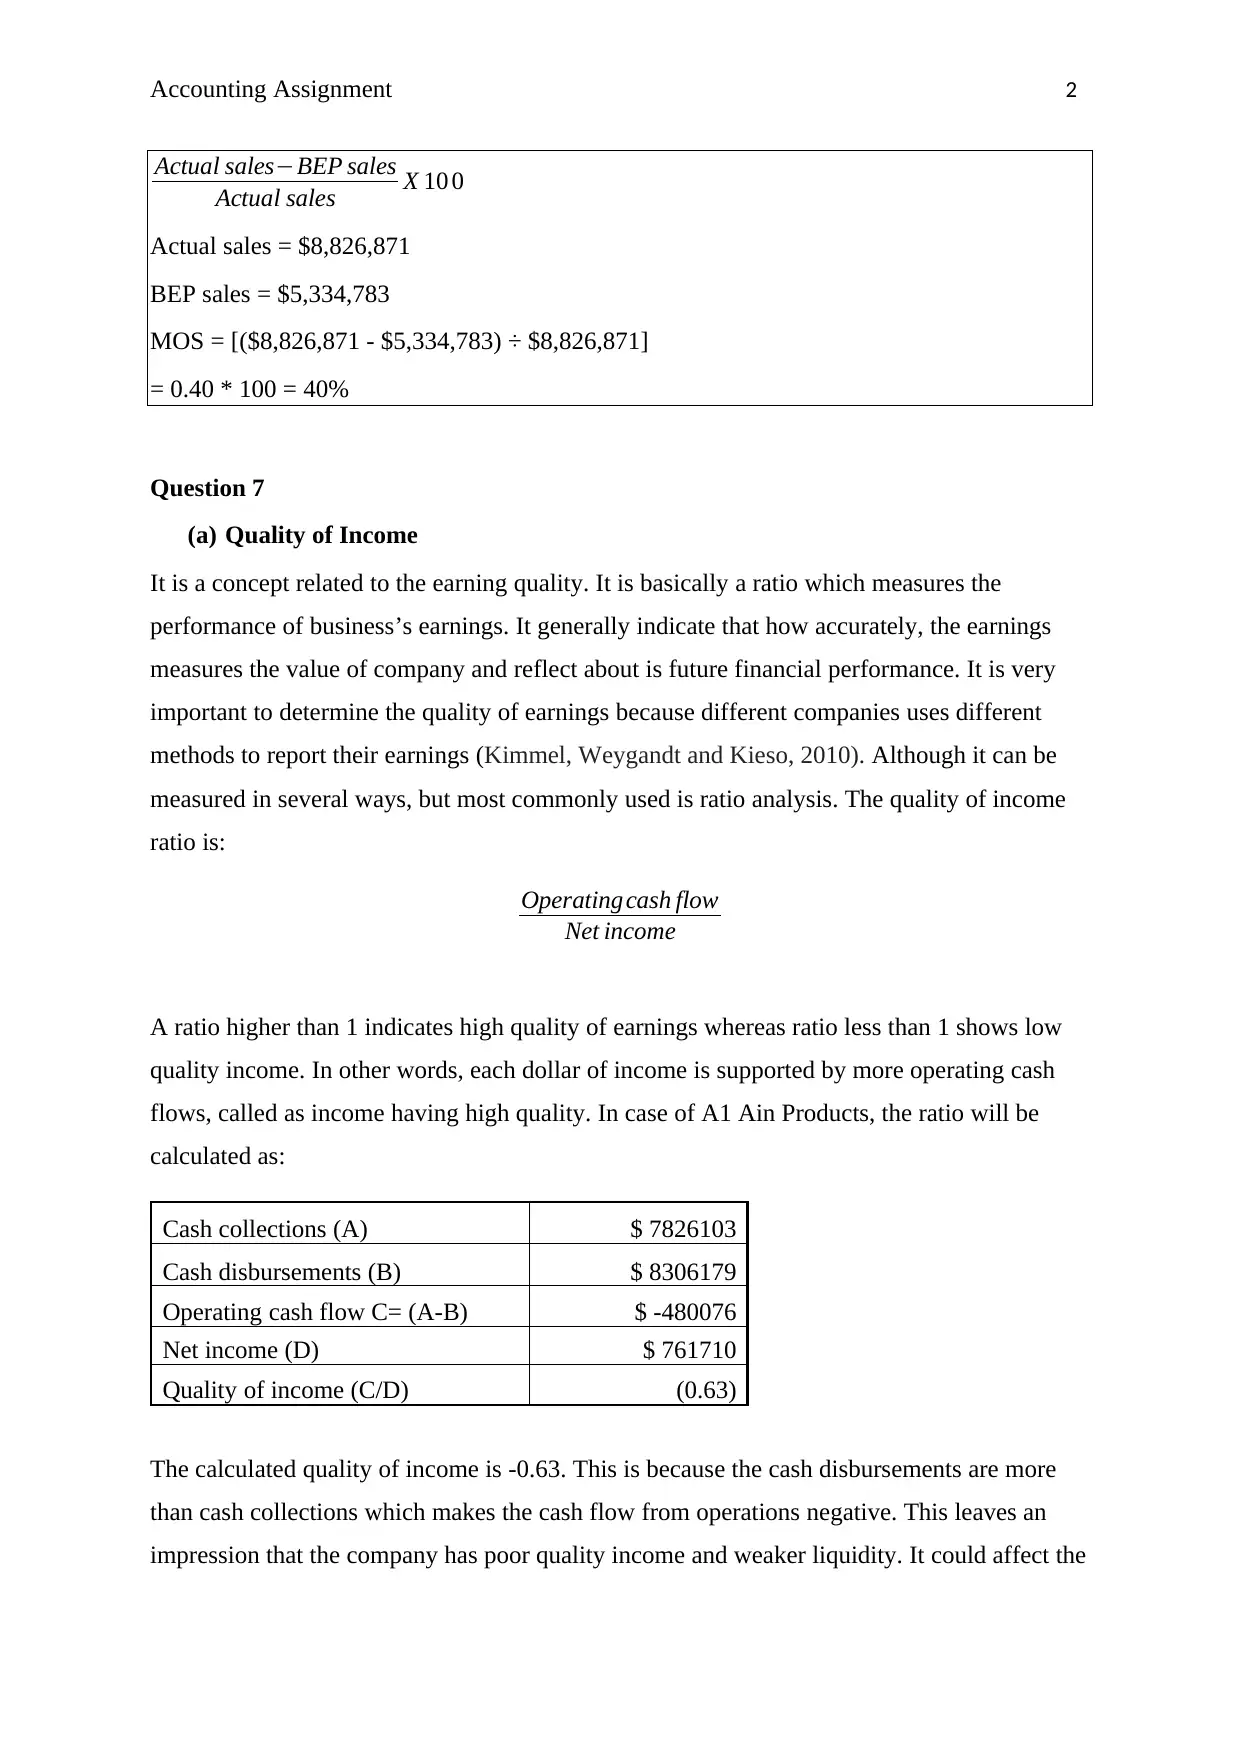
A ratio higher than 1 indicates high quality of earnings whereas ratio less than 1 shows low
quality income. In other words, each dollar of income is supported by more operating cash
flows, called as income having high quality. In case of A1 Ain Products, the ratio will be
calculated as:
Cash collections (A) $ 7826103
Cash disbursements (B) $ 8306179
Operating cash flow C= (A-B) $ -480076
Net income (D) $ 761710
Quality of income (C/D) (0.63)
The calculated quality of income is -0.63. This is because the cash disbursements are more
than cash collections which makes the cash flow from operations negative. This leaves an
impression that the company has poor quality income and weaker liquidity. It could affect the
Actual sales−BEP sales
Actual sales X 10 0
Actual sales = $8,826,871
BEP sales = $5,334,783
MOS = [($8,826,871 - $5,334,783) ÷ $8,826,871]
= 0.40 * 100 = 40%
Question 7
(a) Quality of Income
It is a concept related to the earning quality. It is basically a ratio which measures the
performance of business’s earnings. It generally indicate that how accurately, the earnings
measures the value of company and reflect about is future financial performance. It is very
important to determine the quality of earnings because different companies uses different
methods to report their earnings (Kimmel, Weygandt and Kieso, 2010). Although it can be
measured in several ways, but most commonly used is ratio analysis. The quality of income
ratio is:
Operatingcash flow
Net income
A ratio higher than 1 indicates high quality of earnings whereas ratio less than 1 shows low
quality income. In other words, each dollar of income is supported by more operating cash
flows, called as income having high quality. In case of A1 Ain Products, the ratio will be
calculated as:
Cash collections (A) $ 7826103
Cash disbursements (B) $ 8306179
Operating cash flow C= (A-B) $ -480076
Net income (D) $ 761710
Quality of income (C/D) (0.63)
The calculated quality of income is -0.63. This is because the cash disbursements are more
than cash collections which makes the cash flow from operations negative. This leaves an
impression that the company has poor quality income and weaker liquidity. It could affect the
Accounting Assignment 3
firm’s financial position to a great extent in future and also its shareholders. The earnings are
not able to generate positive cash flow, which may lead to insolvency in future.
(b) Income over cash flow from operations
Cash flow inflow and outflow of cash in a business. It identifies the amount of cash used and
generated by three kind of business activities known as operating, investing and financing
activities. A company may have highest profits but still can get out of cash due to poor cash
flow (Periasamy, 2009). Net income is basically an accounting difference between the total
revenue and total expense of the firm. It is calculated by subtracting the total expenditure
from total revenue. It is generally known as profit and show the position of company’s
profitability (Knight, 2012).
As far as AAP is concerned, its cash flow from operations is negative that is $ -480076 and
its net income is positive that is $ 761710. This shows that the net income or profit earned is
higher than the cash flow. Reason behind this is lower inventory and higher accounts
receivables at the end, as compared to both the industry average and key competitors. This
raises the probability of making improvements in inventory management and cash
conversions.
The main three components of working capital are accounts receivables, inventories and
accounts payable. Looking at the cash flow statement of A1 Ain Products from external
format, it can be said that company is not using the cash effectively in all these three areas
(Sagner, 2010). The accounts receivables has been increased during the three months which
indicates that company is not timely collecting cash from its debtors. On the other hand,
amount of inventory has also boosted up which reflects that AAP is holding a lot of cash in
its inventory and also have a poor inventory management system. An increase is also noticed
in the accounts payable known as creditors. This is because company’s operations does not
generate enough cash, to set off the creditors. Moreover, its cash collections are also less than
its cash disbursements. All this shows that, AAP may not be effectively using cash in its
business.
Question 8
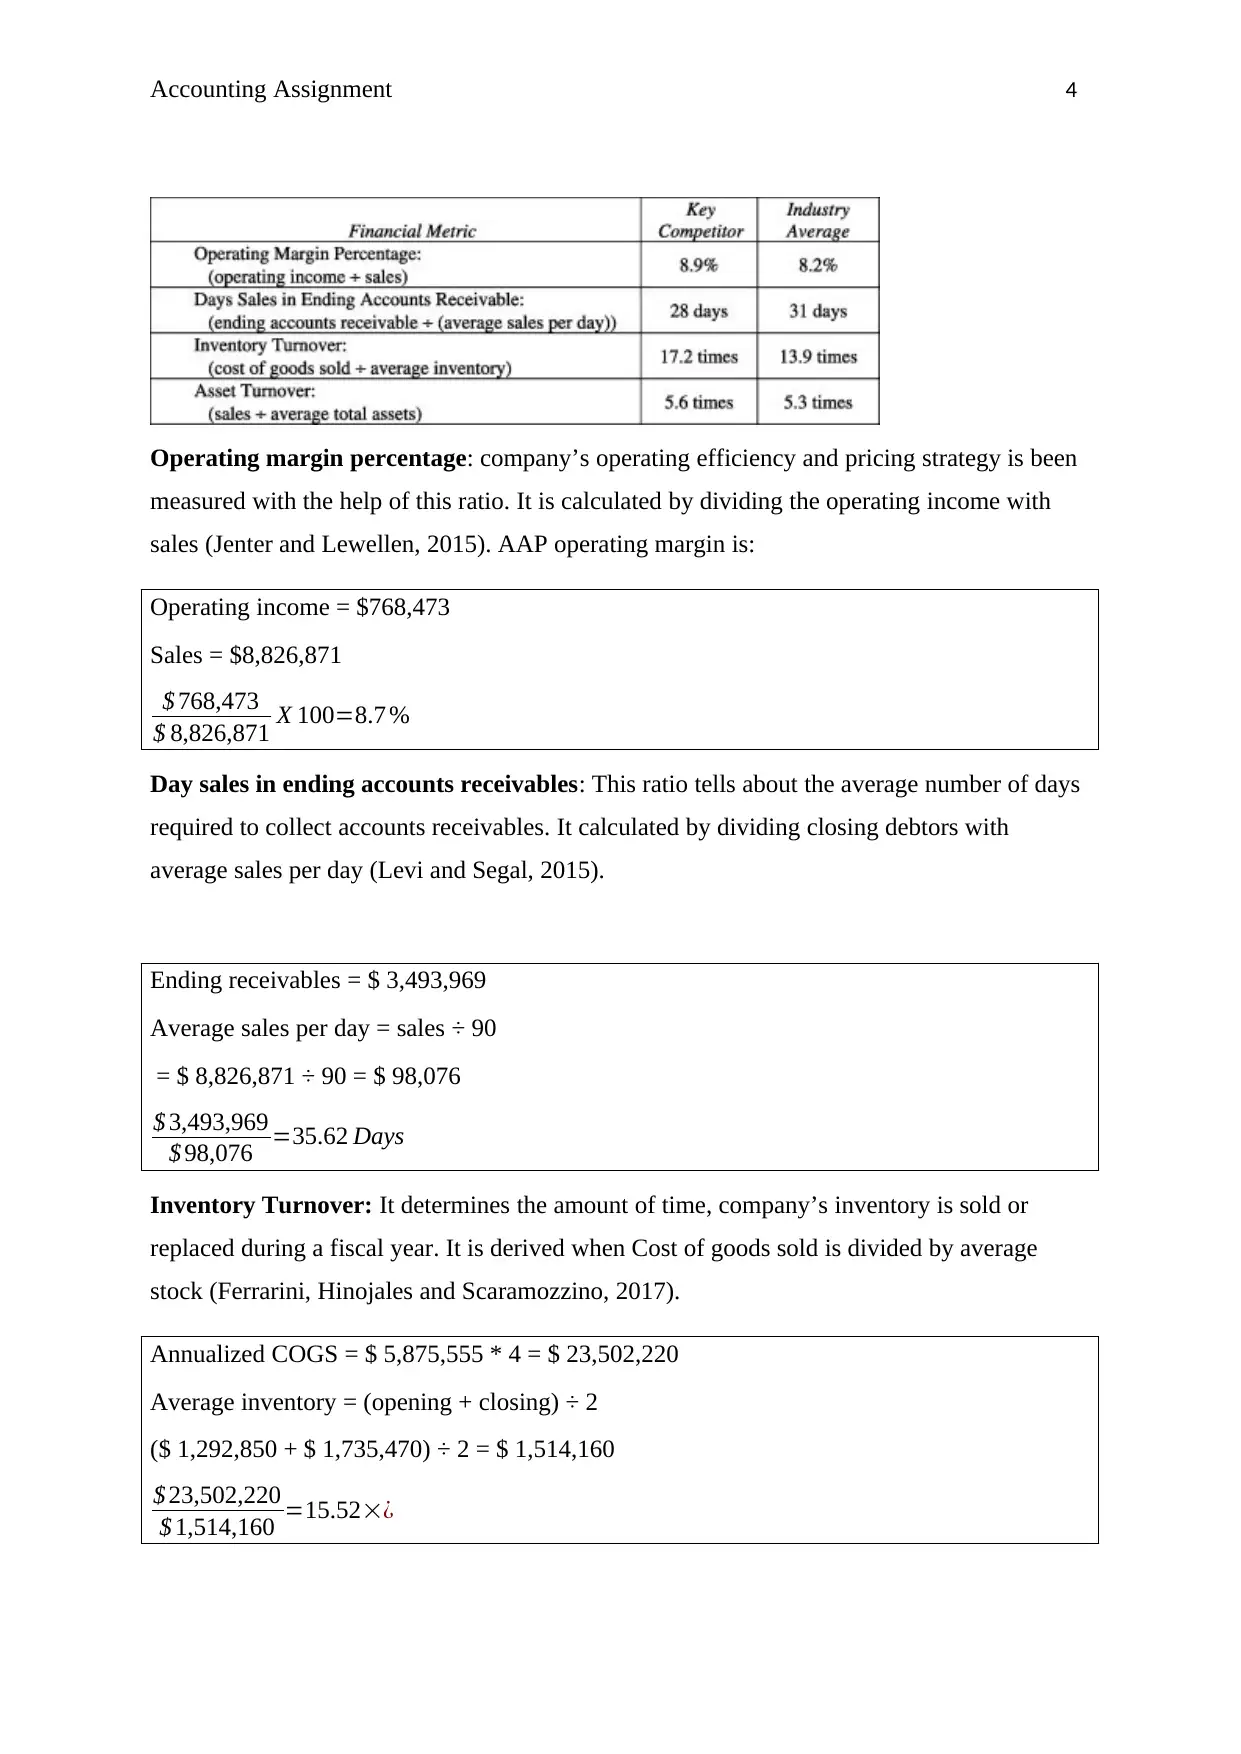
(a) AAP’s financial metrics
According to the review of benchmarking data provided, the financial metrics of AAP for the
projected quarter is been calculated. These are as follows:
firm’s financial position to a great extent in future and also its shareholders. The earnings are
not able to generate positive cash flow, which may lead to insolvency in future.
(b) Income over cash flow from operations
Cash flow inflow and outflow of cash in a business. It identifies the amount of cash used and
generated by three kind of business activities known as operating, investing and financing
activities. A company may have highest profits but still can get out of cash due to poor cash
flow (Periasamy, 2009). Net income is basically an accounting difference between the total
revenue and total expense of the firm. It is calculated by subtracting the total expenditure
from total revenue. It is generally known as profit and show the position of company’s
profitability (Knight, 2012).
As far as AAP is concerned, its cash flow from operations is negative that is $ -480076 and
its net income is positive that is $ 761710. This shows that the net income or profit earned is
higher than the cash flow. Reason behind this is lower inventory and higher accounts
receivables at the end, as compared to both the industry average and key competitors. This
raises the probability of making improvements in inventory management and cash
conversions.
The main three components of working capital are accounts receivables, inventories and
accounts payable. Looking at the cash flow statement of A1 Ain Products from external
format, it can be said that company is not using the cash effectively in all these three areas
(Sagner, 2010). The accounts receivables has been increased during the three months which
indicates that company is not timely collecting cash from its debtors. On the other hand,
amount of inventory has also boosted up which reflects that AAP is holding a lot of cash in
its inventory and also have a poor inventory management system. An increase is also noticed
in the accounts payable known as creditors. This is because company’s operations does not
generate enough cash, to set off the creditors. Moreover, its cash collections are also less than
its cash disbursements. All this shows that, AAP may not be effectively using cash in its
business.
Question 8
(a) AAP’s financial metrics
According to the review of benchmarking data provided, the financial metrics of AAP for the
projected quarter is been calculated. These are as follows:
Secure Best Marks with AI Grader
Need help grading? Try our AI Grader for instant feedback on your assignments.
Accounting Assignment 4
Operating margin percentage: company’s operating efficiency and pricing strategy is been
measured with the help of this ratio. It is calculated by dividing the operating income with
sales (Jenter and Lewellen, 2015). AAP operating margin is:
Operating income = $768,473
Sales = $8,826,871
$ 768,473
$ 8,826,871 X 100=8.7 %
Day sales in ending accounts receivables: This ratio tells about the average number of days
required to collect accounts receivables. It calculated by dividing closing debtors with
average sales per day (Levi and Segal, 2015).
Ending receivables = $ 3,493,969
Average sales per day = sales ÷ 90
= $ 8,826,871 ÷ 90 = $ 98,076
$ 3,493,969
$ 98,076 =35.62 Days
Inventory Turnover: It determines the amount of time, company’s inventory is sold or
replaced during a fiscal year. It is derived when Cost of goods sold is divided by average
stock (Ferrarini, Hinojales and Scaramozzino, 2017).
Annualized COGS = $ 5,875,555 * 4 = $ 23,502,220
Average inventory = (opening + closing) ÷ 2
($ 1,292,850 + $ 1,735,470) ÷ 2 = $ 1,514,160
$ 23,502,220
$ 1,514,160 =15.52׿
Accounting Assignment 5
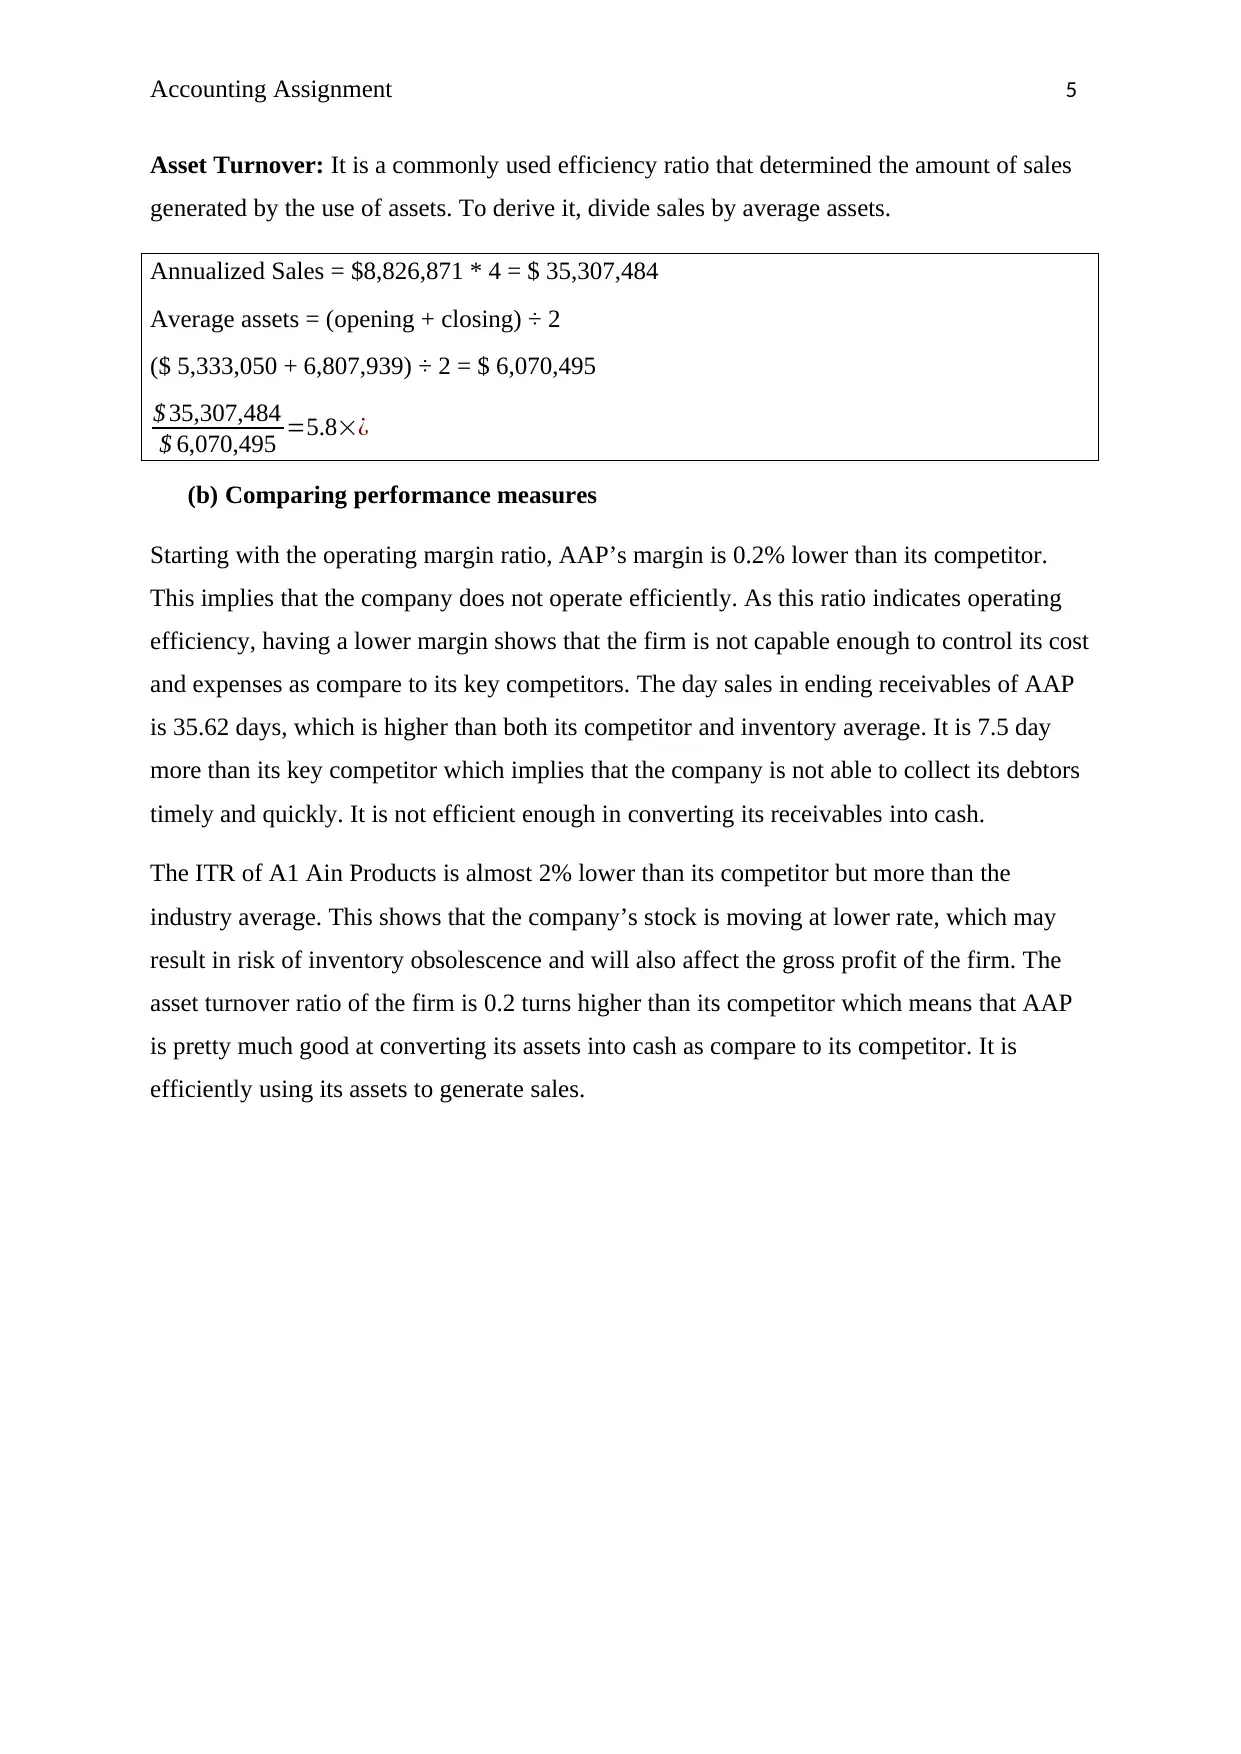
Asset Turnover: It is a commonly used efficiency ratio that determined the amount of sales
generated by the use of assets. To derive it, divide sales by average assets.
Annualized Sales = $8,826,871 * 4 = $ 35,307,484
Average assets = (opening + closing) ÷ 2
($ 5,333,050 + 6,807,939) ÷ 2 = $ 6,070,495
$ 35,307,484
$ 6,070,495 =5.8׿
(b) Comparing performance measures
Starting with the operating margin ratio, AAP’s margin is 0.2% lower than its competitor.
This implies that the company does not operate efficiently. As this ratio indicates operating
efficiency, having a lower margin shows that the firm is not capable enough to control its cost
and expenses as compare to its key competitors. The day sales in ending receivables of AAP
is 35.62 days, which is higher than both its competitor and inventory average. It is 7.5 day
more than its key competitor which implies that the company is not able to collect its debtors
timely and quickly. It is not efficient enough in converting its receivables into cash.
The ITR of A1 Ain Products is almost 2% lower than its competitor but more than the
industry average. This shows that the company’s stock is moving at lower rate, which may
result in risk of inventory obsolescence and will also affect the gross profit of the firm. The
asset turnover ratio of the firm is 0.2 turns higher than its competitor which means that AAP
is pretty much good at converting its assets into cash as compare to its competitor. It is
efficiently using its assets to generate sales.
Accounting Assignment 6
References
Ferrarini, B., Hinojales, M. and Scaramozzino, P. 2017. Leverage and Capital Structure
Determinants of Chinese Listed Companies.
Jenter, D. and Lewellen, K. 2015. CEO preferences and acquisitions. The Journal of
Finance, 70(6), pp.2813-2852.
Kimmel, P.D., Weygandt, J.J. and Kieso, D.E., 2010. Financial accounting: tools for
business decision making. John Wiley & Sons.
Knight, F.H., 2012. Risk, uncertainty and profit. Courier Corporation.
Levi, S. and Segal, B. 2015. The Impact of Debt-Equity Reporting Classifications on the
Firm's Decision to Issue Hybrid Securities. European Accounting Review, 24(4), pp.801-822.
Periasamy, P. 2009. Financial Management. 2nd ed. New Delhi: Tata McGraw-Hill
Education Pvt. Ltd.
Rajasekaran, V., 2010. Cost accounting. Pearson Education India.
Sagner, J., 2010. Essentials of working capital management(Vol. 55). John Wiley & Sons.
1 out of 7
Related Documents


Your All-in-One AI-Powered Toolkit for Academic Success.
+13062052269
info@desklib.com
Available 24*7 on WhatsApp / Email
![[object Object]](/_next/static/media/star-bottom.7253800d.svg)
Unlock your academic potential
© 2024 | Zucol Services PVT LTD | All rights reserved.