Financial Ratio Analysis of Restaurant Business for 2008-2010

Verified

Added on  2020/05/16

|4
|391
|177
Report
AI Summary
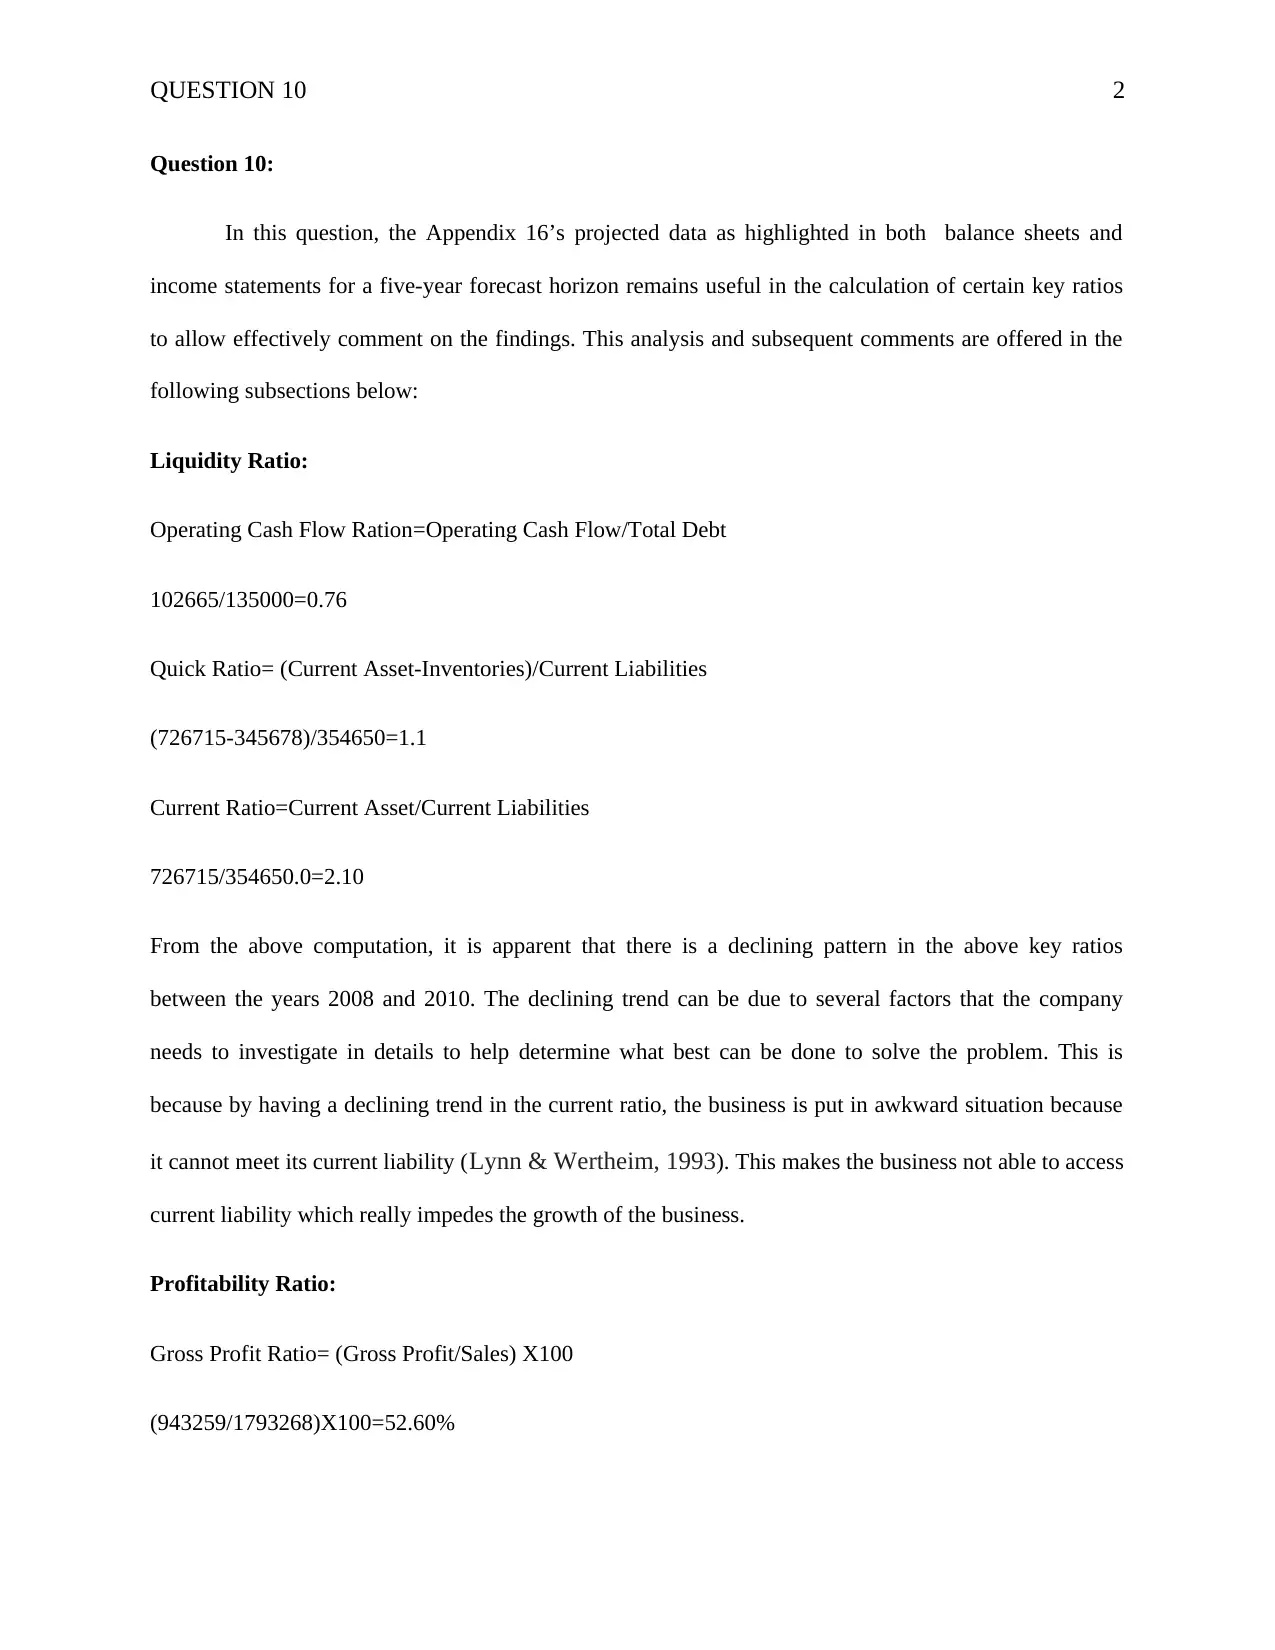
This report presents a financial ratio analysis of a restaurant business, focusing on the years 2008 to 2010. The analysis includes the calculation and interpretation of key financial ratios, specifically liquidity ratios (Operating Cash Flow Ratio, Quick Ratio, and Current Ratio) and profitability ratios (Gross Profit Ratio). The report highlights trends and patterns in these ratios, such as a declining trend in liquidity ratios and fluctuations in the gross profit ratio. The analysis aims to assess the restaurant's financial performance, its ability to meet current liabilities, and its overall financial health. References to relevant academic literature are included to support the findings and interpretations. The report concludes by discussing the implications of these ratios on the restaurant's ability to expand and manage its expenses effectively.
Document Page
Running head: QUESTION 10 1
Question 10
Name
Institution
tabler-icon-diamond-filled.svg

Paraphrase This Document

Need a fresh take? Get an instant paraphrase of this document with our AI Paraphraser
Document Page
QUESTION 10 2
Question 10:
In this question, the Appendix 16’s projected data as highlighted in both balance sheets and
income statements for a five-year forecast horizon remains useful in the calculation of certain key ratios
to allow effectively comment on the findings. This analysis and subsequent comments are offered in the
following subsections below:
Liquidity Ratio:
Operating Cash Flow Ration=Operating Cash Flow/Total Debt
102665/135000=0.76
Quick Ratio= (Current Asset-Inventories)/Current Liabilities
(726715-345678)/354650=1.1
Current Ratio=Current Asset/Current Liabilities
726715/354650.0=2.10
From the above computation, it is apparent that there is a declining pattern in the above key ratios
between the years 2008 and 2010. The declining trend can be due to several factors that the company
needs to investigate in details to help determine what best can be done to solve the problem. This is
because by having a declining trend in the current ratio, the business is put in awkward situation because
it cannot meet its current liability (Lynn & Wertheim, 1993). This makes the business not able to access
current liability which really impedes the growth of the business.
Profitability Ratio:
Gross Profit Ratio= (Gross Profit/Sales) X100
(943259/1793268)X100=52.60%
Document Page
QUESTION 10 3
As seen in the above computation, the GP ratio has increased between years 2008 and 2010 from
52 percent to 53.60 percent. On the other hand, this has been a decrease to 52.6 percent between the years
2008 and 2010. There is also a diminishing pattern between the years in 2009 and 2010. This means that
the business has fared well on average as compared to the average industry values. The restaurant can pay
its current liabilities based on the current ratio (Lewellen, 2004). Thus, the fir, can easily expand thus
meeting its expenses.
Document Page
QUESTION 10 4
References
Lewellen, J. (2004). Predicting returns with financial ratios. Journal of Financial
Economics, 74(2), 209-235.
Lynn, M. L., & Wertheim, P. (1993). Key financial ratios can foretell hospital
closures. Healthcare financial management: journal of the Healthcare Financial
Management Association, 47(11), 66-70.
chevron_up_icon
1 out of 4
circle_padding
hide_on_mobile
zoom_out_icon
[object Object]