Financial Performances and Operations in Accounting Capstone

Verified

Added on  2023/03/30

|17
|1027
|94
Presentation
AI Summary
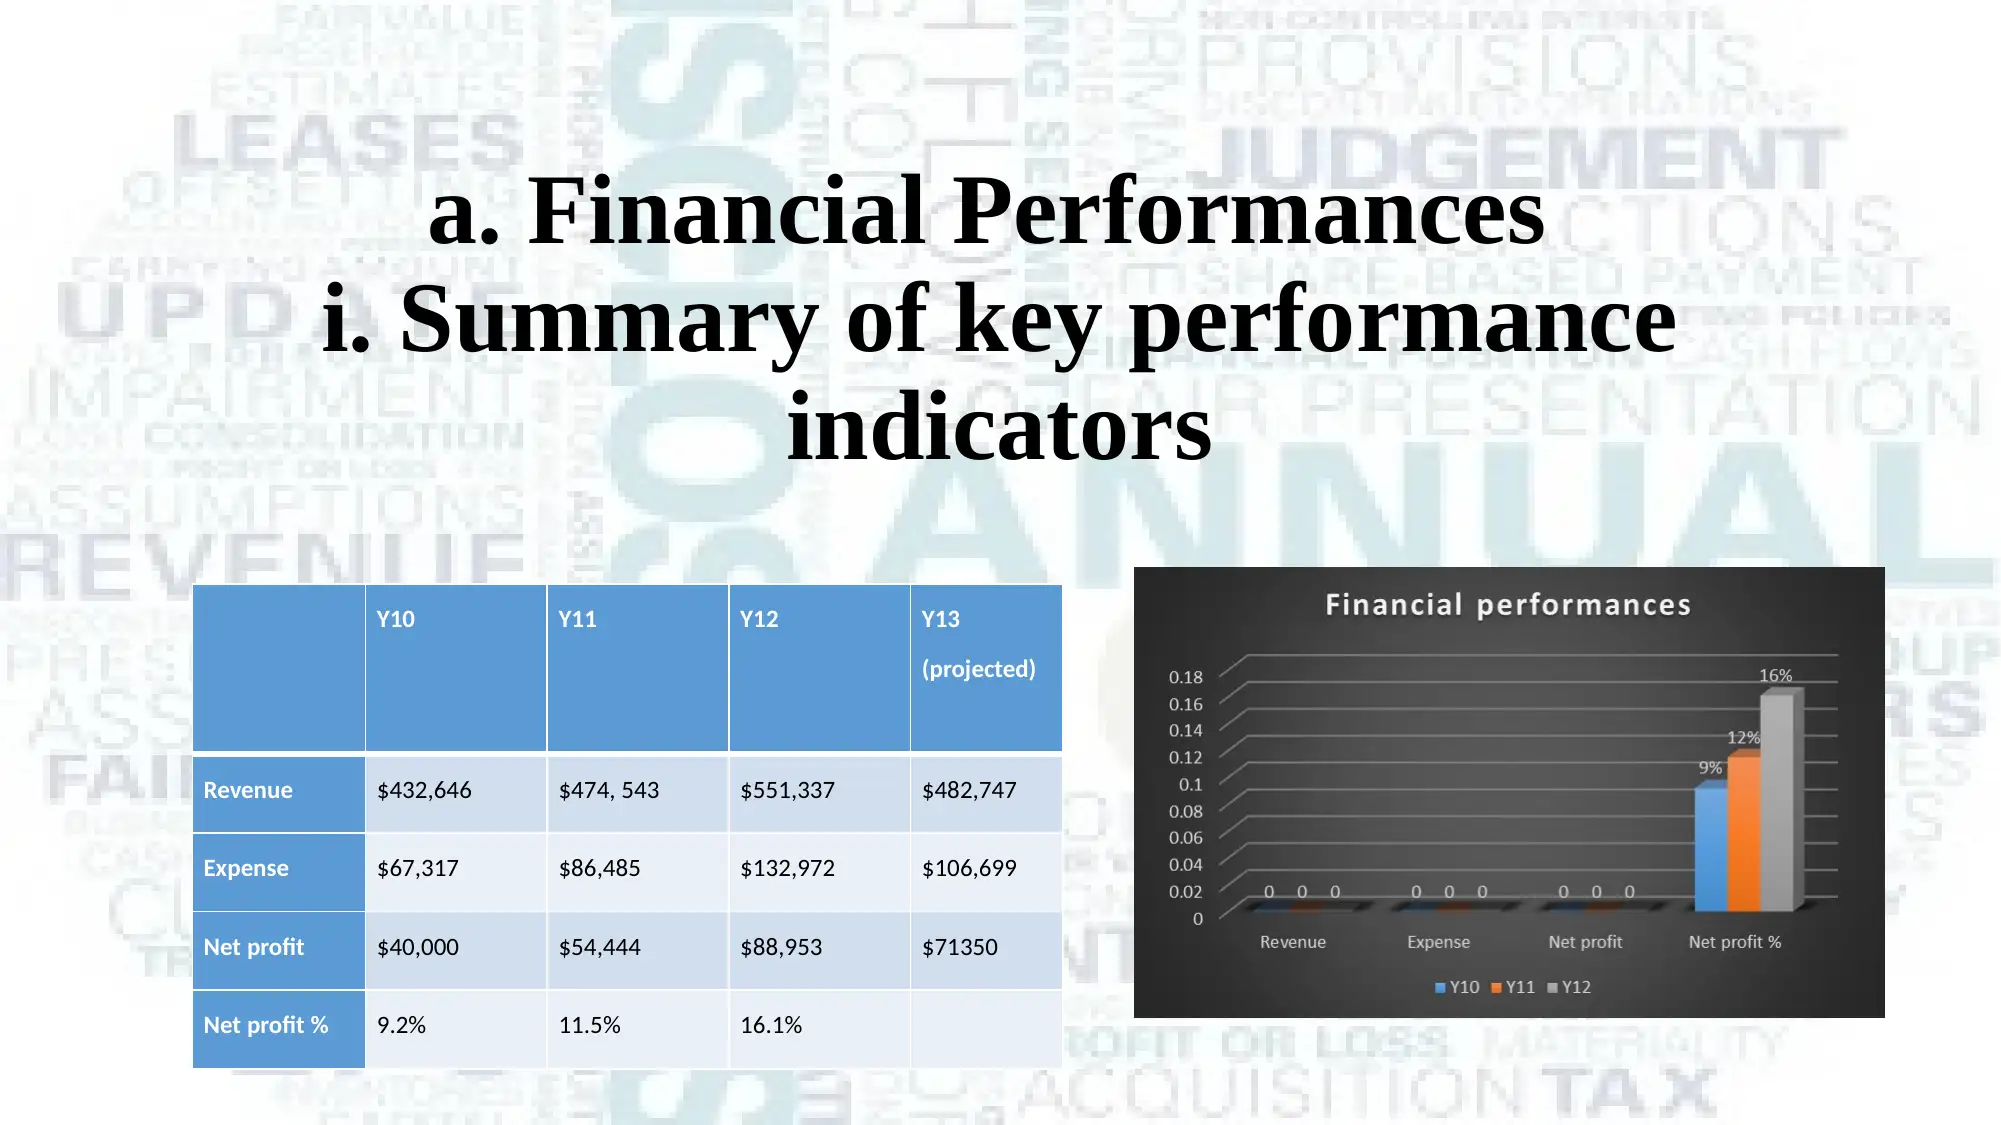
This presentation provides an overview of the financial performances and operations in an accounting capstone project. It includes key performance indicators, ROI, ROE, original targets, revenue analysis, balance sheet effects on ROE, liquidity ratios, cash position, strategies taken, stock and production levels, worker's productivity, capacity upgrades, customer marketing, and resources/learning.
tabler-icon-diamond-filled.svg

Contribute Materials

Your contribution can guide someone’s learning journey. Share your documents today.
Document Page
ACCOUNTING
CAPSTONE
tabler-icon-diamond-filled.svg

Secure Best Marks with AI Grader

Need help grading? Try our AI Grader for instant feedback on your assignments.
Document Page
a. Financial Performances
i. Summary of key performance
indicators
Y10 Y11 Y12 Y13
(projected)
Revenue $432,646 $474, 543 $551,337 $482,747
Expense $67,317 $86,485 $132,972 $106,699
Net profit $40,000 $54,444 $88,953 $71350
Net profit % 9.2% 11.5% 16.1%
Document Page
ii) ROI
The rate of investment will reveal the rate that will definitely give the
amount of profit to the shareholders that will definitely increase the
level of company revenue.
The ROI will give the development of resources and the shares the
economy is giving.
ROI = Net income/cost of investment.
iii) ROE
In Y10, the ROE is weighted to 20
In Y11, the ROE for the F Bhullar shoes is 23 and the same variable is
having ROE in Y12 is 31.
Document Page
iv) Original targets
The company is going to identify the development of original targets.
The target that the company has set in making the budget and
resources distribution.
v) Revenue
The revenue will identify the amount of the income the company is
getting from the market.
The company is mainly getting the amount of revenue both from the
selling of products both in online and offline platform.
Y10 Y11 Y12
Net sales revenue
Revenue from
internet
$90, 315 $90,004 $124,680
Revenue from
wholesale
$314,731 $379,437 $403, 571
tabler-icon-diamond-filled.svg

Secure Best Marks with AI Grader

Need help grading? Try our AI Grader for instant feedback on your assignments.
Document Page
vi) Re balance sheet / financing/share issues, effects on ROE
The company is going to increase the development of resources and
the share of capital and return of equity
On the other hand, the company is making a comparison in all the
years taking the balance sheet into actions.
On the other hand through the increase in balance sheet the effect is
falling heavily on the ROE.
In Y10, the amount of money the company is having is around
$190,000 as the beginners’ equity and the earnings retained is
$20,000.
The total earning that the shareholders earned is around $210,000.
Document Page
vii) Apply some liquidity ratios and analysis, debtors
In the year the Y10, the company is having cash ratio of 2.7.
In Y11, the cash ratio is 3.05 and in the Y12, the cash ratio is 4.73.
The liquidity ratio will automatically increase the probability of the
company to finance the short term debts.
Document Page
viii) Company’s cash position
In Y10, the company is having cash reserve of amount $421,841.
The aim of the company is to increase the level of cash in form of
revenues and other options.
ix) Strategies taken
In order to increase the development of their resources, the company
will be mainly looking to indulge the development of both human and
capital resources.
It is highly important for the company to bring in enough motivation
and enough amount of investment that will definitely increase the
development of better products.
tabler-icon-diamond-filled.svg

Paraphrase This Document

Need a fresh take? Get an instant paraphrase of this document with our AI Paraphraser
Document Page
b. Operations
Document Page
i) Stock level
The company is currently having stocks of around $20, 000 and the
amount of the stocks that are being stored are in the company are
getting returned to the shareholder on the circular way.
ii) Production level
In the Y10, the company has produced about 9156 pairs of shoes.
In the Y11, the company has produced about 9100 pairs of shoes.
Moreover, in Y2, the company is producing 8500 pairs of shoes.
In Y10, the total amount of footwear that are being produced within
the company is mainly looking to incorporate the development of
resources that are being currently allocated to the company.
Document Page
iii) Worker’s productivity
In North America, in both year the worker productivity was around
5000.
in the same year, the productivity of the workers in Asia pacific is 3500.
The employee productivity is not increasing irrespective of the
geographical locations.
iv) Upgrades of capacity required
It is highly important for the company to increase the development of
technologies that will definitely increase the improvement in the
involvement of resources.
Now with the up gradation of technology the company will increase the
employees’ production.
tabler-icon-diamond-filled.svg

Secure Best Marks with AI Grader

Need help grading? Try our AI Grader for instant feedback on your assignments.
Document Page
v) Plant capacity utilised fully or underutilised
In some of areas, the plant capacity has not fully utilised and in some
of the areas, the capability and the actual production rate is 0.
vi) Other comments
The company is highly willing to indulge the improvement in the
economic productivity but in order to increase the development of
resources.
Document Page
c. Customer marketing
Document Page
Y10 Y11 Y12 Y13 (projected)
Sales per region ($) $432,646 $474,574 $534,140 $473,367
Sales per region no 88,200 93151 98254
Pricing average
Internet
Wholesale
Sales per dollar of advertising
spend
Internet $27,277 $24,741 $27,798 $28,154
Wholesale market $29,323 $30,069 $28,769 $28,423
tabler-icon-diamond-filled.svg

Paraphrase This Document

Need a fresh take? Get an instant paraphrase of this document with our AI Paraphraser
Document Page
d. RESOURCES
/LEARNING
Document Page
Y10 Y11 Y12 Y13 (projected)
Number of staff employed 1943 1928 1931 1939
Effect on corporate image
Training strategies and
expenses
937 931 936 940
Document Page
Reference list
Barr, J., & Busler, M. (2017). The Service-Learning Experience in a Capstone Marketing Course: An Empirical
Investigation. International Journal of Business and Social Science, 8(4).
Brands, K., & Lange, L. S. (2016). Teaching Accounting Ethics: Opportunities and Challenges. Journal: Vol, 5(1),
6.
Crespo, P., & Oliveras, E. (2017). Teaching transversal competences in the area of accounting: Fact or
Fiction?. European Accounting and Management Review, 3(2), 65-74.
de Oliveira Neto, J. D., de Sousa Gomes, G., & Titton, L. A. (2017). Using technology driven flipped class to
promote active learning in accounting. Revista Universo Contábil, 13(1), 49-64.
Dieg, M., Duncan, D., Howard, S., Kelley, M., Morrison, A., Rao, P., & Yildirim, A. (2018). Chapala Climate Action
Plan: Capstone Studio.
Griffin, M. (2018). Addressing Skills in an Analytics World: Proposals for the Accounting Department at the
University of Arkansas.
Lotfy, M., & Lindoo, E. (2017). Results of using a contextualized case study in the senior capstone
course. Journal of Computing Sciences in Colleges, 33(2), 59-67.
Nelson, K. (2017). Public vs. Private Accounting: A Guide to Choosing Which Field is Best for You.
Officer, F., & Officer, C. A. (2017). AGS.
Walz, K. A., & Christian, J. R. (2017). Capstone Engineering Design Projects for Community Colleges. American
Journal of Engineering Education, 8(1), 1-12.
tabler-icon-diamond-filled.svg

Secure Best Marks with AI Grader

Need help grading? Try our AI Grader for instant feedback on your assignments.
Document Page
chevron_up_icon
1 out of 17
circle_padding
hide_on_mobile
zoom_out_icon
[object Object]

Your All-in-One AI-Powered Toolkit for Academic Success.

Available 24*7 on WhatsApp / Email

[object Object]