Detailed Analysis of Financial Performance and Investment Appraisal
VerifiedAdded on 2023/06/14
|18
|3063
|362
Report
AI Summary
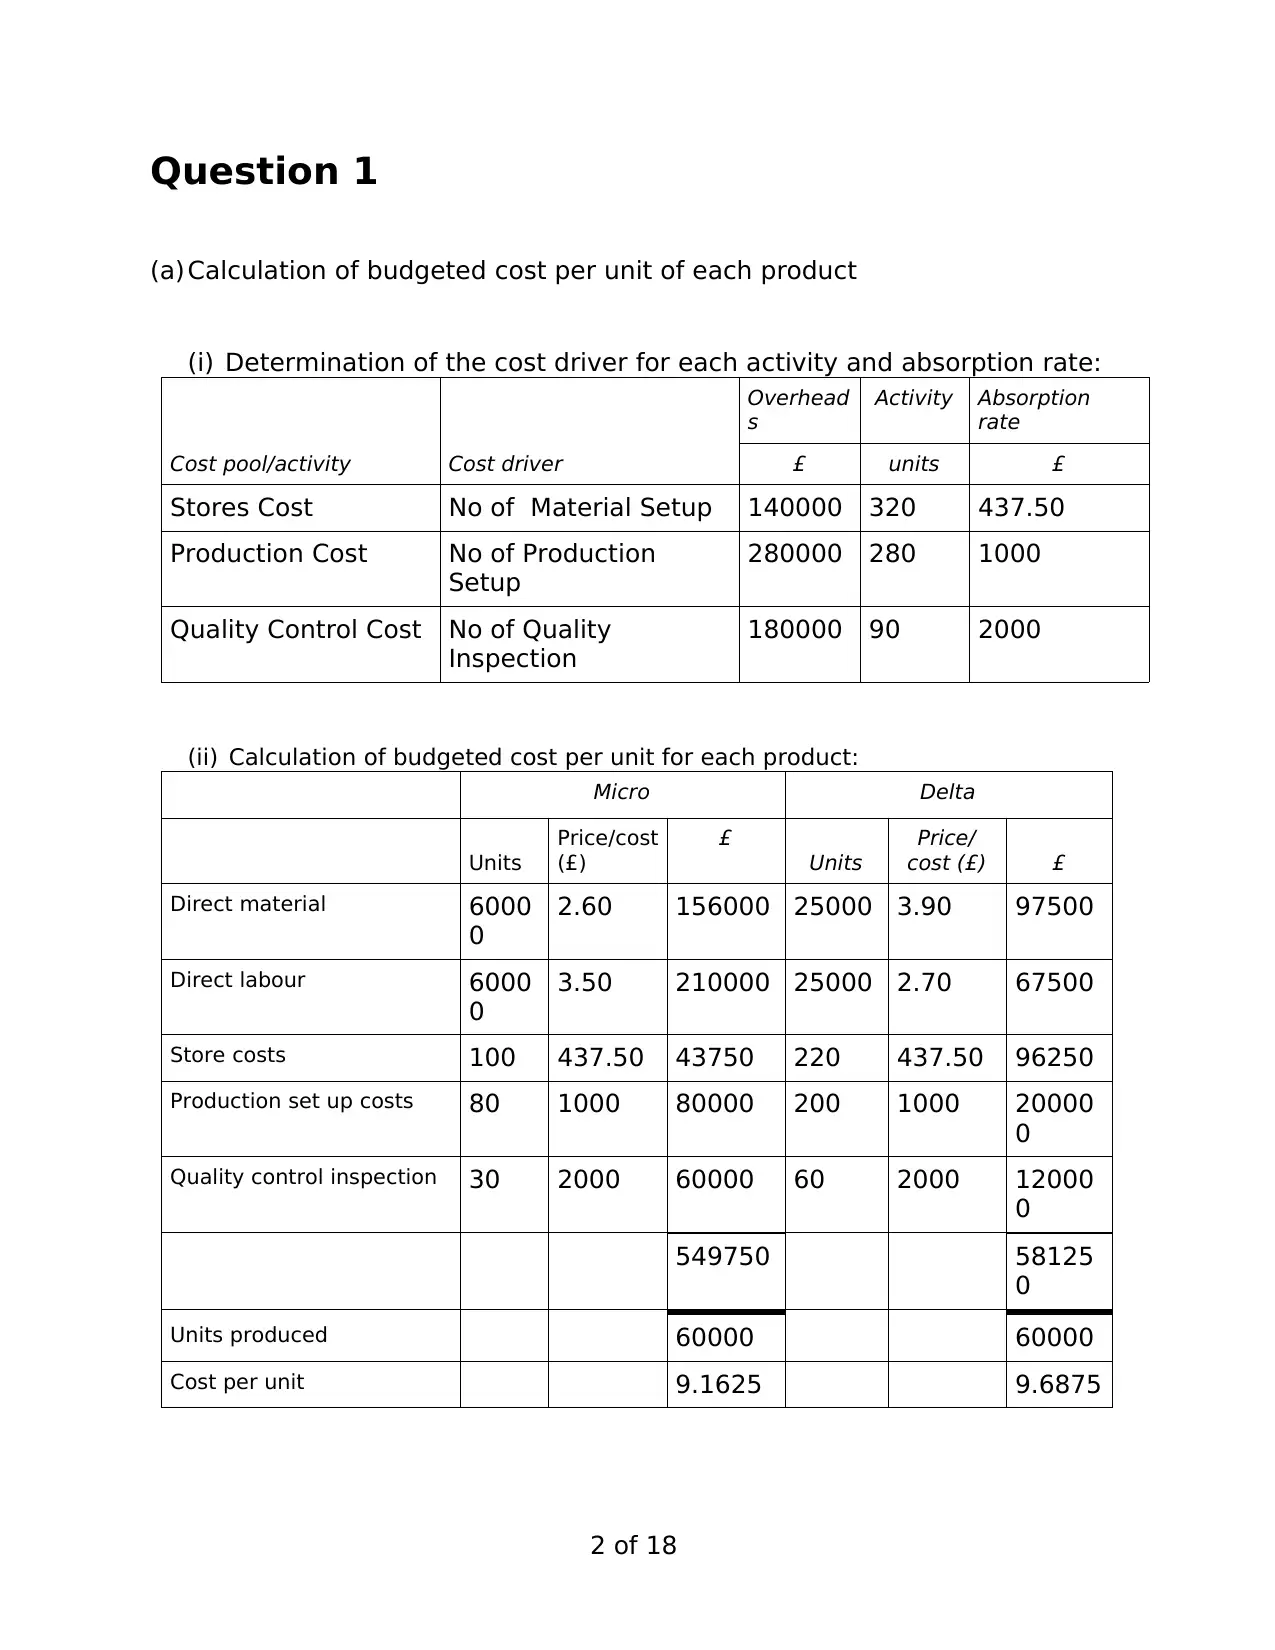
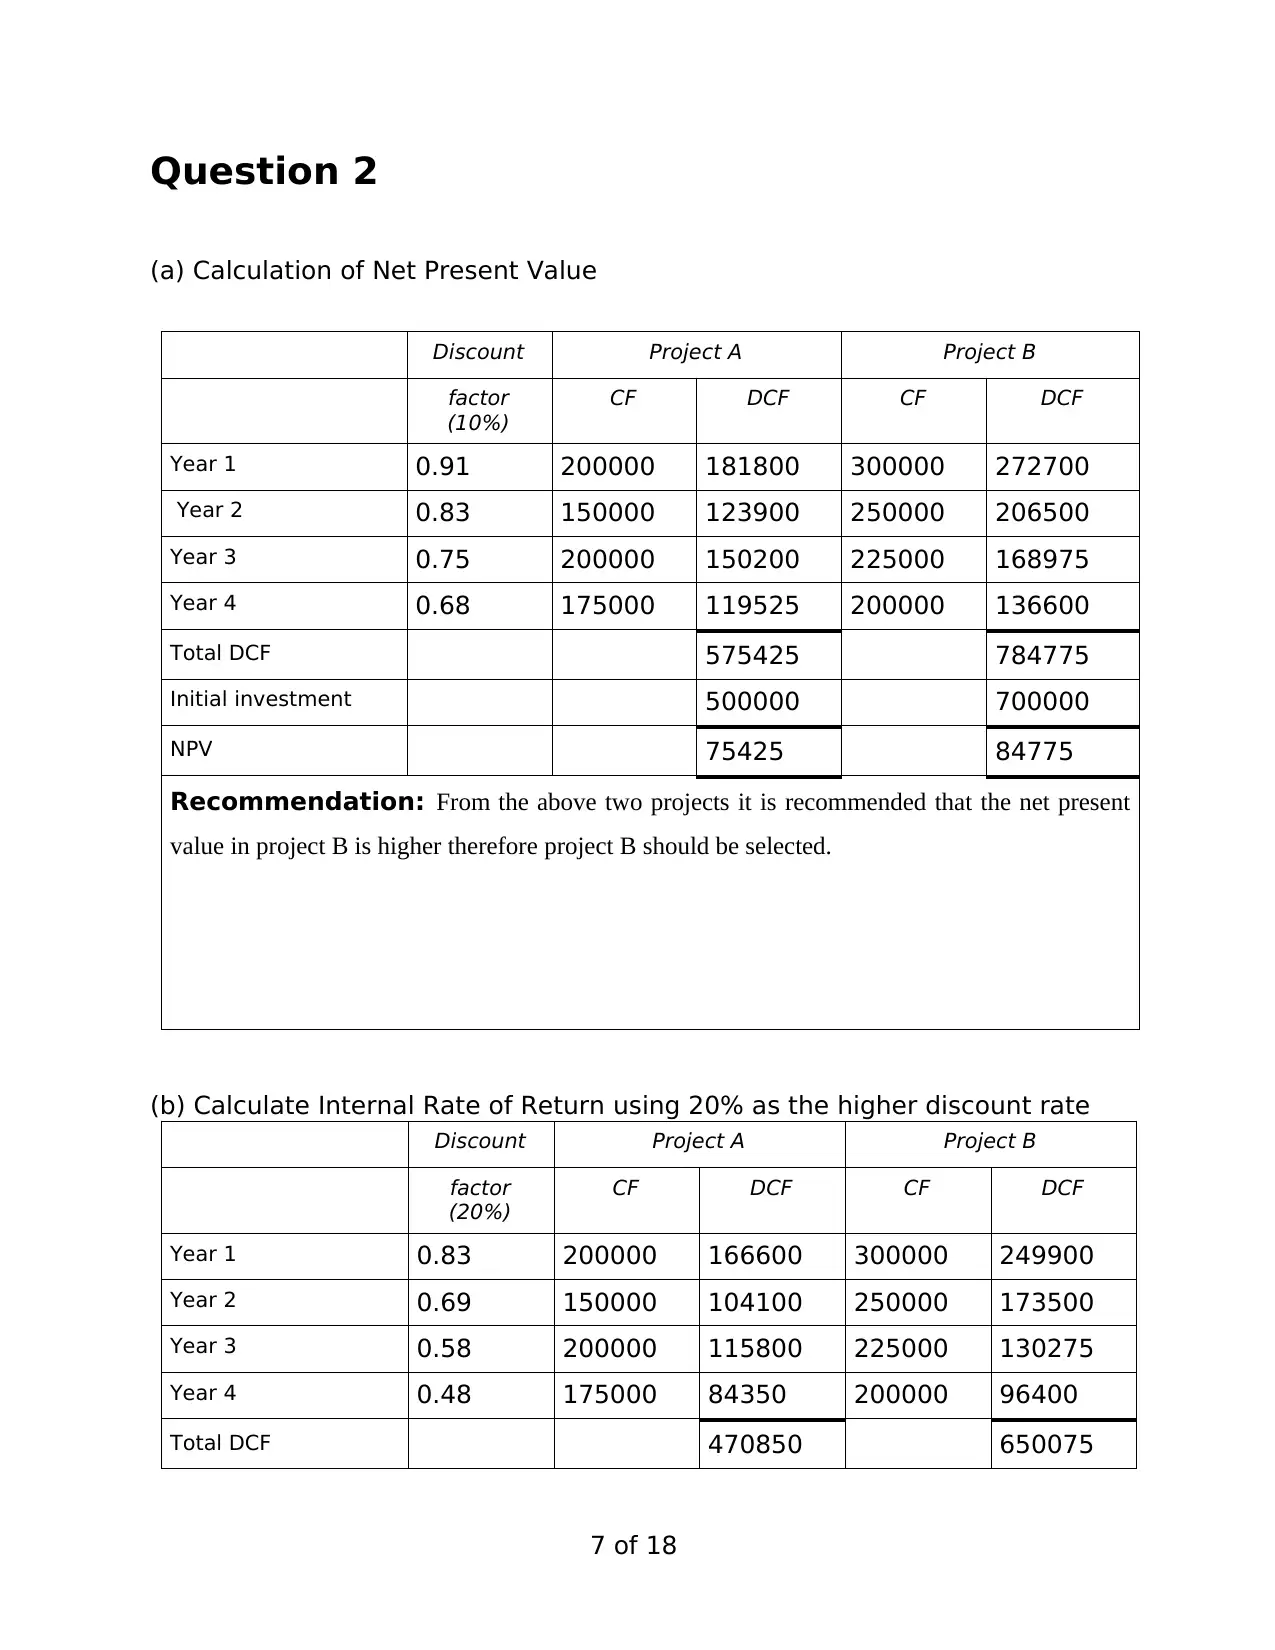
This assignment provides a detailed financial analysis and project appraisal. It includes calculations of budgeted costs using activity-based costing (ABC), a critical evaluation of ABC as a costing method, and how activity-based management can assist in better management decision-making. The assignment also covers project appraisal using Net Present Value (NPV), Internal Rate of Return (IRR), and Profitability Index, with a critical evaluation of NPV. Furthermore, it includes the calculation of financial ratios to assess the company's performance between 2019 and 2020 and a critical evaluation of the Balanced Scorecard method. Finally, it provides calculations of material and labor variances with explanations, offering a comprehensive overview of financial analysis and performance assessment.

==============================================
================
1 of 18
================
1 of 18
Paraphrase This Document
Need a fresh take? Get an instant paraphrase of this document with our AI Paraphraser

Question 1
(a) Calculation of budgeted cost per unit of each product
(i) Determination of the cost driver for each activity and absorption rate:
Cost pool/activity Cost driver
Overhead
s
Activity Absorption
rate
£ units £
Stores Cost No of Material Setup 140000 320 437.50
Production Cost No of Production
Setup
280000 280 1000
Quality Control Cost No of Quality
Inspection
180000 90 2000
(ii) Calculation of budgeted cost per unit for each product:
Micro Delta
Units
Price/cost
(£)
£
Units
Price/
cost (£) £
Direct material 6000
0
2.60 156000 25000 3.90 97500
Direct labour 6000
0
3.50 210000 25000 2.70 67500
Store costs 100 437.50 43750 220 437.50 96250
Production set up costs 80 1000 80000 200 1000 20000
0
Quality control inspection 30 2000 60000 60 2000 12000
0
549750 58125
0
Units produced 60000 60000
Cost per unit 9.1625 9.6875
2 of 18

3 of 18
⊘ This is a preview!⊘
Do you want full access?
Subscribe today to unlock all pages.

Trusted by 1+ million students worldwide

(b) Critical evaluation of ABC as a costing method:
Activity based costing can be explained as a process that includes calculation of overhead and
indirect costs for example utilities, salaries, with reference to products& services. The ABC
system is an underlying process that explains it as a procedure which includes cost accounting
based on certain activities, working that could be any task with determined objectives, plans,
goals (Bashir and et.al., 2018)
. There are certain benefits, risks associated and linked with ABC costing method.
Advantages of Activity based costing method:
1. It is considered helpful, serves as one of the best guides in formulating plans and
contributes in decision making process as well.
2. It is a more reliable and trustful product costing in comparison with other methods so
far discovered.
3. It helps in having full control over effective and efficient working of company.
4. It has proved to be more accurate in calculation of product and service costing.
5. Companies can evaluate relevant factors affecting decision making process in a
company.
6. It helps to ascertain costs which are adding more expenses in overheads and makes it
more expensive & costly. Managers could eliminate and reduce costs with formulating certain
strategies or business plans too.
Disadvantages of ABC as costing method:
1. Company, managers, employees find it impossible to calculate and allocate overhead,
production and service costs to certain activities.
2. Managers might find it difficult to explain the process of Activity based costing to its
stakeholder & shareholders in reference to costing (Djuhatmoko, Purwanto and Tjahjono,
2019).
3. The decision of activities & cost driver might result inappropriate and non-reliable.
4 of 18
Paraphrase This Document
Need a fresh take? Get an instant paraphrase of this document with our AI Paraphraser

(c) How Activity Based Management could assist better management decision
making and control:
Activity based costing assists in better management decision making & control costs of the
products, cut down costs and expenditures, helps to identify and eliminate inefficient and
ineffective products, tools and machinery. It also helps improve profit margins of the company,
cut down costs and improve the working of the organisation for the long term working of
business (Doumpos and Figueira, 2019). It is considered more accurate than other decision
making methods and gives an overview what could be done, how could be done. Activity based
management is a tool, method which assists in collecting, storing, providing data and useful
information to plan working, manage operations, control costs, direct employees and activities
in an organisation. It helps to measure how costly activities have been and then take preventive
measures to control costs by changing process of production or improve the working of
operations carried out in an organisation.
ABC assist better management decision making & control:
1. ABC can help managers in providing guidance for taking decisions about setting up of
prices for products, to evaluate which products and services are obsolete and not considered
efficient for proper working in organisation.
2. It also benefits production because it provides better and useful information in relation
with costs for each operation and activity.
3. ABC helps managers to know the reason behind increasing costs and how it can be
controlled (Elshaer, 2020).
4. It provides more detailed knowledge about incurring costs and managers would find it
easy to take useful measures for lowering them with time.
5 of 18

6 of 18
⊘ This is a preview!⊘
Do you want full access?
Subscribe today to unlock all pages.

Trusted by 1+ million students worldwide

Question 2
(a) Calculation of Net Present Value
Discount Project A Project B
factor
(10%)
CF DCF CF DCF
Year 1 0.91 200000 181800 300000 272700
Year 2 0.83 150000 123900 250000 206500
Year 3 0.75 200000 150200 225000 168975
Year 4 0.68 175000 119525 200000 136600
Total DCF 575425 784775
Initial investment 500000 700000
NPV 75425 84775
Recommendation: From the above two projects it is recommended that the net present
value in project B is higher therefore project B should be selected.
(b) Calculate Internal Rate of Return using 20% as the higher discount rate
Discount Project A Project B
factor
(20%)
CF DCF CF DCF
Year 1 0.83 200000 166600 300000 249900
Year 2 0.69 150000 104100 250000 173500
Year 3 0.58 200000 115800 225000 130275
Year 4 0.48 175000 84350 200000 96400
Total DCF 470850 650075
7 of 18
Paraphrase This Document
Need a fresh take? Get an instant paraphrase of this document with our AI Paraphraser

Initial investment 500000 700000
NPV -29150 -49925
8 of 18
NPV -29150 -49925
8 of 18

(ii) Calculation of Internal Rate of Return (continued)
IRR of Project A= 10% + (-29150 / -29150 + 75425) * (20% - 10%)
= 10% + (-29150 / 46275) * (10%)
= 10% + (-0.63) * 10%
= 10% - 0.063
= 9.94%
IRR of Project B= 10% + (-49925 / -49925 + 84775) * (20% - 10%)
= 10% + (-49925/ 34850) * (10%)
= 10% + (-1.43) * 10%
= 10% + (-0.143)
= 9.86%
(c) Critical evaluation of the Net Present Value of Project appraisal:
9 of 18
⊘ This is a preview!⊘
Do you want full access?
Subscribe today to unlock all pages.

Trusted by 1+ million students worldwide

The NPV of the of both the project is positive therefore both the projects are financially viable
However, for decision making we have to select one project only from the above two projects
(Huang and et.al., 2018). Therefore we consider profitability index for decision making. From
the basis of profitability index projects, project A should be selected.
(d) How the Profitability Index is used for project appraisal:
Profitability Index = Present Value of future cash flows / Initial Investment
Project A at (10%) = 575425/500000
= 1.15
Project B at (10%) = 784775/700000
= 1.12
Uses of Profitability index:
It can be used to analyze a single project.
It helps in selecting a profitable project, if Profitability Index is more than 1 (Kamil,
Zaini, S. and Abu, 2021).
10 of 18
Paraphrase This Document
Need a fresh take? Get an instant paraphrase of this document with our AI Paraphraser

Question 3
(a) Calculation of ratios and discussion of the financial performance of the
company between 2019 and 2020.
Calculation of Fiscal Ratios:
1. Net profit margin ratio = (Net Profit / Net sales) * 100
2020 = (190 / 2000) * 100 = 9.5 %
2019 = (70 / 1000) * 100 = 7 %
2. Operating Profit Margin Ratio = (Operating Profit / Net Sales) * 100
2020 = (340 / 2000) * 100 = 17 %
2019 = (150 / 1000) * 100 = 15 %
3. Working Capital = Current Assets – Current Liabilities
2020 = 1700 – 500 = 1200
2019 = 1100 – 1300 = -200
4. Current Ratio = Current Assets / Current Liabilities
2020 = 1700 / 500 = 3.4: 1
2019 = 1100 / 1300 = 0.85: 1
5. Acid – test ratio = (Current Assets – Inventory) / Current Liabilities
2020 = (1700 – 1200) / 500 = 1: 1
2019 = (1100 – 200) / 1300 = 0.69
6. Debt – to – Equity Ratio = Total Debt / Total Equity
2020 = 1500 / 2000 = 0.75: 1
2019 = 1900 / 600 = 3.16: 1
7. Earnings per share = Earnings available for equity shareholders / Outstanding
11 of 18

number of shares
2020 = 190 / (1200 / 0.50) = 190 / 2400 = 0.08
2019 = 70 / (500 / 0.5) = 70 / 1000 = 0.07
Analysis: It can be evaluated from the above calculations that net profit and operating profit of
the company has been increased from the previous years which shows that company has been
effectively and efficiently utilising their resources that generates profit for the organisation.
Further after calculating the working capital ratio it can be evaluated that the company will able
to meet out its short term obligation as their current assets are more as compare to current
liabilities. It also indicates that company’s liquidity position are being good considering their
Working efficiency.
The current ration of the company in the year 2019 is .85 which is considered to be lower as
compare to 2020. The idle current ratio for an organisation is between 1.50 to 3 which is
acceptable. The current ratio less than one shows that entity has liquidity problems. However,
from the above analysis it is evaluated that the company has been able to improve the same in
the year 2020.
The debt equity ratio of the company in 2019 3.16 which indicates that company is very risky.
It also shows that the company has borrowed funds by way of debentures or loan in their
capital structure. The own funds of the company are less and debts are more then makes the
company risky in the context of investment. However, there is a reduction in such ration in
2020 that is .75 which signifies that the companies have repaid their debt or redeem the same
which makes the company less risky. Further debt Equity ratio should not be more than 2 in
any organisation.
The earning per share of the company is improved in 2020 as compared to 2019 as it is shown
in the above calculation. Higher EPS indicates that the company is meeting the shareholder’s
expectation.
12 of 18
⊘ This is a preview!⊘
Do you want full access?
Subscribe today to unlock all pages.

Trusted by 1+ million students worldwide
1 out of 18
Related Documents
Your All-in-One AI-Powered Toolkit for Academic Success.
+13062052269
info@desklib.com
Available 24*7 on WhatsApp / Email
Unlock your academic potential
Copyright © 2020–2025 A2Z Services. All Rights Reserved. Developed and managed by ZUCOL.


