Capital Budgeting for Saturn Petcare & ARB Corp Financial Report
VerifiedAdded on 2023/06/14
|20
|4073
|475
Report
AI Summary
This report analyzes Saturn Petcare Australia and New Zealand's project selection between Bathurst and Wodonga, recommending Wodonga based on NPV, payback period, and profitability index. It also examines ARB Corporation Limited's capital structure, noting its 100% equity financing, calculates its WACC and CAPM, and compares it with competitor Bell Equipment Limited. Key financial ratios of ARB Corporation are analyzed, revealing declining liquidity and return on equity, alongside an increasing debt-equity ratio. The report concludes with recommendations for ARB Corporation to improve its capital structure, focus on shareholder wealth maximization, and maintain liquidity, highlighting that Desklib provides access to similar solved assignments and study resources.
0ACCOUNTING AND FINANCE
Accounting and Finance
Student Name
University Name
Accounting and Finance
Student Name
University Name
Paraphrase This Document
Need a fresh take? Get an instant paraphrase of this document with our AI Paraphraser
1ACCOUNTING AND FINANCE
Table of Contents
Answer to Part A.........................................................................................................................3
Selection among the projects...........................................................................................................3
Product Cannibalization...................................................................................................................4
Capital budgeting options available to compensate excess sales....................................................4
Original value of the vacant Wodonga to be considered or not......................................................4
Answer to Part B..............................................................................................................................5
Executive Summary.........................................................................................................................5
Introduction......................................................................................................................................5
Answer to 2i)...................................................................................................................................5
Current capital structure of the firm ARB Corporation Limited.....................................................5
WACC of the organization ARB Corporation Limited...................................................................6
CAPM..............................................................................................................................................6
Answer to 2ii) Comparison of the capital structure of ARB Corporation Limited with its
competitor........................................................................................................................................6
Answer to 2iii) Analysis of Key Financial Ratios of ARB Corporation Limited...........................6
Answer to 2iv): ARB Corporation Limited capital structure comparison over the years...............8
Answer to 2v) Maximizing wealth for shareholders.......................................................................9

2ACCOUNTING AND FINANCE
Answer to 2vi) Conclusion and recommendations..........................................................................9
References......................................................................................................................................10
Appendices................................................................................................................................11
⊘ This is a preview!⊘
Do you want full access?
Subscribe today to unlock all pages.
Trusted by 1+ million students worldwide
3ACCOUNTING AND FINANCE
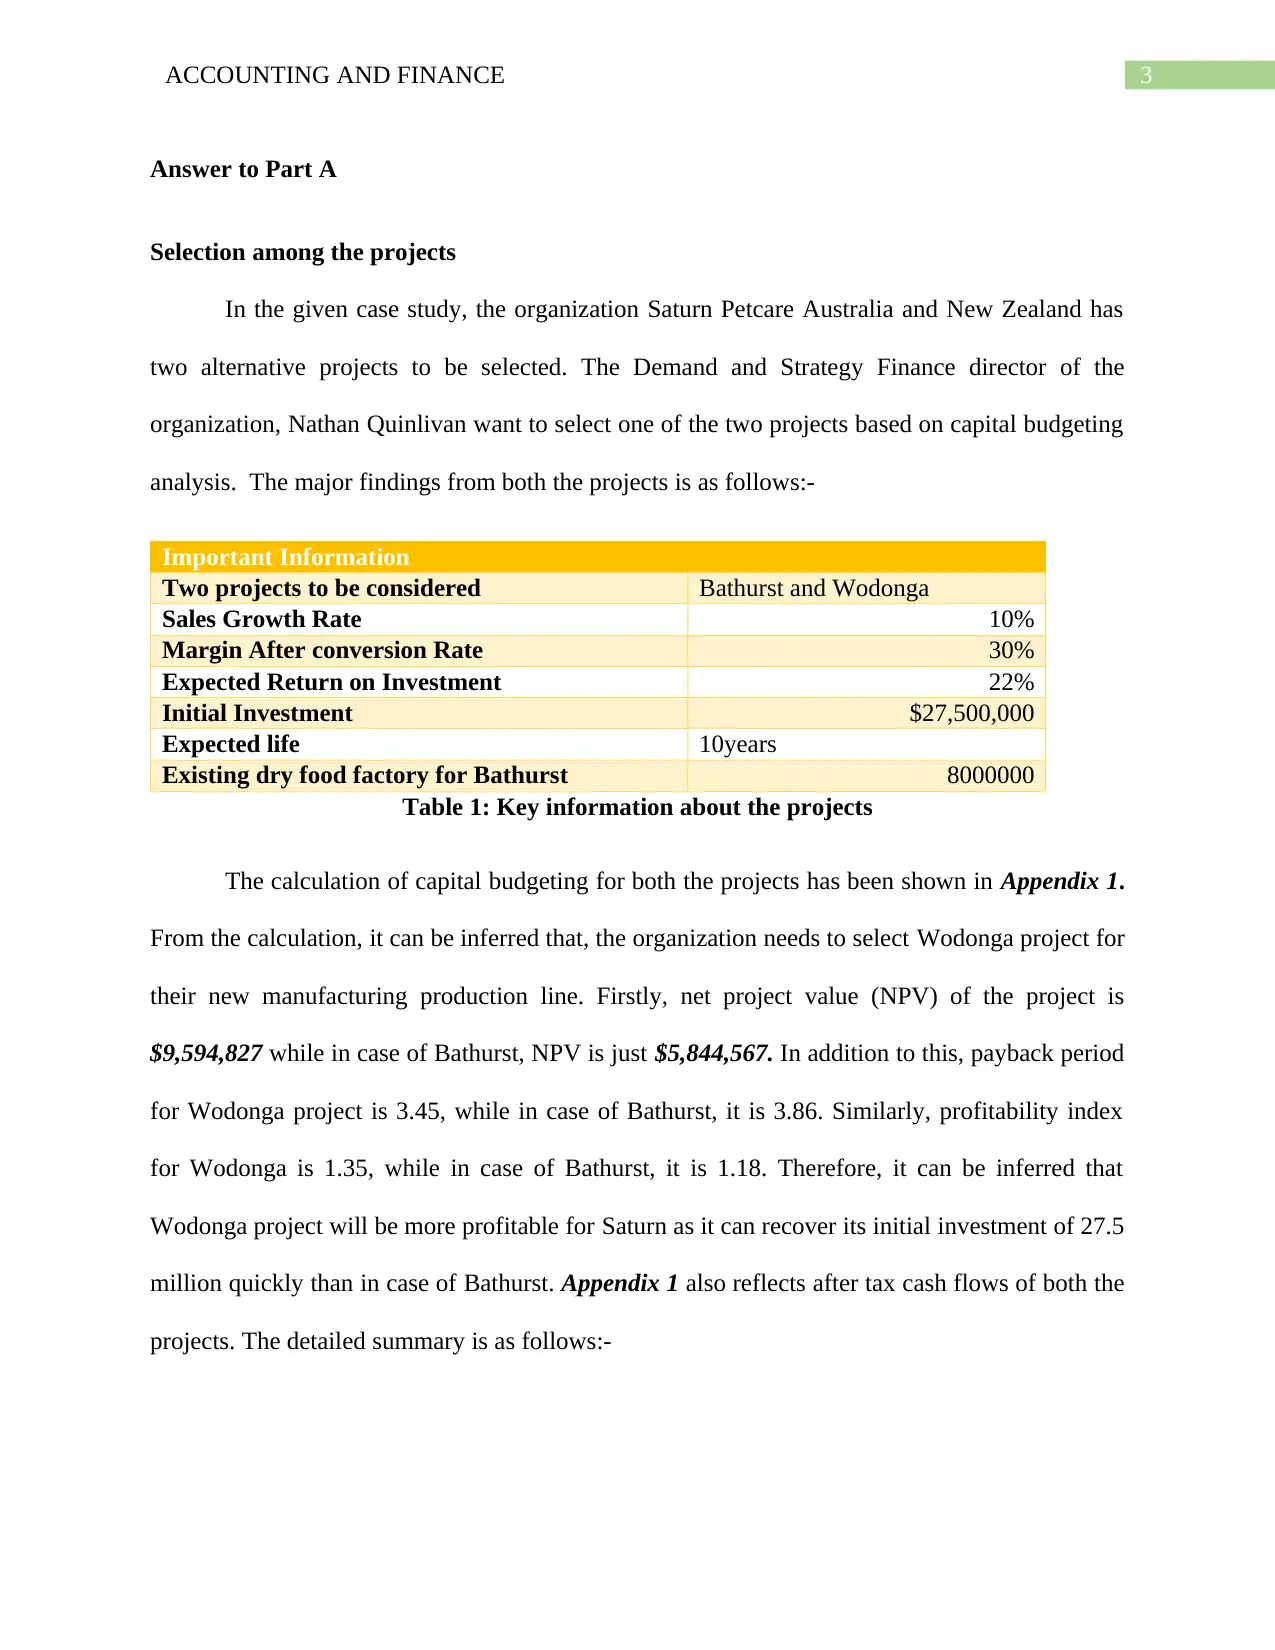
Answer to Part A
Selection among the projects
In the given case study, the organization Saturn Petcare Australia and New Zealand has
two alternative projects to be selected. The Demand and Strategy Finance director of the
organization, Nathan Quinlivan want to select one of the two projects based on capital budgeting
analysis. The major findings from both the projects is as follows:-
Important Information
Two projects to be considered Bathurst and Wodonga
Sales Growth Rate 10%
Margin After conversion Rate 30%
Expected Return on Investment 22%
Initial Investment $27,500,000
Expected life 10years
Existing dry food factory for Bathurst 8000000
Table 1: Key information about the projects
The calculation of capital budgeting for both the projects has been shown in Appendix 1.
From the calculation, it can be inferred that, the organization needs to select Wodonga project for
their new manufacturing production line. Firstly, net project value (NPV) of the project is
$9,594,827 while in case of Bathurst, NPV is just $5,844,567. In addition to this, payback period
for Wodonga project is 3.45, while in case of Bathurst, it is 3.86. Similarly, profitability index
for Wodonga is 1.35, while in case of Bathurst, it is 1.18. Therefore, it can be inferred that
Wodonga project will be more profitable for Saturn as it can recover its initial investment of 27.5
million quickly than in case of Bathurst. Appendix 1 also reflects after tax cash flows of both the
projects. The detailed summary is as follows:-
Paraphrase This Document
Need a fresh take? Get an instant paraphrase of this document with our AI Paraphraser
4ACCOUNTING AND FINANCE
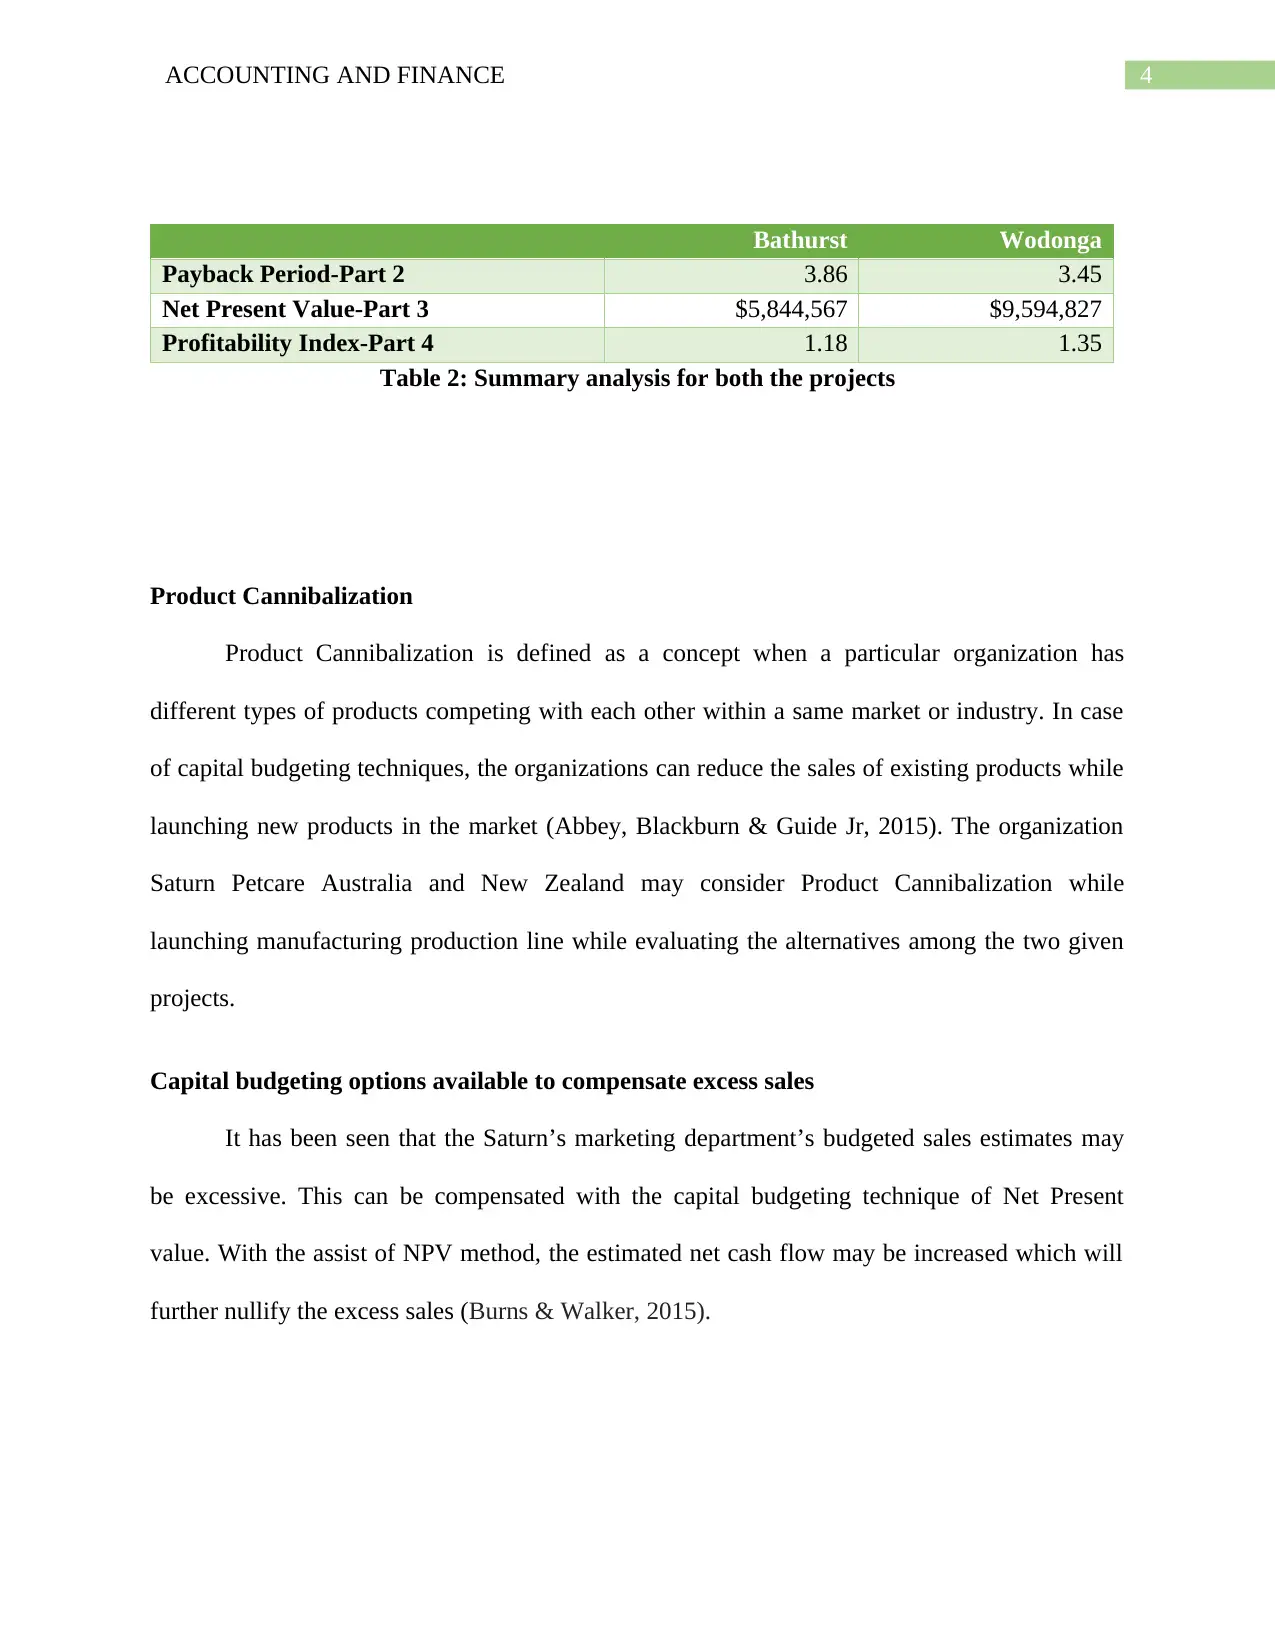
Bathurst Wodonga
Payback Period-Part 2 3.86 3.45
Net Present Value-Part 3 $5,844,567 $9,594,827
Profitability Index-Part 4 1.18 1.35
Table 2: Summary analysis for both the projects
Product Cannibalization
Product Cannibalization is defined as a concept when a particular organization has
different types of products competing with each other within a same market or industry. In case
of capital budgeting techniques, the organizations can reduce the sales of existing products while
launching new products in the market (Abbey, Blackburn & Guide Jr, 2015). The organization
Saturn Petcare Australia and New Zealand may consider Product Cannibalization while
launching manufacturing production line while evaluating the alternatives among the two given
projects.
Capital budgeting options available to compensate excess sales
It has been seen that the Saturn’s marketing department’s budgeted sales estimates may
be excessive. This can be compensated with the capital budgeting technique of Net Present
value. With the assist of NPV method, the estimated net cash flow may be increased which will
further nullify the excess sales (Burns & Walker, 2015).

5ACCOUNTING AND FINANCE
Original value of the vacant Wodonga to be considered or not
It can be inferred that the Original value of the vacant Wodonga should not been taken
into consideration as the technique of capital budgeting (NPV) only considers costs related to
newly developed sites as initial investment (Brooks,2015). In addition to this, it can be also
inferred that if original value of the vacant Wodonga is included, then, the entire capital
budgeting analysis will be changed and completely wrong, as shown in Appendix 1B.
Answer to Part B
Executive Summary
The given report reflects about the structure of capital of the organization ARB Corporation
Limited. It has been found that the organization has given 100 percent weightage to
shareholder’s equity in its capital structure. However, there are several issues highlighted with
the organization. Based on which, certain recommendations have been suggested.
Introduction
The given report highlights about ARB Corporation Limited and its financial
performance over the years. It has been also compared with one of its competitors in terms of its
capital structure. Based on the analysis, suitable recommendations have been given.
Answer to 2i)
Current capital structure of the firm ARB Corporation Limited
From Appendix 2i, it can be inferred that the organization ARB Corporation Limited
gives 100 percent weightage to equity in its capital structure (Arb.com.au, 2018). There is no
⊘ This is a preview!⊘
Do you want full access?
Subscribe today to unlock all pages.
Trusted by 1+ million students worldwide

6ACCOUNTING AND FINANCE
sign of debt and therefore, it can be opined that the firm is not exposed to financial risk (Robb &
Robinson, 2014).
WACC of the organization ARB Corporation Limited
From the calculation shown in Appendix 2i, it can be inferred that WACC of ARB Corporation
Limited is 18.05 percent in 2017. In comparison with the previous two years, it can be deduced
that the cost of capital has decreased (19.01 percent in 2016 and 19.39 percent in 2015). This can
be taken as a good sign for the organization as the firm is being successful in minimizing the cost
of capital financing (Zeitun & Tian, 2014).
CAPM
From the calculation shown in Appendix 2i, it can be inferred that, the expected cost of equity is
coming to be 7.9 percent. This can be taken as a good sign for the organization as market rate of
return RM is more than the expected cost of equity (8.54 percent).
Answer to 2ii) Comparison of the capital structure of ARB Corporation Limited with its
competitor
The capital structure of the organization ARB Corporation Limited has been compared
with its competitor Bell Equipment Limited. In case of Bell Equipment Limited, the capital
structure of the firm is mixed of debt and equity (81 percent equity and 19 percent debt). The
total equity of the company is $3,657. While, in case of ARB Corporation Limited, the entire
capital structure is formed on the basis of equity and there is no sign of debt in capital structure.
The total equity of the firm is $272,341.
Paraphrase This Document
Need a fresh take? Get an instant paraphrase of this document with our AI Paraphraser
7ACCOUNTING AND FINANCE
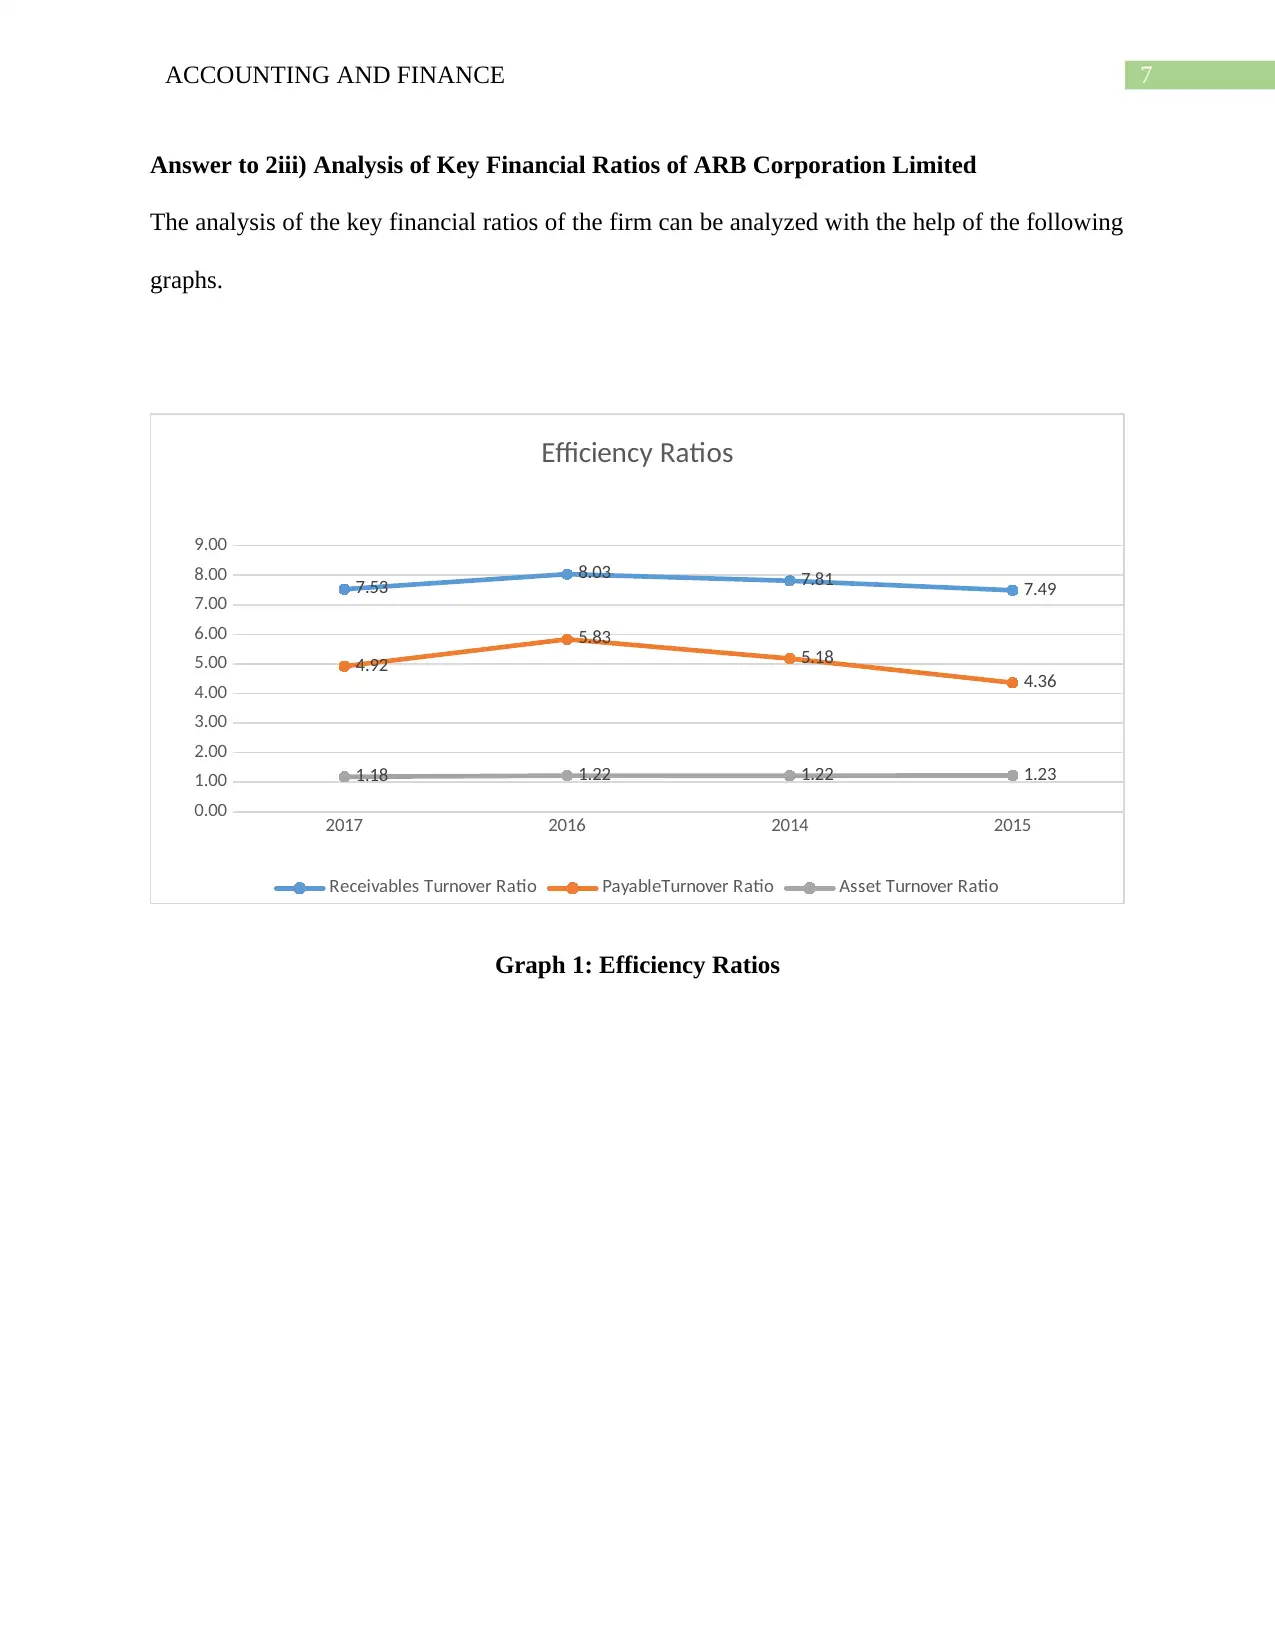
Answer to 2iii) Analysis of Key Financial Ratios of ARB Corporation Limited
The analysis of the key financial ratios of the firm can be analyzed with the help of the following
graphs.
2017 2016 2014 2015
0.00
1.00
2.00
3.00
4.00
5.00
6.00
7.00
8.00
9.00
7.53 8.03 7.81 7.49
4.92
5.83
5.18
4.36
1.18 1.22 1.22 1.23
Efficiency Ratios
Receivables Turnover Ratio PayableTurnover Ratio Asset Turnover Ratio
Graph 1: Efficiency Ratios
8ACCOUNTING AND FINANCE
2017 2016 2014 2015
0.00
0.05
0.10
0.15
0.20
0.25
0.13 0.13 0.13 0.14
0.18 0.19 0.19
0.22
Profitability Ratios
Net Profit Margin Return on Equity (ROE)
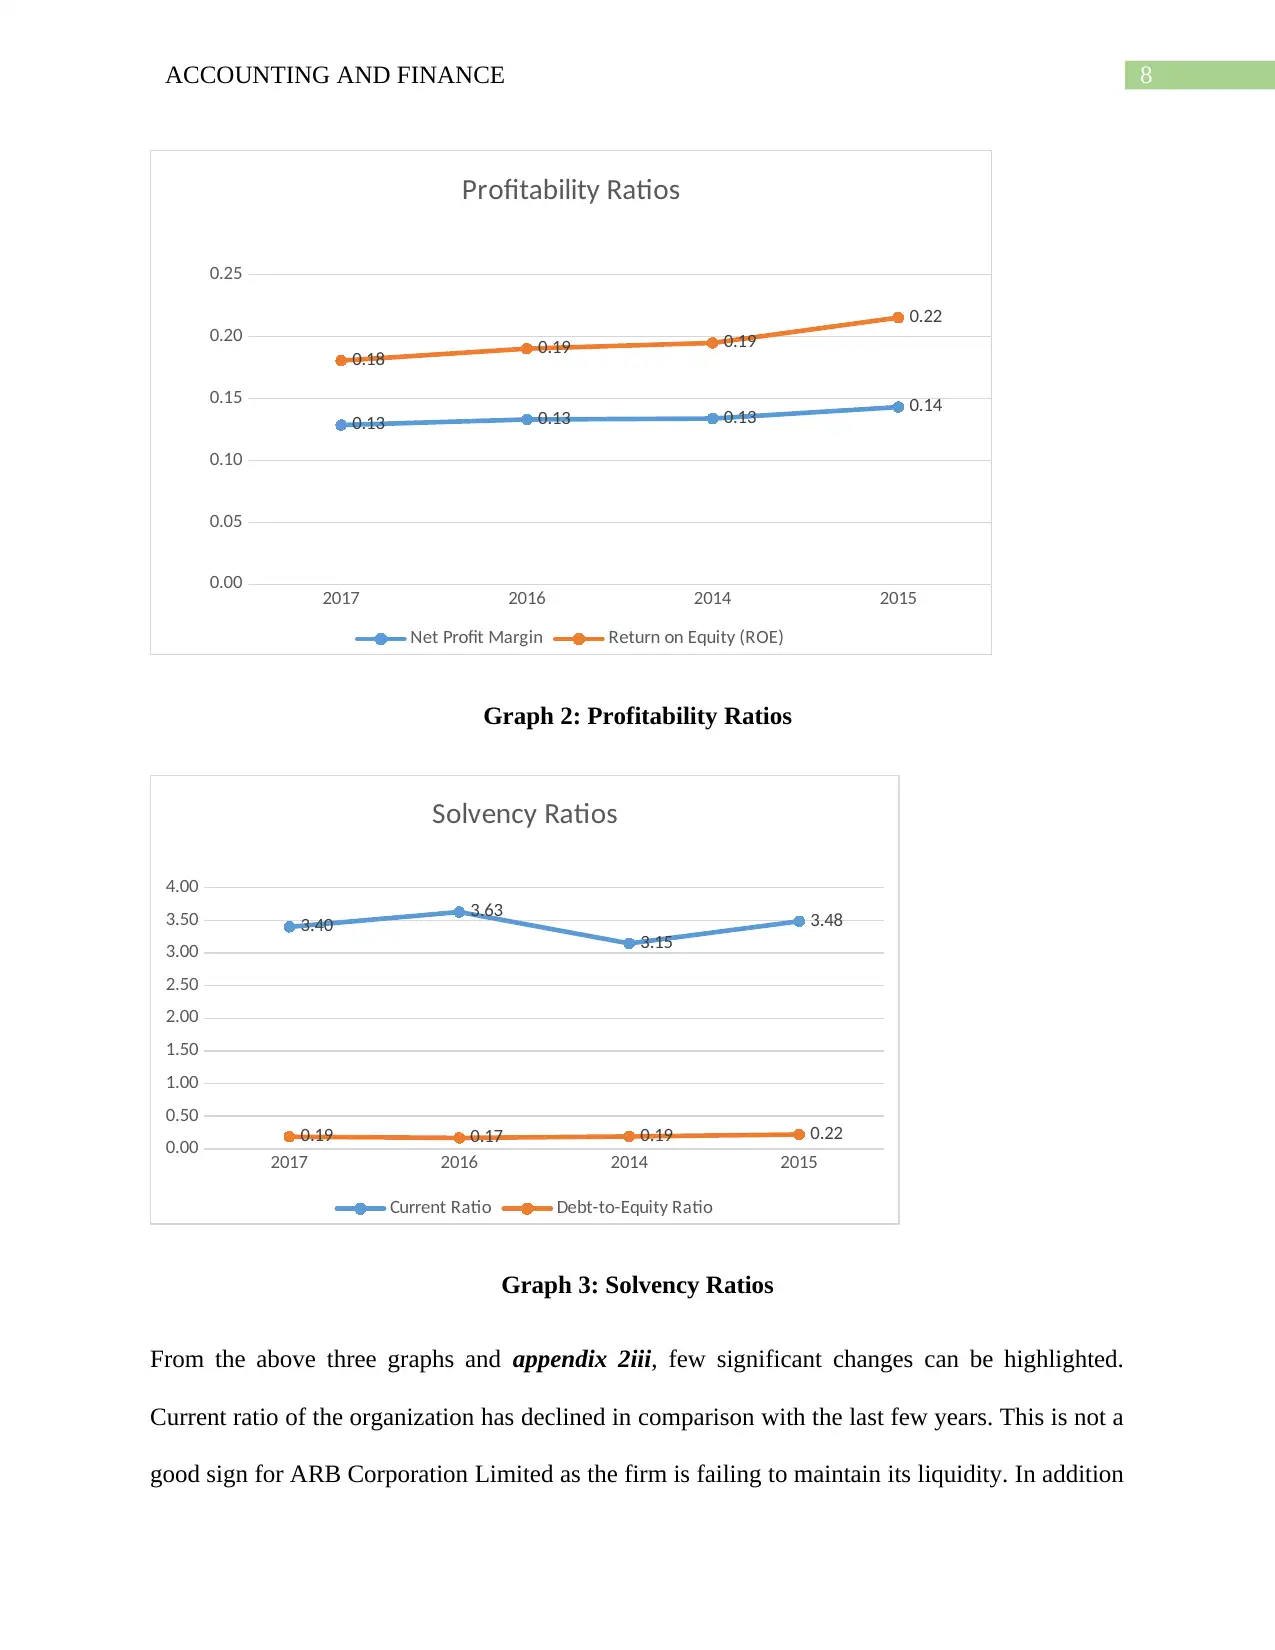
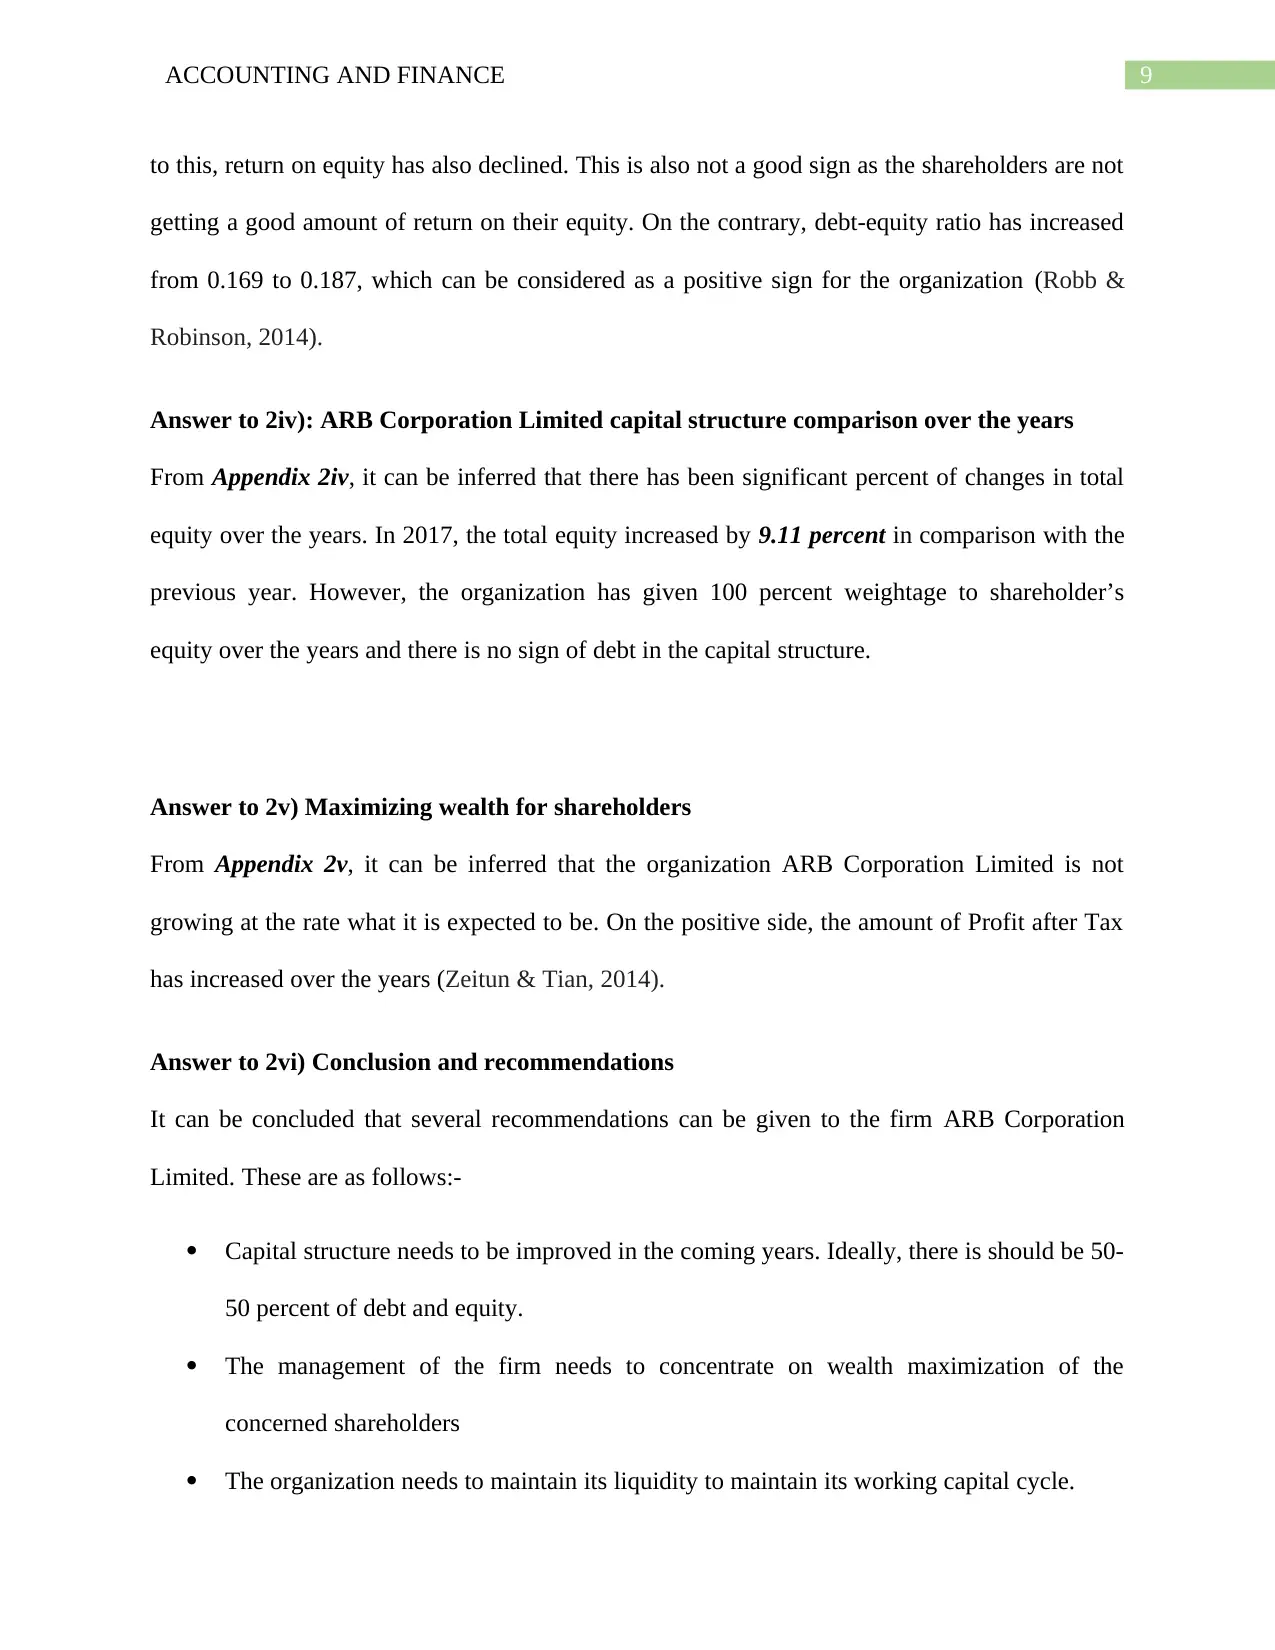
Graph 2: Profitability Ratios
2017 2016 2014 2015
0.00
0.50
1.00
1.50
2.00
2.50
3.00
3.50
4.00
3.40 3.63
3.15
3.48
0.19 0.17 0.19 0.22
Solvency Ratios
Current Ratio Debt-to-Equity Ratio
Graph 3: Solvency Ratios
From the above three graphs and appendix 2iii, few significant changes can be highlighted.
Current ratio of the organization has declined in comparison with the last few years. This is not a
good sign for ARB Corporation Limited as the firm is failing to maintain its liquidity. In addition
2017 2016 2014 2015
0.00
0.05
0.10
0.15
0.20
0.25
0.13 0.13 0.13 0.14
0.18 0.19 0.19
0.22
Profitability Ratios
Net Profit Margin Return on Equity (ROE)
Graph 2: Profitability Ratios
2017 2016 2014 2015
0.00
0.50
1.00
1.50
2.00
2.50
3.00
3.50
4.00
3.40 3.63
3.15
3.48
0.19 0.17 0.19 0.22
Solvency Ratios
Current Ratio Debt-to-Equity Ratio
Graph 3: Solvency Ratios
From the above three graphs and appendix 2iii, few significant changes can be highlighted.
Current ratio of the organization has declined in comparison with the last few years. This is not a
good sign for ARB Corporation Limited as the firm is failing to maintain its liquidity. In addition
⊘ This is a preview!⊘
Do you want full access?
Subscribe today to unlock all pages.
Trusted by 1+ million students worldwide
9ACCOUNTING AND FINANCE
to this, return on equity has also declined. This is also not a good sign as the shareholders are not
getting a good amount of return on their equity. On the contrary, debt-equity ratio has increased
from 0.169 to 0.187, which can be considered as a positive sign for the organization (Robb &
Robinson, 2014).
Answer to 2iv): ARB Corporation Limited capital structure comparison over the years
From Appendix 2iv, it can be inferred that there has been significant percent of changes in total
equity over the years. In 2017, the total equity increased by 9.11 percent in comparison with the
previous year. However, the organization has given 100 percent weightage to shareholder’s
equity over the years and there is no sign of debt in the capital structure.
Answer to 2v) Maximizing wealth for shareholders
From Appendix 2v, it can be inferred that the organization ARB Corporation Limited is not
growing at the rate what it is expected to be. On the positive side, the amount of Profit after Tax
has increased over the years (Zeitun & Tian, 2014).
Answer to 2vi) Conclusion and recommendations
It can be concluded that several recommendations can be given to the firm ARB Corporation
Limited. These are as follows:-
Capital structure needs to be improved in the coming years. Ideally, there is should be 50-
50 percent of debt and equity.
The management of the firm needs to concentrate on wealth maximization of the
concerned shareholders
The organization needs to maintain its liquidity to maintain its working capital cycle.
Paraphrase This Document
Need a fresh take? Get an instant paraphrase of this document with our AI Paraphraser

10ACCOUNTING AND FINANCE
In this manner, the organization will be able to attain its desired aims and objectives and sustain
with respect to its competitors.
In this manner, the organization will be able to attain its desired aims and objectives and sustain
with respect to its competitors.
11ACCOUNTING AND FINANCE
References
Abbey, J. D., Blackburn, J. D., & Guide Jr, V. D. R. (2015). Optimal pricing for new and
remanufactured products. Journal of Operations Management, 36, 130-146.
ARB 4x4 Accessories - Your partner in adventure. (2018). Retrieved from
https://www.arb.com.au/
Brooks, R. (2015). Financial management: core concepts. Pearson.
Burns, R., & Walker, J. (2015). Capital budgeting surveys: the future is now.
Robb, A. M., & Robinson, D. T. (2014). The capital structure decisions of new firms. The
Review of Financial Studies, 27(1), 153-179.
Zeitun, R., & Tian, G. (2014). Capital structure and corporate performance: evidence from
Jordan.
⊘ This is a preview!⊘
Do you want full access?
Subscribe today to unlock all pages.
Trusted by 1+ million students worldwide
1 out of 20
Related Documents


Your All-in-One AI-Powered Toolkit for Academic Success.
+13062052269
info@desklib.com
Available 24*7 on WhatsApp / Email
![[object Object]](/_next/static/media/star-bottom.7253800d.svg)
Unlock your academic potential
Copyright © 2020–2026 A2Z Services. All Rights Reserved. Developed and managed by ZUCOL.