Accounting Financial Analysis Report - Skywest and Cathay Pacific
VerifiedAdded on 2022/09/05
|32
|7458
|13
AI Summary
Contribute Materials
Your contribution can guide someone’s learning journey. Share your
documents today.

1
Accounting financial analysis report
Accounting financial analysis report
Secure Best Marks with AI Grader
Need help grading? Try our AI Grader for instant feedback on your assignments.

2
Executive summary
The report has been prepared for the analysis of the financial position and
performance of SkyWest and Cathay pacific. In that both, the companies have been
considered and the information for them is used. The various aspects of the business have
been identified with the help of a balance scorecard and in that financial and other areas are
taken into account. The evaluation of the companies is made and in that ratio analysis is also
used. There is a profitability analysis and it is identified that the performance of Cathay is on
the upper level. The consideration of horizontal and vertical analysis is also made by which
the additional aspects are covered and all of the calculations have been provided in the report
for better understanding.

3
Table of Contents
Executive summary....................................................................................................................2
Introduction................................................................................................................................4
Analysis of SkyWest airlines.....................................................................................................4
Balance scorecard...................................................................................................................4
Profitability ratios...................................................................................................................5
Liquidity ratios.......................................................................................................................5
Efficiency ratios.....................................................................................................................6
Capital structure ratios...........................................................................................................6
Horizontal analysis.................................................................................................................7
Vertical analysis.....................................................................................................................7
Analysis of Cathay pacific.........................................................................................................8
Balance scorecard...................................................................................................................8
Profitability ratios...................................................................................................................8
Liquidity ratios.......................................................................................................................9
Efficiency ratios.....................................................................................................................9
Capital structure ratios...........................................................................................................9
Horizontal analysis...............................................................................................................10
Vertical analysis...................................................................................................................10
Comparison of SkyWest and Cathay pacific...........................................................................11
Conclusion................................................................................................................................11
References................................................................................................................................12
Appendix..................................................................................................................................14
Appendix 1...........................................................................................................................14
Appendix 2...........................................................................................................................20

4
Introduction
The financial analysis is required to be performed in which various aspects are needed
to be evaluated. There will be consideration of non-financial as well as financial aspects for
the proper analyzation of the position and performance. In this report, the information in
relation to the SkyWest airlines and Cathay pacific will be taken into account. The balanced
scorecard will be undertaken for both and in that there will be consideration of all the four
perspectives that will be made. Financial aspects will be tested with the help of ratio analysis
in which the profitability, efficiency, liquidity and capital structure ratios will be taken into
account. On the basis of all of them, there will be proper comparison which will be made
among both the companies. The proper description with the required calculations is provided
in the report below.
Analysis of SkyWest airlines
Balance scorecard
The performance of the company is required to be measured in an appropriate manner
and for that several tools are taken into consideration. The one which can be used for the non-
financial parameters is balance scorecard approach. In this, there is mainly four perspectives
which are focused upon and they cover the following:
Customer perspective: The services are provided to the consumers and it is highly
required that quality is maintained and they shall be provided in such manner by which the
highest level of satisfaction will be ensured (Kaplan, 2012). This is done appropriately in
SkyWest as 1633 people are involved in the consumer services and by that best services are
provided.
Internal business perspective: The processes in the internal management are
performed in a proper manner and it is ascertained as there are various new aircraft that are
added and by that fleet size is improved. With that those aircraft that were not operating
properly have been removed. The business is carried in such a manner by which efficiency
and sustainability are increased.
Learning and growth perspective: The growth of any airline is measured with the
flights that are completed in a successful manner (Grigoroudis et al., 2012). It is identified
Secure Best Marks with AI Grader
Need help grading? Try our AI Grader for instant feedback on your assignments.

5
that they are completed appropriately and timely manner. There is the use of advanced
technology and by that improvement is made possible.
Financial perspective: The financial position of the business is taken into account in
this section. It has been identified that there is an increase in the profits which has been
attained from $182 million in 2017 to $280 million in 2018. There is also an increase in
revenue by 3.2% in 2018 in comparison to 2017. This shows that financial performance is
maintained effectively.
Profitability ratios
The ratio analysis is made and in that the profitability of the business is evaluated. For
that, the various profits which are made are compared with the sales so that the margin which
is made by the company can be ascertained (Innocent et al., 2013). In this, there are various
ratios that can be calculated and they are provided below.
Particulars Formula 2017 2018
Operating profit margin Operating profit/sales *100 12.43% 14.72%
Net profit margin Net profit/sales *100 13.74% 8.70%
Return on capital employed Net profit/capital employed
*100
9.22% 5.20%
The profitability of the company is increasing in terms of operating profit but there is
a decline which is made in the net profit and the return which is made on capital employed.
This shows that the company is required to make the improvement and for that, the cost
which is incurred on the sold goods will have to be reduced as the same is high in the current
period.
Liquidity ratios
The business is required to make the payment of all the obligations on time and for
that, the liquidity is required to be evaluated so that it can be maintained in an effective
manner (Drake & Fabozzi, 2012). In this, the current assets which are available will be
considered and compared with the liabilities to be met.
Particulars Formula 201
7
2018
Current
ratio
Current asset/current liabilities 1.21 1.10

6
Quick ratio Quick asset/current liabilities 1.07 0.97
The current ratio is declining from 1.21 to 1.1 which shows that the liquidity is
reducing and it is below the standard which is set at the 2 (Morningstar, 2019). The quick
ratio is also declining from 1.07 to 0.97 but then also it is near the standard and the company
will be able to meet the liabilities.
Efficiency ratios
The various assets and resources are involved in the business and it is required that
they are used in the most effective manner. For the ascertainment of the same, there is the
need to calculate the efficiency ratios.
Particulars Formula 2017 2018
Total asset turnover Revenue/total
assets
0.57 0.51
Fixed asset turnover Sales/fixed assets 0.75 0.64
The total asset turnover ratio is calculated which shows the efficiency of the total
assets to generate the revenue and with that fixed asset turnover is also calculated. It is
identified that both the ratios are declining and this shows that management is not using the
available assets in an effective and efficient manner and there is the need to make
improvements.
Capital structure ratios
The business requires funds and for that various sources are used which together form
the capital structure (Ally, 2013). It is required that the same shall be maintained properly and
for that capital structure ratio is calculated in which all the required aspects are covered.
Particulars Formula 201
7
2018
Debt to equity ratio Long term debt/ Total equity 1.36 1.43
Interest cover EBIT/Interest expense 3.70 3.94
The debt to equity ratio is increasing which shows that the amount of the debt in
comparison to equity is rising and this is not beneficial for the company. With this, the

7
interest expenses rise and due to that, the expense of the company is increased. The interest
cover is calculated and that is rising which is beneficial as the company will be able to meet
the interest obligation on time.
Horizontal analysis
The horizontal analysis is performed in which the change which is taking place with
the duration is ascertained. In this, the comparison between various years is made so that the
increase and decrease can be identified. This has been performed for the company and in that
analysis is performed for both the balance sheet and income statement is made. All the
calculations are provided in appendix 1.
In the analysis, it is identified that there is an increase in the total assets which are
maintained by the company. The highest amount of the increase has been identified in the
amount of cash and receivables which are involved (Bolfek et al., 2012). The investment
which is taking place in the short term is reducing and this shows that the investment has not
been made in the current year. The total non-current assets are increased. The property which
is maintained is rising and there is the purchase which is made in the current year. The
liabilities are also increasing and in that account, payables are also rising. The long term
debts which are involved in the business are also rising for the meeting of the requirement of
funds. There is also the rise in equity as the issue of the shares is made in a proper manner. It
is increasing by 11.97% which is a considerable rise.
The profitability analysis is also made and in that it is determined that the net amount
of the profit is decreasing. The gross profit of the company is increasing by 8.67% and with
that, the cost of goods sold is also increasing. The other indirect expenses which are incurred
are decreasing with time. The finance cost is increasing and also the amount of tax which is
made is increasing and with that, there is a decline in the number of profits.
Vertical analysis
In the vertical analysis, the evaluation within a single year is made by taking the total
asset as the base figure and then the contribution by the other elements in relation to the same
is identified. The calculation is made and the same is represented in Appendix 2. It is
determined that the non-current assets hold 81.77% of the total assets and remaining is in the
current assets (SkyWest, 2018). The fixed asset holds the greatest portion in the non-current
Paraphrase This Document
Need a fresh take? Get an instant paraphrase of this document with our AI Paraphraser

8
asset and that shows the company is making an investment in the fixed assets of the
company. The liabilities hold 67.86% in which debt consumers the most liabilities. There is
the proper maintenance that is made and by that the proper structure is managed.
Analysis of Cathay pacific
Balance scorecard
The balance scorecard analysis will also be made for the Cathay pacific and in that
also all the perspectives will be covered. It is identified in the financial terms that there is an
increase in the revenue and profit which is maintained and that shows the positive financial
growth of the company.
There are various new ideas which are used and by that the level of customer
satisfaction is improving. The quality of the services which are provided is made better by the
improvement in productivity (Hansen & Schaltegger, 2016). There is more expenditure
which is made on customer services making it better.
The learning and growth perspectives are considered and in that it is ascertained that
there is an increase in the flights and that the growth is attained as the revenue increases.
Most of the flights are completed and the completion rate is good. This shows that the
company is operating successfully.
The internal business process of the company is strong as all the activities are
maintained in a proper manner (Northcott & Ma'amora Taulapapa, 2012). There is the use of
the best technology and the number of fleets and its size has been increased.
Profitability ratios
The profit is the core aim of the business and for that, it has to be maintained
appropriately. There are various factors that affect the same and they need to be considered.
Particulars Formula 2017 2018
Operating profit margin Operating profit/sales *100 -1.49% 3.24%
Net profit margin Net profit/sales *100 -1.29% 2.11%
Return on capital employed Net profit/capital employed *100 -0.86% 1.65%

9
The profitability position is improving as there is a rise in the profits and the losses
which have been made in 2017 have been converted to the profits in a given period. It can be
noted that there are profits which are made in the current period and for that higher amount of
sales is made.
Liquidity ratios
The obligations arise in the business and they are to be maintained appropriately in
the manner that all the payments are made on time (Uyar & Kilic, 2012). For this, the current
and quick ratios are calculated.
Particulars Formula 201
7
2018
Current
ratio
Current asset/current liabilities 0.80 0.61
Quick ratio Quick asset/current liabilities 0.76 0.57
The current ratio and quick ratio both are decreasing and this is because of the
decrease in the amount of the current asset and increase in the liability. This has caused an
adverse impact on the liquidity position of the business and improvement will be required to
be made.
Efficiency ratios
The efficiency of the management in using the asset is tested with the help of these
ratios and they will be providing the revenue which is made with the help of those assets.
Particulars Formula 2017 2018
Total asset turnover Revenue/total
assets
0.52 0.58
Fixed asset turnover Sales/fixed assets 0.87 0.95
The total asset turnover and fixed asset turnover is calculated and they both are
increasing in the current year. This shows that management is efficient and is able to generate
revenue with the help of assets. It is able to use them properly in all situations.

10
Capital structure ratios
The management of the capital structure shall be strong as that is an important aspect.
For this the debt and equity will have to be balanced in such a manner that no extra burden is
made on the company and operations can also be performed effectively (Khaliq et al., 2014).
Particulars Formula 2017 2018
Debt to equity ratio Long term debt/ Total
equity
1.13 0.94
Interest cover EBIT/Interest expense -0.65 1.46
There is a decrease in the debt to equity ratio and that represents a decline in the
amount of the debt which is maintained by the company. This is beneficial as the cost which
is associated with the debt will be reduced and thereby increasing the profits. The interest
cover is also rising which shows that the interest of the company will be covered by the
income in a proper manner.
Horizontal analysis
The horizontal analysis is performed and in that the comparison between the two
years is made. In this, the increases from the past year are ascertained and it is identified that
there is a decline in the current assets that are maintained by the company and the derivative
investment is increasing greatly. There is an increase in the inventory which is made and that
is at the rate of 20.66%. The total liabilities have declined a little but the accounts payable are
increasing. The equity balance has increased and this shows that the share of the company has
been issued to raise the funds.
The gross profit of the company has increased widely and there is a rise in the revenue
also which is made by the company. The increase in the cost of goods sold is lower than that
of the revenue and due to that the gross profit is rising (Crespo et al., 2014). There is an
increase in the profits and that is due to a decline in the expenses which are made. This shows
that there is an increase in the position and performance of the company.
Vertical analysis
In the analysis, it is derived that property and plant hold the highest value of the total
assets. There is an increase in the total assets and they will be used for the benefit of the
Secure Best Marks with AI Grader
Need help grading? Try our AI Grader for instant feedback on your assignments.

11
company. The vertical analysis identifies the percentage of the assets and liabilities in
comparison to the total assets. The same has been made and in that, there is 67.47% which is
the aspect of total liabilities in the company (Cathay pacific, 2018). The long term debts are
36.9% which is a reasonable amount and the company will be able to bear the expenses in
relation to the same. It can be said that there is a proper balance that is maintained among all
the assets and liabilities.
Comparison of SkyWest and Cathay pacific
The calculations have been made and in that the various aspects of both the airlines
have been undertaken. It is identified that in overall terms the performance and position of
Cathay pacific are better than the SkyWest as there is an increase in the profitability in
Cathay which is not there for the SkyWest. In addition to this, the liquidity is also maintained
by Cathay and will be able to meet with the liabilities effectively. The management of the
company is strong and will be using the assets and liabilities in the most effective manner.
They will be using the same in such a manner that the maximum amount of gains will be
attained. The amount of the debt is more in SkyWest which is not a positive aspect as that
will increase the interest expense. The amount of debt is lower in Cathay and that makes the
position stronger in that company. There is an appropriate level of the capital structure that is
maintained and this is identified in the horizontal and vertical analysis. The increase in assets
is identified in Cathay and that will be beneficial to attain the growth.
By taking all of the aspects into consideration the position of Cathay is better and will
be operating in a proper manner.
Conclusion
The financial analysis has been performed and in that there is the use of various tools
and techniques which are made. The balanced scorecard is undertaken and in that, all the four
aspects of both the companies have been taken into account. There is the identification of the
proper performance of both of them to make them successful. There is the ratio analysis that
is performed and in that, all of the calculations have been made to cover all the areas of
business. The profitability, efficiency, liquidity and capital structure of the company are
analyzed. There is the use of horizontal and vertical analysis also in which the comparison
with the past period is made and with all that the company who is performing well is
identified.

12

13
References
Morningstar. (2019). SkyWest Inc. SKYW. Retrieved from:
https://www.morningstar.com/stocks/xnas/skyw/financials
Morningstar. (2019). Cathay Pacific Airways Ltd. Retrieved from:
https://www.morningstar.com/stocks/pinx/cpcaf/financials
SkyWest. (2018). Annual report 2018. Retrieved from:
http://www.annualreports.com/HostedData/AnnualReports/PDF/NASDAQ_SKYW_2
018.pdf
Cathay pacific. (2018). Annual report 2018. Retrieved from:
https://www.cathaypacific.com/content/dam/cx/about-us/investor-relations/interim-
annual-reports/en/2018_annual_report_en.pdf
Kaplan, R. S. (2012). The balanced scorecard: comments on balanced scorecard
commentaries. Journal of Accounting & Organizational Change, 8(4), 539-545.
Grigoroudis, E., Orfanoudaki, E. & Zopounidis, C. (2012). Strategic performance
measurement in a healthcare organisation: A multiple criteria approach based on
balanced scorecard. Omega, 40(1), pp.104-119.
Innocent, E. C., Mary, O. I., & Matthew, O. M. (2013). Financial ratio analysis as a
determinant of profitability in Nigerian pharmaceutical industry. International journal
of business and management, 8(8), 107.
Drake, P.P. & Fabozzi, F.J. (2012) Financial ratio analysis. Encyclopedia of Financial
Models.
Ally, Z. (2013) Comparative analysis of financial performance of commercial banks in
Tanzania. Research Journal of Finance and Accounting, 4(19), pp.133-143.
Bolfek, B., Stanić, M. & Knežević, S. (2012) Vertical and Horizontal Financial Statement
Analysis. Ekonomski vjesnik: Review of Contemporary Entrepreneurship, Business,
and Economic Issues, 25(1), pp.146-167.
Paraphrase This Document
Need a fresh take? Get an instant paraphrase of this document with our AI Paraphraser

14
Hansen, E. G., & Schaltegger, S. (2016). The sustainability balanced scorecard: A systematic
review of architectures. Journal of Business Ethics, 133(2), 193-221.
Northcott, D. & Ma'amora Taulapapa, T. (2012) Using the balanced scorecard to manage
performance in public sector organizations: Issues and challenges. International
Journal of Public Sector Management, 25(3), pp.166-191.
Uyar, A., & Kilic, M. (2012). The influence of firm characteristics on disclosure of financial
ratios in annual reports of Turkish firms listed in the Istanbul Stock
Exchange. International Journal of Accounting, Auditing and Performance
Evaluation, 8(2), 137-156.
Khaliq, A., Altarturi, B. H. M., Thaker, H. M. T., Harun, M. Y., & Nahar, N. (2014).
Identifying Financial distress firms: a case study of Malaysia’s government linked
companies (GLC). International Journal of Economics, Finance and
Management, 3(3).
Crespo, C. F., Griffith, D. A., & Lages, L. F. (2014). The performance effects of vertical and
horizontal subsidiary knowledge outflows in multinational corporations. International
Business Review, 23(5), 993-1007.

15
Appendix
Appendix 1
Horizontal analysis
Balance sheet
Name 2018 2017 Increase /
decrease
Chang
e in %
Total Assets 6,313,2
12,000
5,458,2
79,000
85493300
0
15.66%
Total Current Assets 1,020,7
94,000
995,133
,000
25661000 2.58%
Cash, Cash Equivalents and Short Term
Investments
689,329
,000
685,295
,000
4034000 0.59%
Cash and Cash Equivalents 328,384
,000
181,792
,000
14659200
0
80.64%
Short Term Investments 360,945
,000
503,503
,000
-
14255800
0
-
28.31%
Inventories 127,690
,000
119,755
,000
7935000 6.63%
Trade and Other Receivables, Current 90,130,
000
48,047,
000
42083000 87.59%
Trade/Accounts Receivable, Current 64,194,
000
42,731,
000
21463000 50.23%
Taxes Receivable, Current 25,936,
000
5,316,0
00
20620000 387.89
%
Prepayments and Deposits, Current 87,031,
000
115,098
,000
-28067000 -
24.39%
Other Current Assets 26,614,
000
26,938,
000
-324000 -1.20%
Total Non-Current Assets 5,292,4
18,000
4,463,1
46,000
82927200
0
18.58%
Net Property, Plant and Equipment 5,005,7
44,000
4,183,0
03,000
82274100
0
19.67%
Gross Property, Plant and Equipment 6,767,4
72,000
5,650,4
78,000
11169940
00
19.77%
Properties 291,544
,000
265,608
,000
25936000 9.76%
Buildings and Improvements 291,544
,000
265,608
,000
25936000 9.76%
Machinery, Furniture and Equipment 6,475,9
28,000
5,384,8
70,000
10910580
00
20.26%
Flight, Fleet, Vehicle and Related
Equipment
6,475,9
28,000
5,384,8
70,000
10910580
00
20.26%
Accumulated Depreciation and
Impairment
-
1,761,7
-
1,467,4
-
29425300
20.05%

16
28,000 75,000 0
Accumulated Depreciation -
1,761,7
28,000
-
1,467,4
75,000
-
29425300
0
20.05%
Prepayments and Deposits, Non-Current 181,830
,000
230,923
,000
-49093000 -
21.26%
Prepayments, Non-Current 181,830
,000
230,923
,000
-49093000 -
21.26%
Other Non-Current Assets 104,844
,000
49,220,
000
55624000 113.01
%
Total Liabilities 4,348,9
31,000
3,703,9
57,000
64497400
0
17.41%
Total Current Liabilities 924,826
,000
820,825
,000
10400100
0
12.67%
Payables and Accrued Expenses, Current 509,612
,000
462,499
,000
47113000 10.19%
Trade and Other Payables, Current 348,006
,000
308,132
,000
39874000 12.94%
Trade/Accounts Payable, Current 331,982
,000
288,904
,000
43078000 14.91%
Taxes Payable, Current 16,024,
000
19,228,
000
-3204000 -
16.66%
Accrued Expenses, Current 161,606
,000
154,367
,000
7239000 4.69%
Financial Liabilities, Current 350,206
,000
309,678
,000
40528000 13.09%
Current Debt and Capital Lease
Obligation
350,206
,000
309,678
,000
40528000 13.09%
Current Portion of Long Term Debt
and Capital Lease
350,206
,000
309,678
,000
40528000 13.09%
Current Portion of Long Term Debt 350,206
,000
309,678
,000
40528000 13.09%
Current Debt
Other Current Liabilities 65,008,
000
48,648,
000
16360000 33.63%
Total Non-Current Liabilities 3,424,1
05,000
2,883,1
32,000
54097300
0
18.76%
Financial Liabilities, Non-Current 2,809,7
68,000
2,377,3
46,000
43242200
0
18.19%
Long Term Debt and Capital Lease
Obligation
2,809,7
68,000
2,377,3
46,000
43242200
0
18.19%
Long Term Debt 2,809,7
68,000
2,377,3
46,000
43242200
0
18.19%
Tax Liabilities, Non-Current 518,159
,000
419,020
,000
99139000 23.66%
Deferred Tax Liabilities, Non-Current 518,159
,000
419,020
,000
99139000 23.66%
Deferred Liabilities, Non-Current 29,308,
000
44,225,
000
-14917000 -
33.73%
Secure Best Marks with AI Grader
Need help grading? Try our AI Grader for instant feedback on your assignments.

17
Other Deferred Liabilities, Non-Current 29,308,
000
44,225,
000
-14917000 -
33.73%
Deferred Income/Customer
Advances/Billings in Excess of Cost, Non-
Current
Other Non-Current Liabilities 66,870,
000
42,541,
000
24329000 57.19%
Total Equity 1,964,2
81,000
1,754,3
22,000
20995900
0
11.97%
Equity Attributable to Parent Stockholders 1,964,2
81,000
1,754,3
22,000
20995900
0
11.97%
Paid in Capital 187,728
,000
237,415
,000
-49687000 -
20.93%
Capital Stock 690,910
,000
672,593
,000
18317000 2.72%
Common Stock 690,910
,000
672,593
,000
18317000 2.72%
Common Stock, without Par Value 690,910
,000
672,593
,000
18317000 2.72%
Preferred Stock 0 0 0
Additional Paid in Capital/Share
Premium
Treasury Stock -
503,182
,000
-
435,178
,000
-68004000 15.63%
Retained Earnings/Accumulated Deficit 1,776,5
85,000
1,516,9
57,000
25962800
0
17.12%
Reserves/Accumulated Comprehensive
Income/Losses
-32,000 -50,000 18000 -
36.00%
Income statement
Name 2018 2017 Increase
/decrease
Change
in %
Gross Profit 747,106,0
00
687,502,0
00
59604000 8.67%
Total Revenue 32216790
00.
3,204,268,
000
17411000 0.54%
Business Revenue 3,221,679,
000
3,204,268,
000
17411000 0.54%
Cost of Revenue -
2,474,573,
000
-
2,516,766,
000
42193000 -1.68%
Cost of Goods and Services -
109,605,0
00
-
69,848,00
0
-39757000 56.92%
Rent and Landing Fees, Cost of
Revenue
-
154,945,0
-
215,807,0
60862000 -28.20%

18
00 00
Purchased Fuel, Power and Gas -
117,657,0
00
-
162,653,0
00
44996000 -27.66%
Operation Maintenance and
Repairs
-
556,259,0
00
-
579,463,0
00
23204000 -4.00%
Staff Cost, Cost of Revenue -
1,201,518,
000
-
1,196,227,
000
-5291000 0.44%
Depreciation & Amortization,
Cost of Revenue
-
334,589,0
00
-
292,768,0
00
-41821000 14.28%
Operating Income/Expenses -
272,826,0
00
-
299,303,0
00
26477000 -8.85%
Other Income/Expense, Operating -
272,826,0
00
-
299,303,0
00
26477000 -8.85%
Other Expenses, Operating -
272,826,0
00
-
299,303,0
00
26477000 -8.85%
Total Operating Profit/Loss 474,280,0
00
388,199,0
00
86081000 22.17%
Non-Operating Income/Expenses,
Total
-
107,966,0
00
-
100,016,0
00
-7950000 7.95%
Total Net Finance Income/Expense -
111,586,0
00
-
100,416,0
00
-11170000 11.12%
Net Interest Income/Expense -
111,586,0
00
-
100,416,0
00
-11170000 11.12%
Interest Expense Net of
Capitalized Interest
-
120,409,0
00
-
104,925,0
00
-15484000 14.76%
Interest Income 8,823,000 4,509,000 4314000 95.68%
Other Income/Expense, Non-
Operating
3,620,000 400,000 3220000 805.00%
Pretax Income 366,314,0
00
288,183,0
00
78131000 27.11%
Provision for Income Tax -
85,942,00
0
140,724,0
00
-226666000 -161.07%
Net Income from Continuing
Operations
280,372,0
00
428,907,0
00
-148535000 -34.63%
Vertical analysis:

19
Vertical analysis
Vertical analysis
Paraphrase This Document
Need a fresh take? Get an instant paraphrase of this document with our AI Paraphraser

20
Balance sheet
Name 2018 2017 2018 2017
Total Assets 6,313,21
2,000
5,458,27
9,000
100.0
0%
100.0
0%
Total Current Assets 1,020,79
4,000
995,133,
000
16.17
%
18.23
%
Cash, Cash Equivalents and Short Term
Investments
689,329,
000
685,295,
000
10.92
%
12.56
%
Cash and Cash Equivalents 328,384,
000
181,792,
000
5.20
%
3.33
%
Short Term Investments 360,945,
000
503,503,
000
5.72
%
9.22
%
Inventories 127,690,
000
119,755,
000
2.02
%
2.19
%
Trade and Other Receivables, Current 90,130,0
00
48,047,0
00
1.43
%
0.88
%
Trade/Accounts Receivable, Current 64,194,0
00
42,731,0
00
1.02
%
0.78
%
Taxes Receivable, Current 25,936,0
00
5,316,00
0
0.41
%
0.10
%
Prepayments and Deposits, Current 87,031,0
00
115,098,
000
1.38
%
2.11
%
Other Current Assets 26,614,0
00
26,938,0
00
0.42
%
0.49
%
Total Non-Current Assets 5,292,41
8,000
4,463,14
6,000
83.83
%
81.77
%
Net Property, Plant and Equipment 5,005,74
4,000
4,183,00
3,000
79.29
%
76.64
%
Gross Property, Plant and Equipment 6,767,47
2,000
5,650,47
8,000
107.2
0%
103.5
2%
Properties 291,544,
000
265,608,
000
4.62
%
4.87
%
Buildings and Improvements 291,544,
000
265,608,
000
4.62
%
4.87
%
Machinery, Furniture and Equipment 6,475,92
8,000
5,384,87
0,000
102.5
8%
98.66
%
Flight, Fleet, Vehicle and Related
Equipment
6,475,92
8,000
5,384,87
0,000
102.5
8%
98.66
%
Accumulated Depreciation and Impairment -
1,761,72
8,000
-
1,467,47
5,000
-
27.91
%
-
26.89
%
Accumulated Depreciation -
1,761,72
8,000
-
1,467,47
5,000
-
27.91
%
-
26.89
%
Prepayments and Deposits, Non-Current 181,830,
000
230,923,
000
2.88
%
4.23
%
Prepayments, Non-Current 181,830, 230,923, 2.88 4.23

21
000 000 % %
Other Non-Current Assets 104,844,
000
49,220,0
00
1.66
%
0.90
%
Total Liabilities 4,348,93
1,000
3,703,95
7,000
68.89
%
67.86
%
Total Current Liabilities 924,826,
000
820,825,
000
14.65
%
15.04
%
Payables and Accrued Expenses, Current 509,612,
000
462,499,
000
8.07
%
8.47
%
Trade and Other Payables, Current 348,006,
000
308,132,
000
5.51
%
5.65
%
Trade/Accounts Payable, Current 331,982,
000
288,904,
000
5.26
%
5.29
%
Taxes Payable, Current 16,024,0
00
19,228,0
00
0.25
%
0.35
%
Accrued Expenses, Current 161,606,
000
154,367,
000
2.56
%
2.83
%
Financial Liabilities, Current 350,206,
000
309,678,
000
5.55
%
5.67
%
Current Debt and Capital Lease Obligation 350,206,
000
309,678,
000
5.55
%
5.67
%
Current Portion of Long Term Debt and
Capital Lease
350,206,
000
309,678,
000
5.55
%
5.67
%
Current Portion of Long Term Debt 350,206,
000
309,678,
000
5.55
%
5.67
%
Current Debt
Other Current Liabilities 65,008,0
00
48,648,0
00
1.03
%
0.89
%
Total Non-Current Liabilities 3,424,10
5,000
2,883,13
2,000
54.24
%
52.82
%
Financial Liabilities, Non-Current 2,809,76
8,000
2,377,34
6,000
44.51
%
43.55
%
Long Term Debt and Capital Lease Obligation 2,809,76
8,000
2,377,34
6,000
44.51
%
43.55
%
Long Term Debt 2,809,76
8,000
2,377,34
6,000
44.51
%
43.55
%
Tax Liabilities, Non-Current 518,159,
000
419,020,
000
8.21
%
7.68
%
Deferred Tax Liabilities, Non-Current 518,159,
000
419,020,
000
8.21
%
7.68
%
Deferred Liabilities, Non-Current 29,308,0
00
44,225,0
00
0.46
%
0.81
%
Other Deferred Liabilities, Non-Current 29,308,0
00
44,225,0
00
0.46
%
0.81
%
Deferred Income/Customer Advances/Billings
in Excess of Cost, Non-Current
Other Non-Current Liabilities 66,870,0
00
42,541,0
00
1.06
%
0.78
%
Total Equity 1,964,28 1,754,32 31.11 32.14

22
1,000 2,000 % %
Equity Attributable to Parent Stockholders 1,964,28
1,000
1,754,32
2,000
31.11
%
32.14
%
Paid in Capital 187,728,
000
237,415,
000
2.97
%
4.35
%
Capital Stock 690,910,
000
672,593,
000
10.94
%
12.32
%
Common Stock 690,910,
000
672,593,
000
10.94
%
12.32
%
Common Stock, without Par Value 690,910,
000
672,593,
000
10.94
%
12.32
%
Preferred Stock 0 0
Additional Paid in Capital/Share Premium
Treasury Stock -
503,182,
000
-
435,178,
000
-
7.97
%
-
7.97
%
Retained Earnings/Accumulated Deficit 1,776,58
5,000
1,516,95
7,000
28.14
%
27.79
%
Reserves/Accumulated Comprehensive
Income/Losses
-32,000 -50,000 0.00
%
0.00
%
Appendix 2
Horizontal analysis
Balance sheet
Name 2018 2017 Increase
/decrease
Chang
e in %
Total Assets 190,294,
000,000
188,378,
000,000
19160000
00
1.02%
Total Current Assets 29,618,0
00,000
32,835,0
00,000
-
32170000
00
-9.80%
Cash, Cash Equivalents and Short Term
Investments
15,315,0
00,000
19,094,0
00,000
-
37790000
00
-
19.79
%
Short Term Investments 15,315,0
00,000
19,094,0
00,000
-
37790000
00
-
19.79
%
Other Short Term Investments 15,315,0
00,000
19,094,0
00,000
-
37790000
00
-
19.79
%
Cash and Cash Equivalents
Derivative Investment and Hedging Assets,
Current
499,000,
000
32,000,0
00
46700000
0
1459.3
8%
Inventories 1,828,00
0,000
1,515,00
0,000
31300000
0
20.66
%
Trade and Other Receivables, Current 11,976,0 11,329,0 64700000 5.71%
Secure Best Marks with AI Grader
Need help grading? Try our AI Grader for instant feedback on your assignments.
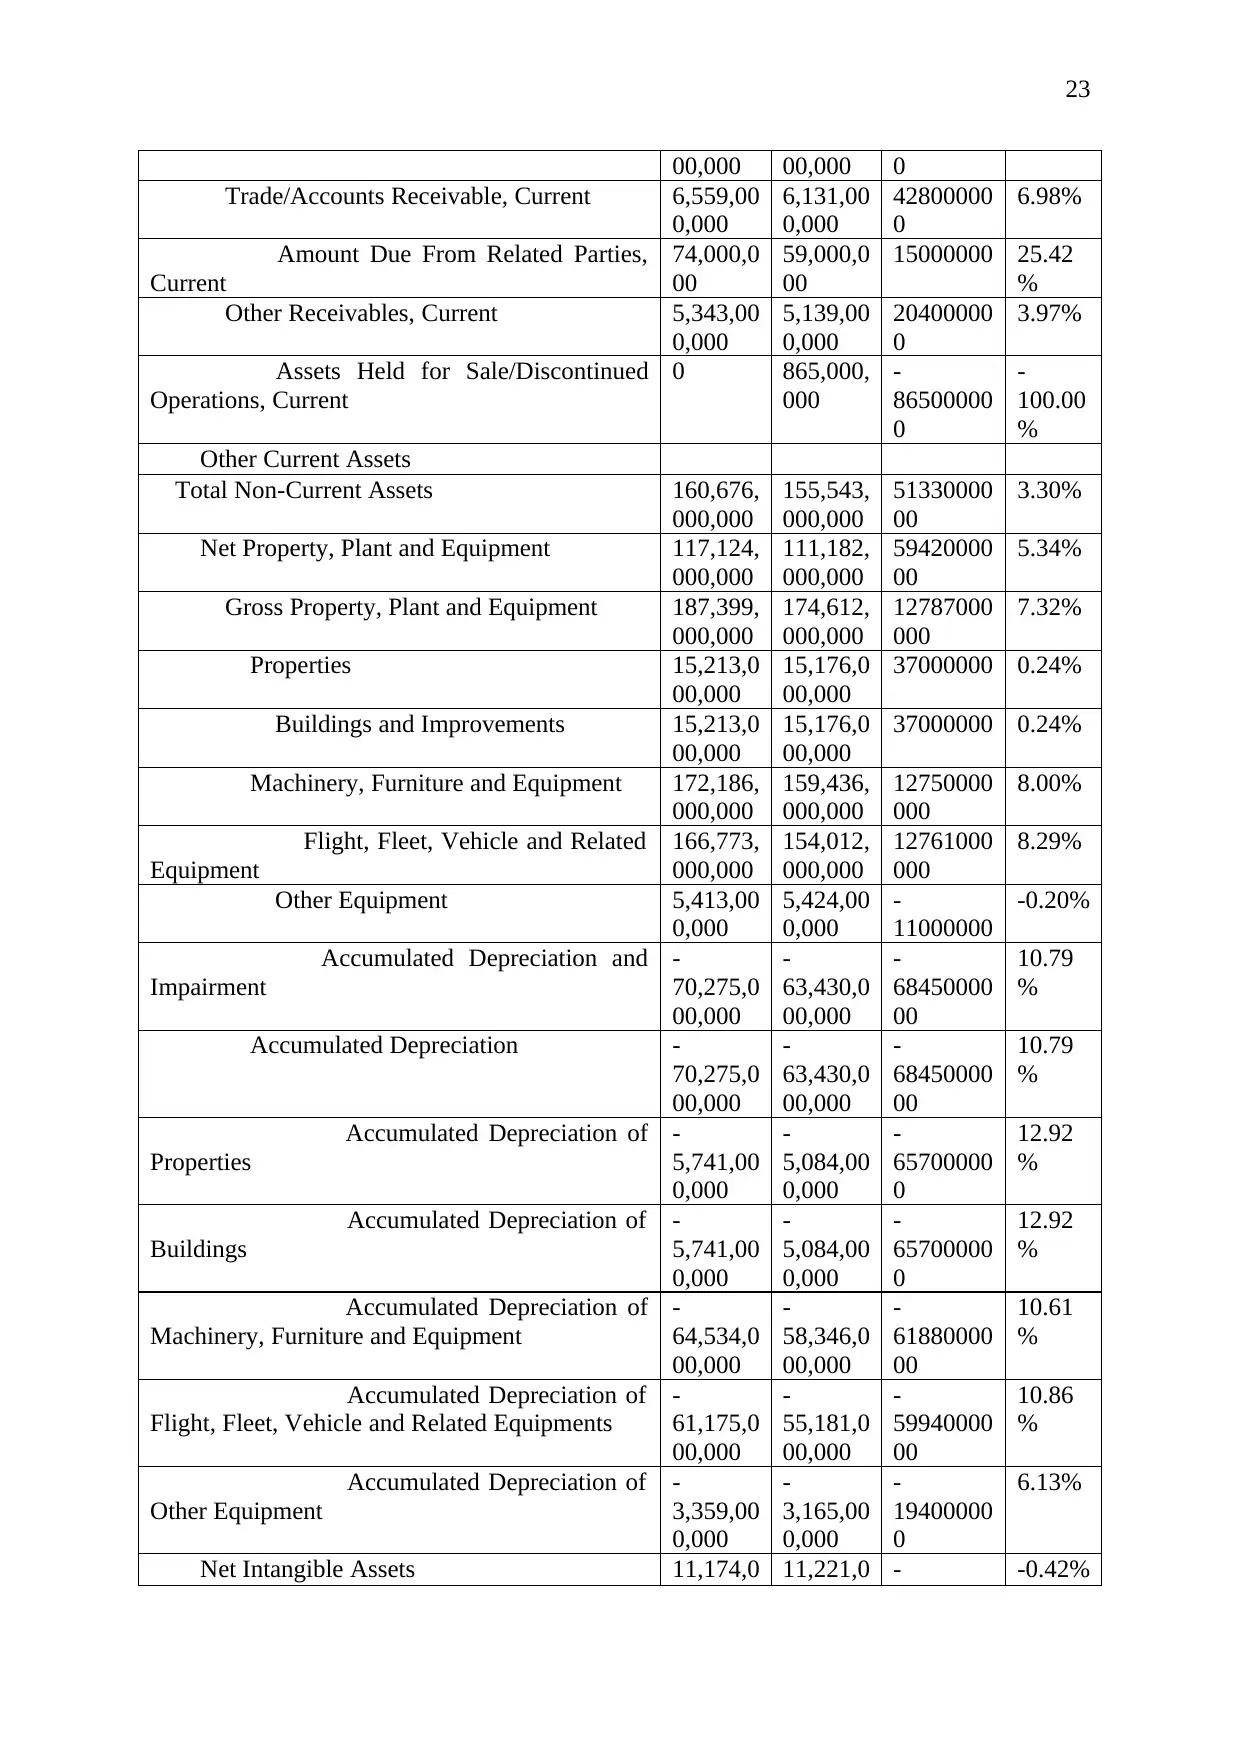
23
00,000 00,000 0
Trade/Accounts Receivable, Current 6,559,00
0,000
6,131,00
0,000
42800000
0
6.98%
Amount Due From Related Parties,
Current
74,000,0
00
59,000,0
00
15000000 25.42
%
Other Receivables, Current 5,343,00
0,000
5,139,00
0,000
20400000
0
3.97%
Assets Held for Sale/Discontinued
Operations, Current
0 865,000,
000
-
86500000
0
-
100.00
%
Other Current Assets
Total Non-Current Assets 160,676,
000,000
155,543,
000,000
51330000
00
3.30%
Net Property, Plant and Equipment 117,124,
000,000
111,182,
000,000
59420000
00
5.34%
Gross Property, Plant and Equipment 187,399,
000,000
174,612,
000,000
12787000
000
7.32%
Properties 15,213,0
00,000
15,176,0
00,000
37000000 0.24%
Buildings and Improvements 15,213,0
00,000
15,176,0
00,000
37000000 0.24%
Machinery, Furniture and Equipment 172,186,
000,000
159,436,
000,000
12750000
000
8.00%
Flight, Fleet, Vehicle and Related
Equipment
166,773,
000,000
154,012,
000,000
12761000
000
8.29%
Other Equipment 5,413,00
0,000
5,424,00
0,000
-
11000000
-0.20%
Accumulated Depreciation and
Impairment
-
70,275,0
00,000
-
63,430,0
00,000
-
68450000
00
10.79
%
Accumulated Depreciation -
70,275,0
00,000
-
63,430,0
00,000
-
68450000
00
10.79
%
Accumulated Depreciation of
Properties
-
5,741,00
0,000
-
5,084,00
0,000
-
65700000
0
12.92
%
Accumulated Depreciation of
Buildings
-
5,741,00
0,000
-
5,084,00
0,000
-
65700000
0
12.92
%
Accumulated Depreciation of
Machinery, Furniture and Equipment
-
64,534,0
00,000
-
58,346,0
00,000
-
61880000
00
10.61
%
Accumulated Depreciation of
Flight, Fleet, Vehicle and Related Equipments
-
61,175,0
00,000
-
55,181,0
00,000
-
59940000
00
10.86
%
Accumulated Depreciation of
Other Equipment
-
3,359,00
0,000
-
3,165,00
0,000
-
19400000
0
6.13%
Net Intangible Assets 11,174,0 11,221,0 - -0.42%

24
00,000 00,000 47000000
Gross Goodwill and Other Intangible
Assets
14,533,0
00,000
14,146,0
00,000
38700000
0
2.74%
Goodwill 7,666,00
0,000
7,666,00
0,000
0 0.00%
Intangibles other than Goodwill 6,867,00
0,000
6,480,00
0,000
38700000
0
5.97%
Software and Technology 6,828,00
0,000
6,227,00
0,000
60100000
0
9.65%
Other Intangible Assets 39,000,0
00
253,000,
000
-
21400000
0
-
84.58
%
Accumulated Amortization and
Impairment
-
3,359,00
0,000
-
2,925,00
0,000
-
43400000
0
14.84
%
Accumulated Amortization of
Intangible Assets
-
3,359,00
0,000
-
2,925,00
0,000
-
43400000
0
14.84
%
Accumulated Amortization of
Intangibles other than Goodwill
-
3,359,00
0,000
-
2,925,00
0,000
-
43400000
0
14.84
%
Accumulated Amortization of
Software and Technology
-
3,342,00
0,000
-
2,793,00
0,000
-
54900000
0
19.66
%
Accumulated Amortization of
Other Intangible Assets
-
17,000,0
00
-
132,000,
000
11500000
0
-
87.12
%
Accumulated Impairment of Intangible
Assets
0 0 0 0.00%
Accumulated Impairment of
Goodwill
0 0 0 0.00%
Total Long Term Investments 28,335,0
00,000
28,866,0
00,000
-
53100000
0
-1.84%
Long Term Equity Investments 27,570,0
00,000
28,866,0
00,000
-
12960000
00
-4.49%
Investments in Associates 27,570,0
00,000
28,144,0
00,000
-
57400000
0
-2.04%
Investments in Other Ventures under
Equity Method
722,000,
000
Investment in Financial Assets, Non-
Current
765,000,
000
Financial Assets Designated as Fair
Value Through Profit or Loss, Non-Current
742,000,
000
Financial Investment Securities,
Available-for-Sale & Held-to-Maturity, Non-
Current
23,000,0
00

25
Available-for-Sale Securities, Non-
Current
23,000,0
00
Derivative Investment and Hedging Assets,
Non-Current
1,860,00
0,000
1,781,00
0,000
79000000 4.44%
Trade and Other Receivables, Non-Current 217,000,
000
246,000,
000
-
29000000
-
11.79
%
Loans Receivable, Non-Current 217,000,
000
246,000,
000
-
29000000
-
11.79
%
Trade/Accounts Receivable, Non-Current
Prepayments and Deposits, Non-Current 1,173,00
0,000
1,215,00
0,000
-
42000000
-3.46%
Prepayments, Non-Current 1,173,00
0,000
1,215,00
0,000
-
42000000
-3.46%
Deferred Tax Assets, Non-Current 793,000,
000
928,000,
000
-
13500000
0
-
14.55
%
Pension and Other Employee Benefits, Non-
Current
0 104,000,
000
-
10400000
0
-
100.00
%
Other Non-Current Assets
Total Liabilities 126,355,
000,000
127,106,
000,000
-
75100000
0
-0.59%
Total Current Liabilities 48,345,0
00,000
41,278,0
00,000
70670000
00
17.12
%
Payables and Accrued Expenses, Current 19,384,0
00,000
15,371,0
00,000
40130000
00
26.11
%
Trade and Other Payables, Current 19,384,0
00,000
15,371,0
00,000
40130000
00
26.11
%
Trade/Accounts Payable, Current 6,801,00
0,000
5,112,00
0,000
16890000
00
33.04
%
Dividends Payable, Current 1,000,00
0
0 1000000
Amount Due to Related
Parties/Shareholders, Current
372,000,
000
334,000,
000
38000000 11.38
%
Taxes Payable, Current 1,193,00
0,000
1,372,00
0,000
-
17900000
0
-
13.05
%
Other Payable, Current 11,017,0
00,000
8,553,00
0,000
24640000
00
28.81
%
Financial Liabilities, Current 14,931,0
00,000
11,946,0
00,000
29850000
00
24.99
%
Current Debt and Capital Lease
Obligation
13,713,0
00,000
8,888,00
0,000
48250000
00
54.29
%
Current Debt 19,000,0
00
Bank Overdraft, Current Debt 19,000,0
Paraphrase This Document
Need a fresh take? Get an instant paraphrase of this document with our AI Paraphraser

26
00
Other Loans, Current Debt
Current Portion of Long Term Debt
and Capital Lease
13,694,0
00,000
8,888,00
0,000
48060000
00
54.07
%
Current Portion of Long Term Debt 9,734,00
0,000
4,823,00
0,000
49110000
00
101.82
%
Bank/Institutional Loans, Current
Portion of LT Debt
8,236,00
0,000
4,131,00
0,000
41050000
00
99.37
%
Other Current Portion of LT Debt 1,498,00
0,000
692,000,
000
80600000
0
116.47
%
Capital Lease Obligations, Current 3,960,00
0,000
4,065,00
0,000
-
10500000
0
-2.58%
Derivative and Hedging Liabilities,
Current
1,218,00
0,000
3,058,00
0,000
-
18400000
00
-
60.17
%
Deferred Liabilities, Current 14,030,0
00,000
13,961,0
00,000
69000000 0.49%
Deferred Income/Customer
Advances/Billings in Excess of Cost, Current
14,030,0
00,000
13,961,0
00,000
69000000 0.49%
Tax Liabilities, Current
Deferred Tax Liabilities, Current
Other Current Liabilities
Total Non-Current Liabilities 78,010,0
00,000
85,828,0
00,000
-
78180000
00
-9.11%
Financial Liabilities, Non-Current 61,024,0
00,000
70,037,0
00,000
-
90130000
00
-
12.87
%
Long Term Debt and Capital Lease
Obligation
60,183,0
00,000
69,506,0
00,000
-
93230000
00
-
13.41
%
Long Term Debt 40,952,0
00,000
49,071,0
00,000
-
81190000
00
-
16.55
%
Bank/Institutional Loans, Non-
Current
39,159,0
00,000
Other Loans, Non-Current 1,793,00
0,000
49,071,0
00,000
-
47278000
000
-
96.35
%
Capital Lease Obligations, Non-
Current
19,231,0
00,000
20,435,0
00,000
-
12040000
00
-5.89%
Derivative and Hedging Liabilities, Non-
Current
841,000,
000
531,000,
000
31000000
0
58.38
%
Provisions, Non-Current 473,000,
000
0 47300000
0
0.00%
Provision for Employee Entitlements,
Non-Current
473,000,
000
0 47300000
0
0.00%
00
Other Loans, Current Debt
Current Portion of Long Term Debt
and Capital Lease
13,694,0
00,000
8,888,00
0,000
48060000
00
54.07
%
Current Portion of Long Term Debt 9,734,00
0,000
4,823,00
0,000
49110000
00
101.82
%
Bank/Institutional Loans, Current
Portion of LT Debt
8,236,00
0,000
4,131,00
0,000
41050000
00
99.37
%
Other Current Portion of LT Debt 1,498,00
0,000
692,000,
000
80600000
0
116.47
%
Capital Lease Obligations, Current 3,960,00
0,000
4,065,00
0,000
-
10500000
0
-2.58%
Derivative and Hedging Liabilities,
Current
1,218,00
0,000
3,058,00
0,000
-
18400000
00
-
60.17
%
Deferred Liabilities, Current 14,030,0
00,000
13,961,0
00,000
69000000 0.49%
Deferred Income/Customer
Advances/Billings in Excess of Cost, Current
14,030,0
00,000
13,961,0
00,000
69000000 0.49%
Tax Liabilities, Current
Deferred Tax Liabilities, Current
Other Current Liabilities
Total Non-Current Liabilities 78,010,0
00,000
85,828,0
00,000
-
78180000
00
-9.11%
Financial Liabilities, Non-Current 61,024,0
00,000
70,037,0
00,000
-
90130000
00
-
12.87
%
Long Term Debt and Capital Lease
Obligation
60,183,0
00,000
69,506,0
00,000
-
93230000
00
-
13.41
%
Long Term Debt 40,952,0
00,000
49,071,0
00,000
-
81190000
00
-
16.55
%
Bank/Institutional Loans, Non-
Current
39,159,0
00,000
Other Loans, Non-Current 1,793,00
0,000
49,071,0
00,000
-
47278000
000
-
96.35
%
Capital Lease Obligations, Non-
Current
19,231,0
00,000
20,435,0
00,000
-
12040000
00
-5.89%
Derivative and Hedging Liabilities, Non-
Current
841,000,
000
531,000,
000
31000000
0
58.38
%
Provisions, Non-Current 473,000,
000
0 47300000
0
0.00%
Provision for Employee Entitlements,
Non-Current
473,000,
000
0 47300000
0
0.00%

27
Pension and Other Post-Retirement
Benefit Plans, Non-Current
473,000,
000
0 47300000
0
0.00%
Tax Liabilities, Non-Current 13,178,0
00,000
12,820,0
00,000
35800000
0
2.79%
Deferred Tax Liabilities, Non-Current 13,178,0
00,000
12,820,0
00,000
35800000
0
2.79%
Deferred Liabilities, Non-Current 3,335,00
0,000
2,971,00
0,000
36400000
0
12.25
%
Payables and Accrued Expenses, Non-
Current
Trade and Other Payables, Non-Current
Trade/Accounts Payable, Non-Current
Other Non-Current Liabilities
Total Equity 63,939,0
00,000
61,272,0
00,000
26670000
00
4.35%
Equity Attributable to Parent Stockholders 63,936,0
00,000
61,101,0
00,000
28350000
00
4.64%
Paid in Capital 17,106,0
00,000
17,106,0
00,000
0 0.00%
Capital Stock 17,106,0
00,000
17,106,0
00,000
0 0.00%
Common Stock 17,106,0
00,000
17,106,0
00,000
0 0.00%
Common Stock, without Par Value 17,106,0
00,000
17,106,0
00,000
0 0.00%
Common Stock, with Par Value
Additional Paid in Capital/Share
Premium
Reserves/Accumulated Comprehensive
Income/Losses
46,830,0
00,000
43,995,0
00,000
28350000
00
6.44%
Other Reserves/Accum. Comp. Inc 46,830,0
00,000
43,995,0
00,000
28350000
00
6.44%
Retained Earnings/Accumulated Deficit
Non-Controlling/Minority Interests 3,000,00
0
171,000,
000
-
16800000
0
-
98.25
%
Income statement
Name 2018 2017 Increase /
decrease
Change
in %
Gross Profit 12,058,0
00,000
4,537,00
0,000
752100000
0
165.77
%
Total Revenue 111,060,
000,000
97,284,0
00,000
137760000
00
14.16%
Business Revenue 111,060,
000,000
97,284,0
00,000
137760000
00
14.16%
Cost of Revenue -
99,002,0
-
92,747,0
-
625500000
6.74%

28
00,000 00,000 0
Cost of Goods and Services -
5,292,00
0,000
-
4,996,00
0,000
-
296000000
5.92%
Rent and Landing Fees, Cost of
Revenue
-
17,486,0
00,000
-
15,225,0
00,000
-
226100000
0
14.85%
Operation Maintenance and Repairs -
9,401,00
0,000
-
9,607,00
0,000
206000000 -2.14%
Staff Cost, Cost of Revenue -
20,211,0
00,000
-
19,962,0
00,000
-
249000000
1.25%
Depreciation & Amortization, Cost of
Revenue
-
12,743,0
00,000
-
11,845,0
00,000
-
898000000
7.58%
Other Cost of Revenue -
33,869,0
00,000
-
31,112,0
00,000
-
275700000
0
8.86%
Purchased Fuel, Power and Gas
Operating Income/Expenses -
8,463,00
0,000
-
6,816,00
0,000
-
164700000
0
24.16%
Selling, General and Administrative
Expenses
-
862,000,
000
-
681,000,
000
-
181000000
26.58%
Staff Costs -
862,000,
000
-
681,000,
000
-
181000000
26.58%
Other Staff Costs -
862,000,
000
-
681,000,
000
-
181000000
26.58%
Rent Expense
Selling and Marketing Expenses
Depreciation, Amortization and Depletion -
2,851,00
0,000
-
2,795,00
0,000
-56000000 2.00%
Depreciation and Amortization -
2,851,00
0,000
-
2,795,00
0,000
-56000000 2.00%
Depreciation
Other Income/Expense, Operating -
4,750,00
0,000
-
3,340,00
0,000
-
141000000
0
42.22%
Other Expenses, Operating -
4,750,00
0,000
-
3,340,00
0,000
-
141000000
0
42.22%
Total Operating Profit/Loss 3,595,00
0,000
-
2,279,00
587400000
0
-
257.74
Secure Best Marks with AI Grader
Need help grading? Try our AI Grader for instant feedback on your assignments.
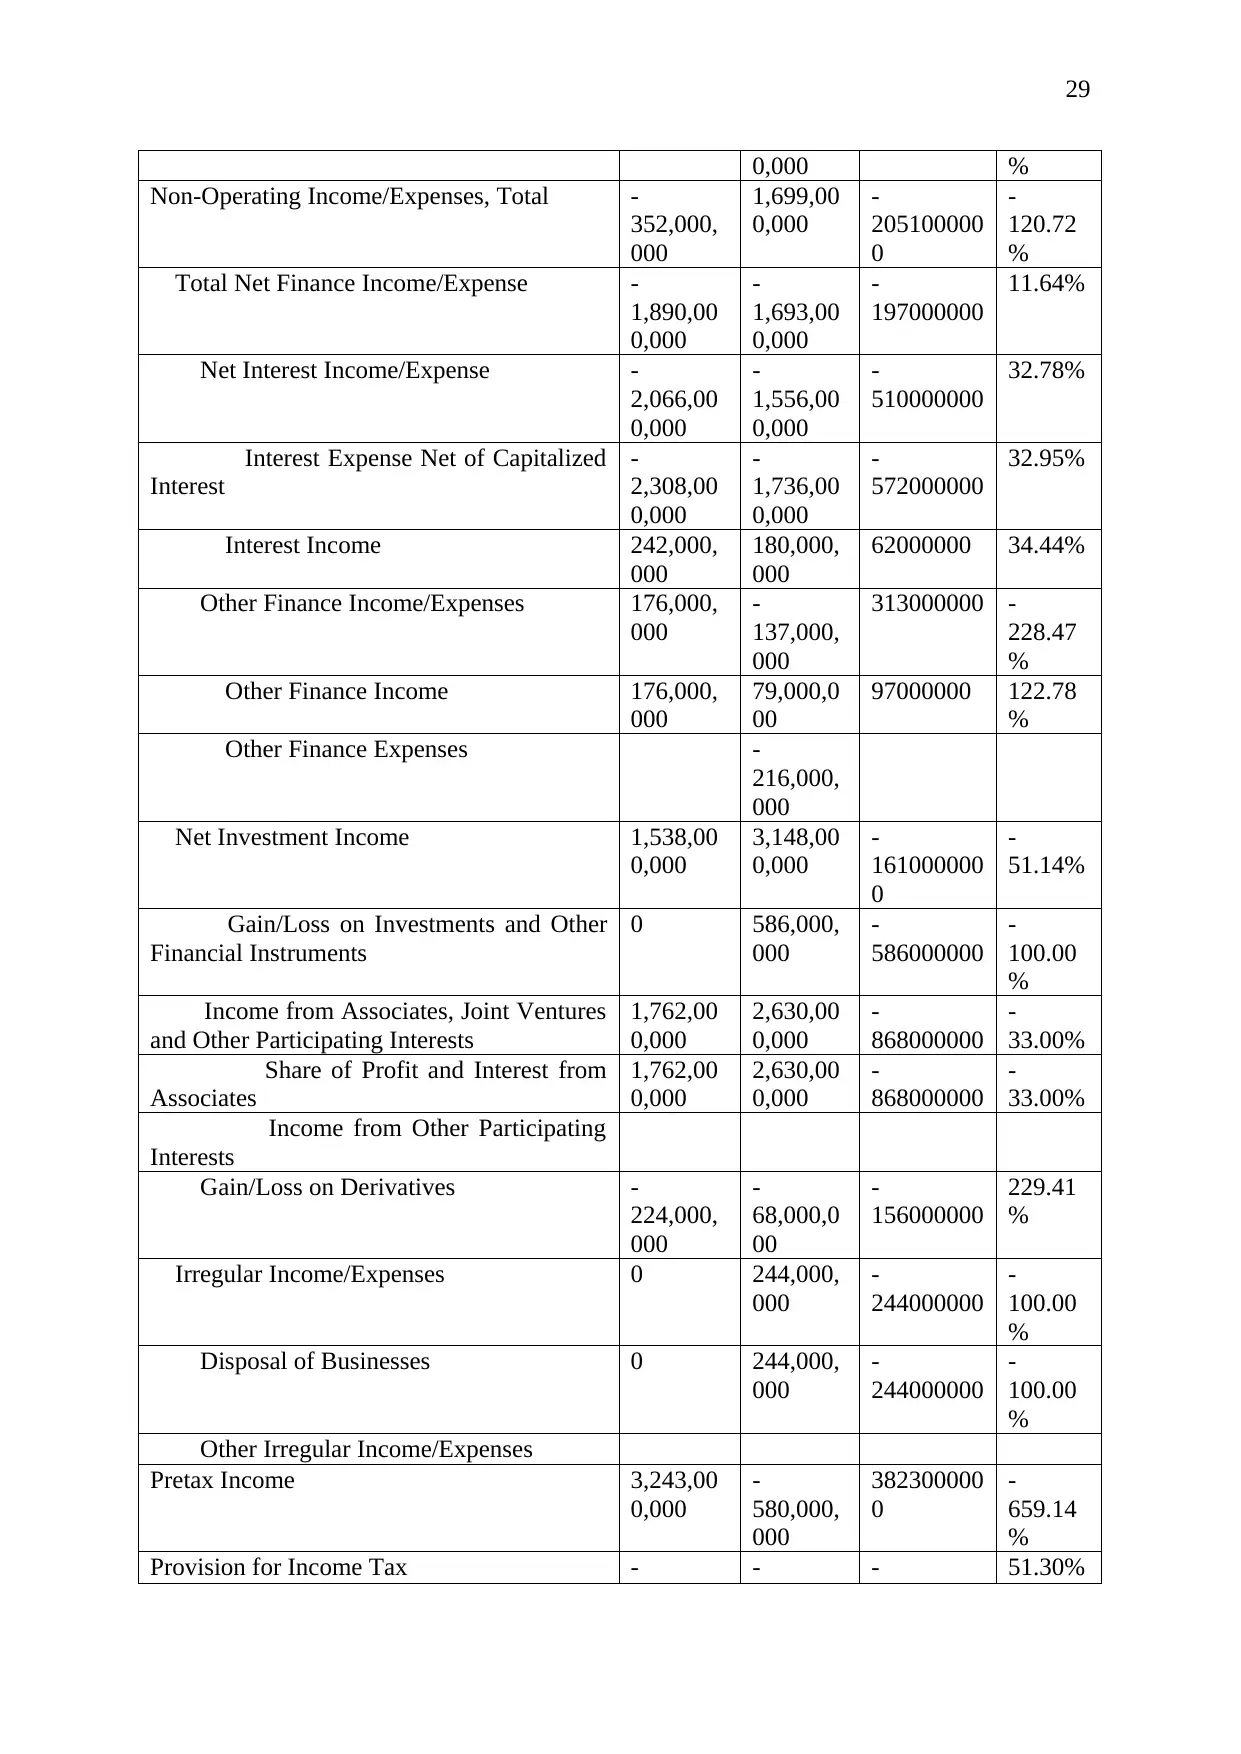
29
0,000 %
Non-Operating Income/Expenses, Total -
352,000,
000
1,699,00
0,000
-
205100000
0
-
120.72
%
Total Net Finance Income/Expense -
1,890,00
0,000
-
1,693,00
0,000
-
197000000
11.64%
Net Interest Income/Expense -
2,066,00
0,000
-
1,556,00
0,000
-
510000000
32.78%
Interest Expense Net of Capitalized
Interest
-
2,308,00
0,000
-
1,736,00
0,000
-
572000000
32.95%
Interest Income 242,000,
000
180,000,
000
62000000 34.44%
Other Finance Income/Expenses 176,000,
000
-
137,000,
000
313000000 -
228.47
%
Other Finance Income 176,000,
000
79,000,0
00
97000000 122.78
%
Other Finance Expenses -
216,000,
000
Net Investment Income 1,538,00
0,000
3,148,00
0,000
-
161000000
0
-
51.14%
Gain/Loss on Investments and Other
Financial Instruments
0 586,000,
000
-
586000000
-
100.00
%
Income from Associates, Joint Ventures
and Other Participating Interests
1,762,00
0,000
2,630,00
0,000
-
868000000
-
33.00%
Share of Profit and Interest from
Associates
1,762,00
0,000
2,630,00
0,000
-
868000000
-
33.00%
Income from Other Participating
Interests
Gain/Loss on Derivatives -
224,000,
000
-
68,000,0
00
-
156000000
229.41
%
Irregular Income/Expenses 0 244,000,
000
-
244000000
-
100.00
%
Disposal of Businesses 0 244,000,
000
-
244000000
-
100.00
%
Other Irregular Income/Expenses
Pretax Income 3,243,00
0,000
-
580,000,
000
382300000
0
-
659.14
%
Provision for Income Tax - - - 51.30%

30
466,000,
000
308,000,
000
158000000
Net Income from Continuing Operations 2,777,00
0,000
-
888,000,
000
366500000
0
-
412.73
%
Vertical analysis
Balance sheet
Name 2018 2017 2018 2017
Total Assets 190,294,
000,000
188,378,
000,000
100.
00%
100.
00%
Total Current Assets 29,618,0
00,000
32,835,0
00,000
15.5
6%
17.4
3%
Cash, Cash Equivalents and Short Term
Investments
15,315,0
00,000
19,094,0
00,000
8.05
%
10.1
4%
Short Term Investments 15,315,0
00,000
19,094,0
00,000
8.05
%
10.1
4%
Other Short Term Investments 15,315,0
00,000
19,094,0
00,000
8.05
%
10.1
4%
Cash and Cash Equivalents
Derivative Investment and Hedging Assets,
Current
499,000,
000
32,000,0
00
0.26
%
0.02
%
Inventories 1,828,00
0,000
1,515,00
0,000
0.96
%
0.80
%
Trade and Other Receivables, Current 11,976,0
00,000
11,329,0
00,000
6.29
%
6.01
%
Trade/Accounts Receivable, Current 6,559,00
0,000
6,131,00
0,000
3.45
%
3.25
%
Amount Due From Related Parties, Current 74,000,0
00
59,000,0
00
0.04
%
0.03
%
Other Receivables, Current 5,343,00
0,000
5,139,00
0,000
2.81
%
2.73
%
Assets Held for Sale/Discontinued Operations,
Current
0 865,000,
000
0.00
%
0.46
%
Other Current Assets
Total Non-Current Assets 160,676,
000,000
155,543,
000,000
84.4
4%
82.5
7%
Net Property, Plant and Equipment 117,124,
000,000
111,182,
000,000
61.5
5%
59.0
2%
Gross Property, Plant and Equipment 187,399,
000,000
174,612,
000,000
98.4
8%
92.6
9%
Properties 15,213,0
00,000
15,176,0
00,000
7.99
%
8.06
%
Buildings and Improvements 15,213,0
00,000
15,176,0
00,000
7.99
%
8.06
%
Machinery, Furniture and Equipment 172,186, 159,436, 90.4 84.6

31
000,000 000,000 8% 4%
Flight, Fleet, Vehicle and Related
Equipment
166,773,
000,000
154,012,
000,000
87.6
4%
81.7
6%
Other Equipment 5,413,00
0,000
5,424,00
0,000
2.84
%
2.88
%
Accumulated Depreciation and Impairment -
70,275,0
00,000
-
63,430,0
00,000
-
36.9
3%
-
33.6
7%
Accumulated Depreciation -
70,275,0
00,000
-
63,430,0
00,000
-
36.9
3%
-
33.6
7%
Accumulated Depreciation of Properties -
5,741,00
0,000
-
5,084,00
0,000
-
3.02
%
-
2.70
%
Accumulated Depreciation of Buildings -
5,741,00
0,000
-
5,084,00
0,000
-
3.02
%
-
2.70
%
Accumulated Depreciation of Machinery,
Furniture and Equipment
-
64,534,0
00,000
-
58,346,0
00,000
-
33.9
1%
-
30.9
7%
Accumulated Depreciation of Flight,
Fleet, Vehicle and Related Equipments
-
61,175,0
00,000
-
55,181,0
00,000
-
32.1
5%
-
29.2
9%
Accumulated Depreciation of Other
Equipment
-
3,359,00
0,000
-
3,165,00
0,000
-
1.77
%
-
1.68
%
Net Intangible Assets 11,174,0
00,000
11,221,0
00,000
5.87
%
5.96
%
Gross Goodwill and Other Intangible Assets 14,533,0
00,000
14,146,0
00,000
7.64
%
7.51
%
Goodwill 7,666,00
0,000
7,666,00
0,000
4.03
%
4.07
%
Intangibles other than Goodwill 6,867,00
0,000
6,480,00
0,000
3.61
%
3.44
%
Software and Technology 6,828,00
0,000
6,227,00
0,000
3.59
%
3.31
%
Other Intangible Assets 39,000,0
00
253,000,
000
0.02
%
0.13
%
Accumulated Amortization and Impairment -
3,359,00
0,000
-
2,925,00
0,000
-
1.77
%
-
1.55
%
Accumulated Amortization of Intangible
Assets
-
3,359,00
0,000
-
2,925,00
0,000
-
1.77
%
-
1.55
%
Accumulated Amortization of Intangibles
other than Goodwill
-
3,359,00
0,000
-
2,925,00
0,000
-
1.77
%
-
1.55
%
Accumulated Amortization of Software
and Technology
-
3,342,00
-
2,793,00
-
1.76
-
1.48
Paraphrase This Document
Need a fresh take? Get an instant paraphrase of this document with our AI Paraphraser

32
0,000 0,000 % %
Accumulated Amortization of Other
Intangible Assets
-
17,000,0
00
-
132,000,
000
-
0.01
%
-
0.07
%
Total Long Term Investments 28,335,0
00,000
28,866,0
00,000
14.8
9%
15.3
2%
Long Term Equity Investments 27,570,0
00,000
28,866,0
00,000
14.4
9%
15.3
2%
Investments in Associates 27,570,0
00,000
28,144,0
00,000
14.4
9%
14.9
4%
Investments in Other Ventures under Equity
Method
722,000,
000
20.6
6%
0.38
%
Investment in Financial Assets, Non-Current 765,000,
000
0.40
%
Financial Assets Designated as Fair Value
Through Profit or Loss, Non-Current
742,000,
000
0.39
%
Financial Investment Securities, Available-
for-Sale & Held-to-Maturity, Non-Current
23,000,0
00
0.01
%
Available-for-Sale Securities, Non-
Current
23,000,0
00
0.01
%
Derivative Investment and Hedging Assets, Non-
Current
1,860,00
0,000
1,781,00
0,000
0.98
%
0.95
%
Trade and Other Receivables, Non-Current 217,000,
000
246,000,
000
0.11
%
0.13
%
Loans Receivable, Non-Current 217,000,
000
246,000,
000
0.11
%
0.13
%
Trade/Accounts Receivable, Non-Current
Prepayments and Deposits, Non-Current 1,173,00
0,000
1,215,00
0,000
0.62
%
0.64
%
Prepayments, Non-Current 1,173,00
0,000
1,215,00
0,000
0.62
%
0.64
%
Deferred Tax Assets, Non-Current 793,000,
000
928,000,
000
0.42
%
0.49
%
Pension and Other Employee Benefits, Non-
Current
0 104,000,
000
0.00
%
0.06
%
Other Non-Current Assets
Total Liabilities 126,355,
000,000
127,106,
000,000
66.4
0%
67.4
7%
Total Current Liabilities 48,345,0
00,000
41,278,0
00,000
25.4
1%
21.9
1%
Payables and Accrued Expenses, Current 19,384,0
00,000
15,371,0
00,000
10.1
9%
8.16
%
Trade and Other Payables, Current 19,384,0
00,000
15,371,0
00,000
10.1
9%
8.16
%
Trade/Accounts Payable, Current 6,801,00
0,000
5,112,00
0,000
3.57
%
2.71
%
Dividends Payable, Current 1,000,00
0
0 0.00
%
0.00
%
Amount Due to Related 372,000, 334,000, 0.20 0.18
1 out of 32
Related Documents


Your All-in-One AI-Powered Toolkit for Academic Success.
+13062052269
info@desklib.com
Available 24*7 on WhatsApp / Email
![[object Object]](/_next/static/media/star-bottom.7253800d.svg)
Unlock your academic potential
© 2024 | Zucol Services PVT LTD | All rights reserved.