Accounting for Business: Income Statement, Financial Position, Investment Appraisal, Financial Ratios of NS plc
VerifiedAdded on 2023/06/11
|10
|1647
|239
AI Summary
This article covers Accounting for Business including Income Statement, Financial Position, Investment Appraisal, and Financial Ratios of NS plc. It also includes non-financial factors affecting the decision and IRR and its advantages.
Contribute Materials
Your contribution can guide someone’s learning journey. Share your
documents today.
Accounting for Business
Secure Best Marks with AI Grader
Need help grading? Try our AI Grader for instant feedback on your assignments.
TABLE OF CONTENTS
SECTION A.....................................................................................................................................3
QUESTION 1...................................................................................................................................3
a. Preparing income statement for the year ended 31 December 2021.......................................3
b. Preparing statement of financial position as on 31 December 2021.......................................4
SECTION B.....................................................................................................................................5
QUESTION 2...................................................................................................................................5
a. Calculating payback period and net present value..................................................................5
b. Advising K plc for investment................................................................................................6
c. Non- financial factors affecting the decision..........................................................................7
d. IRR and its advantages............................................................................................................7
QUESTION 4...................................................................................................................................7
a. Calculating the ratios of NS plc..............................................................................................7
b. Commenting on the financial ratios of NS plc........................................................................8
REFERENCES..............................................................................................................................10
SECTION A
QUESTION 1
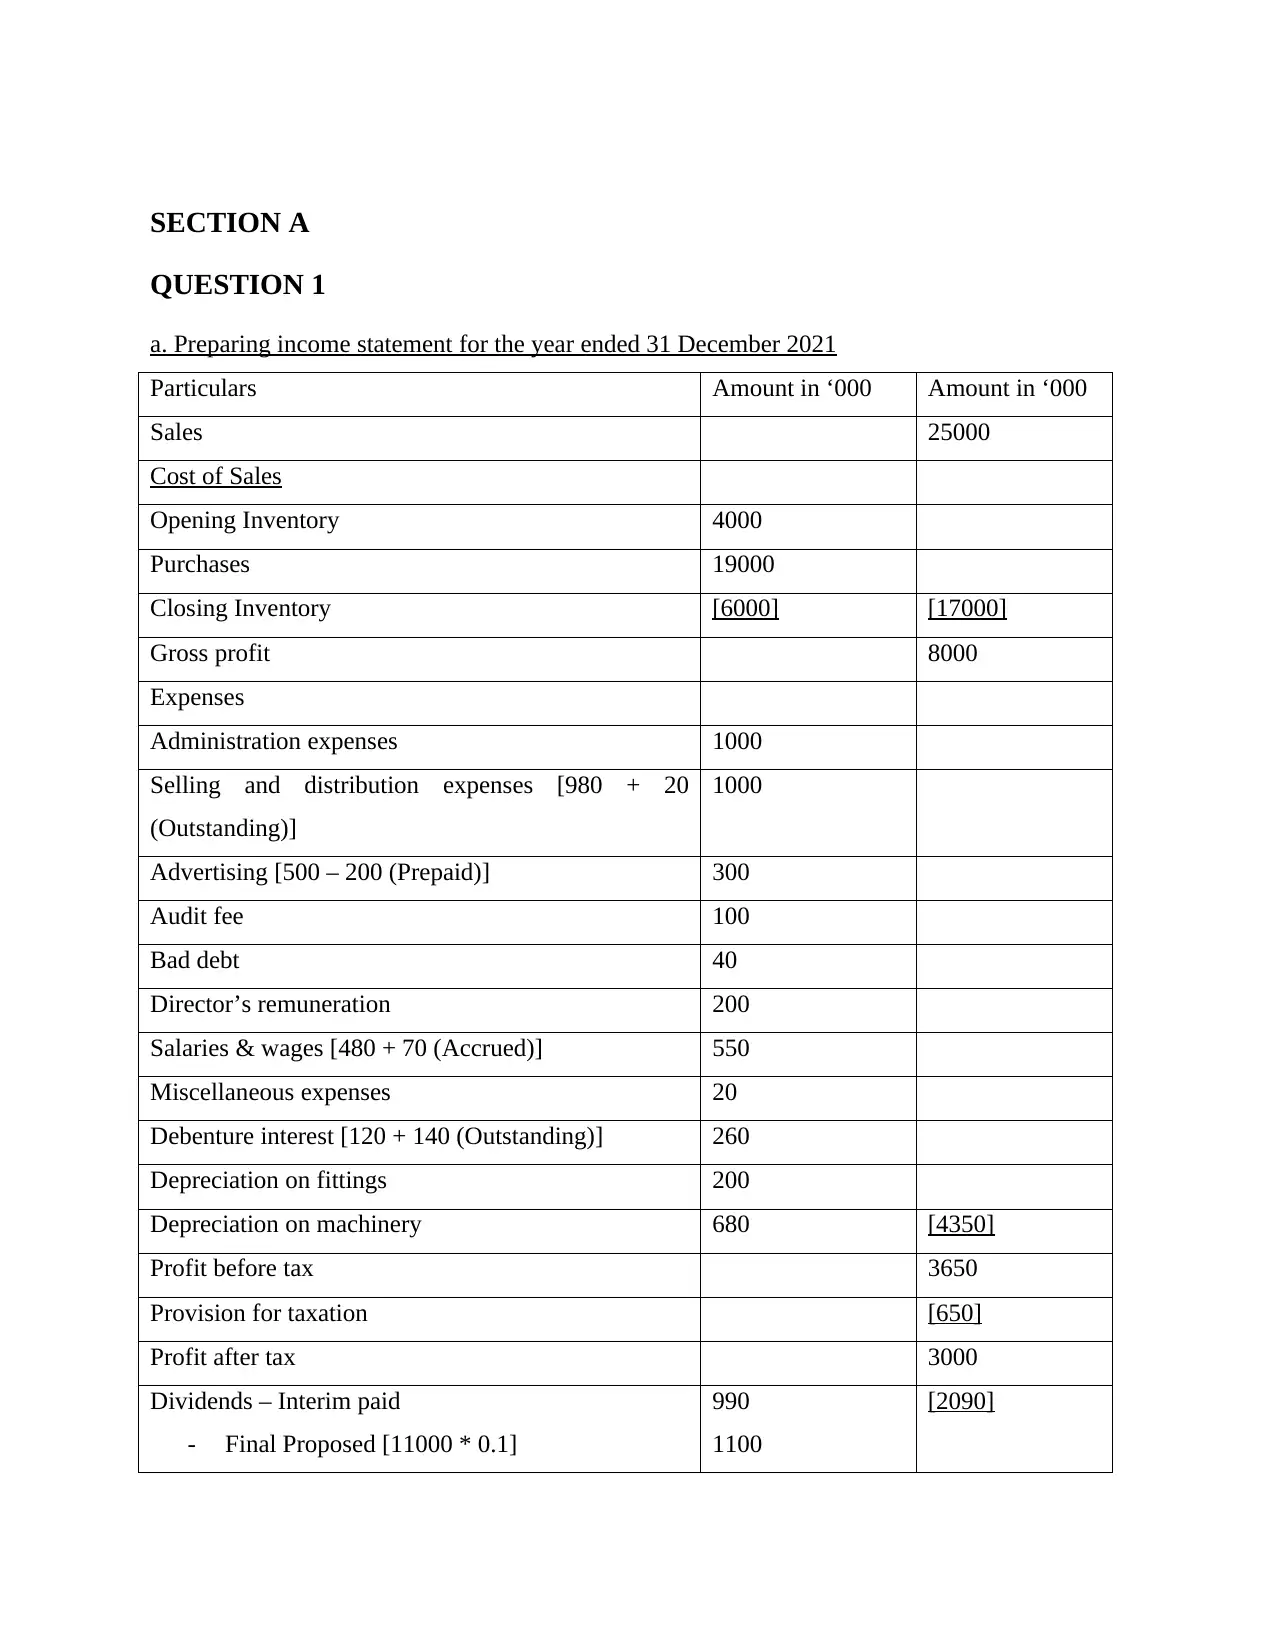
a. Preparing income statement for the year ended 31 December 2021
Particulars Amount in ‘000 Amount in ‘000
Sales 25000
Cost of Sales
Opening Inventory 4000
Purchases 19000
Closing Inventory [6000] [17000]
Gross profit 8000
Expenses
Administration expenses 1000
Selling and distribution expenses [980 + 20
(Outstanding)]
1000
Advertising [500 – 200 (Prepaid)] 300
Audit fee 100
Bad debt 40
Director’s remuneration 200
Salaries & wages [480 + 70 (Accrued)] 550
Miscellaneous expenses 20
Debenture interest [120 + 140 (Outstanding)] 260
Depreciation on fittings 200
Depreciation on machinery 680 [4350]
Profit before tax 3650
Provision for taxation [650]
Profit after tax 3000
Dividends – Interim paid
- Final Proposed [11000 * 0.1]
990
1100
[2090]
QUESTION 1
a. Preparing income statement for the year ended 31 December 2021
Particulars Amount in ‘000 Amount in ‘000
Sales 25000
Cost of Sales
Opening Inventory 4000
Purchases 19000
Closing Inventory [6000] [17000]
Gross profit 8000
Expenses
Administration expenses 1000
Selling and distribution expenses [980 + 20
(Outstanding)]
1000
Advertising [500 – 200 (Prepaid)] 300
Audit fee 100
Bad debt 40
Director’s remuneration 200
Salaries & wages [480 + 70 (Accrued)] 550
Miscellaneous expenses 20
Debenture interest [120 + 140 (Outstanding)] 260
Depreciation on fittings 200
Depreciation on machinery 680 [4350]
Profit before tax 3650
Provision for taxation [650]
Profit after tax 3000
Dividends – Interim paid
- Final Proposed [11000 * 0.1]
990
1100
[2090]
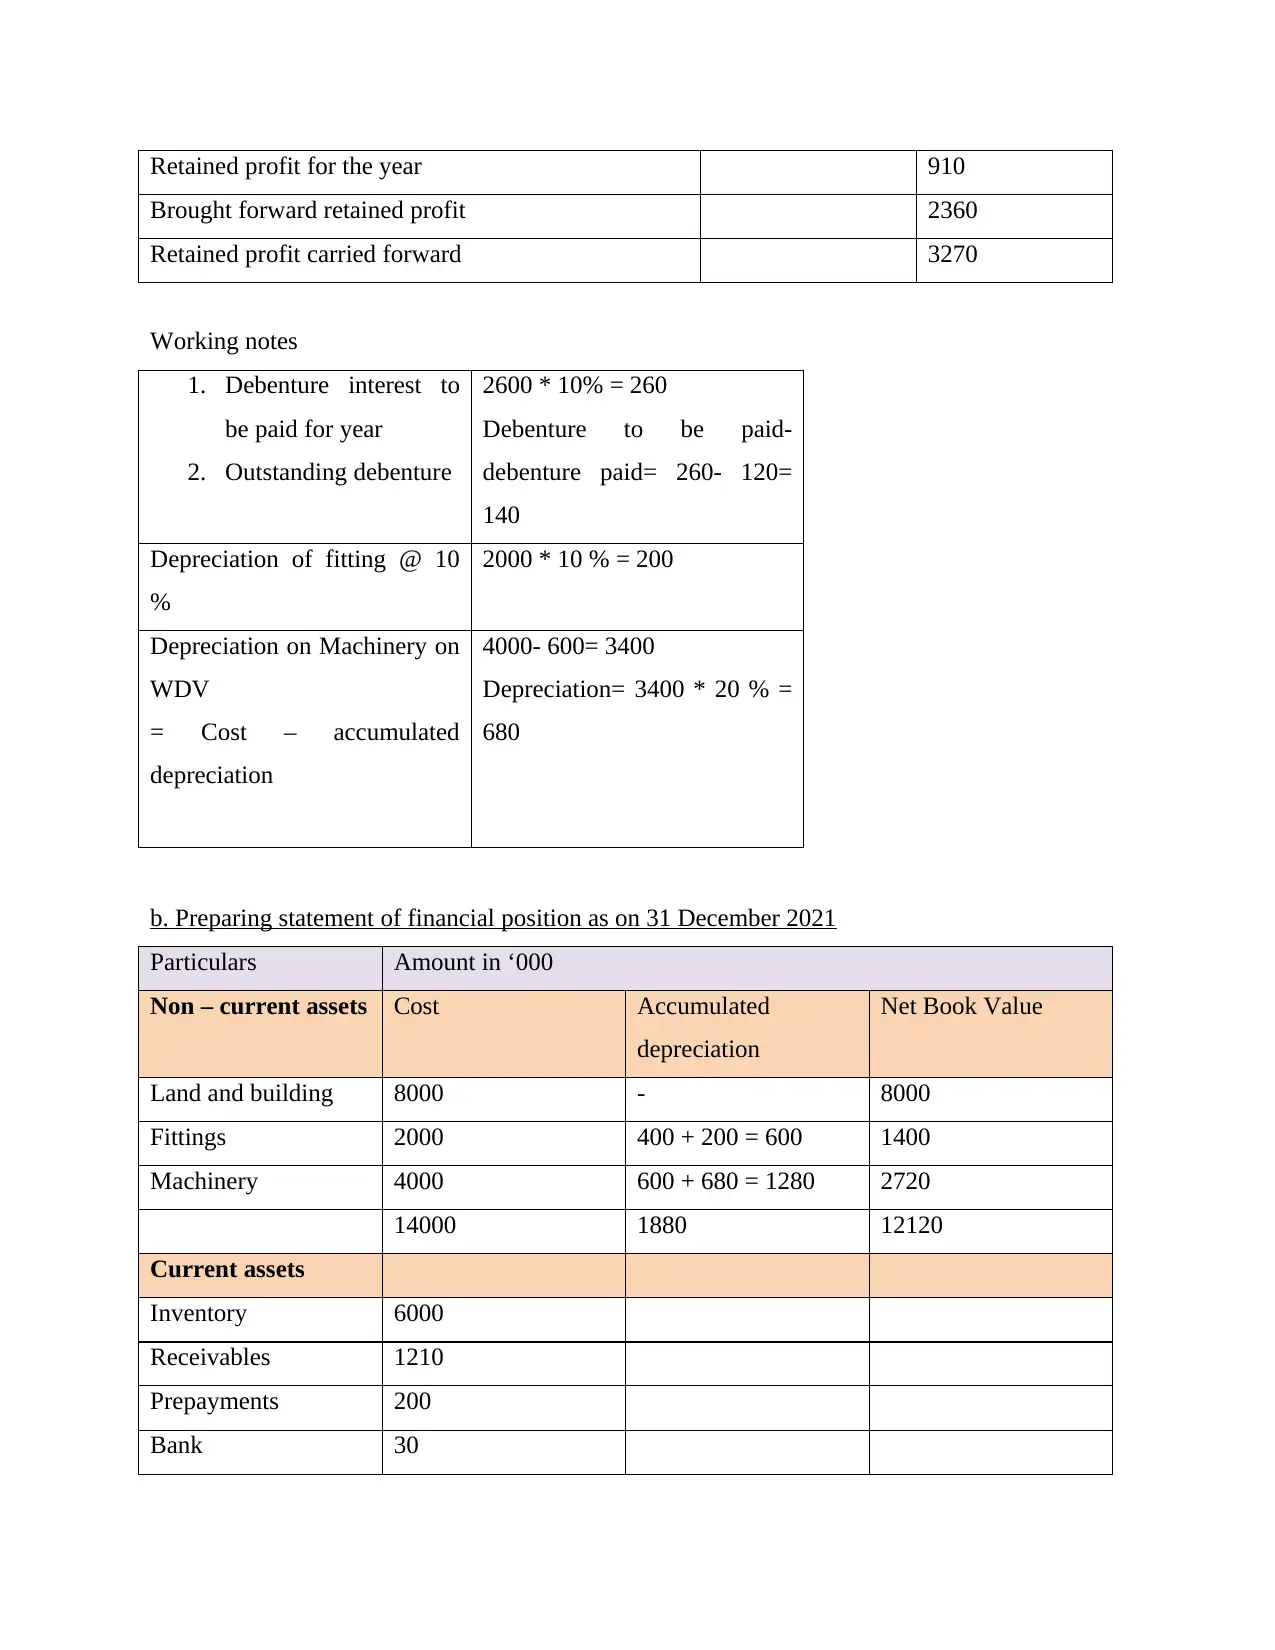
Retained profit for the year 910
Brought forward retained profit 2360
Retained profit carried forward 3270
Working notes
1. Debenture interest to
be paid for year
2. Outstanding debenture
2600 * 10% = 260
Debenture to be paid-
debenture paid= 260- 120=
140
Depreciation of fitting @ 10
%
2000 * 10 % = 200
Depreciation on Machinery on
WDV
= Cost – accumulated
depreciation
4000- 600= 3400
Depreciation= 3400 * 20 % =
680
b. Preparing statement of financial position as on 31 December 2021
Particulars Amount in ‘000
Non – current assets Cost Accumulated
depreciation
Net Book Value
Land and building 8000 - 8000
Fittings 2000 400 + 200 = 600 1400
Machinery 4000 600 + 680 = 1280 2720
14000 1880 12120
Current assets
Inventory 6000
Receivables 1210
Prepayments 200
Bank 30
Secure Best Marks with AI Grader
Need help grading? Try our AI Grader for instant feedback on your assignments.
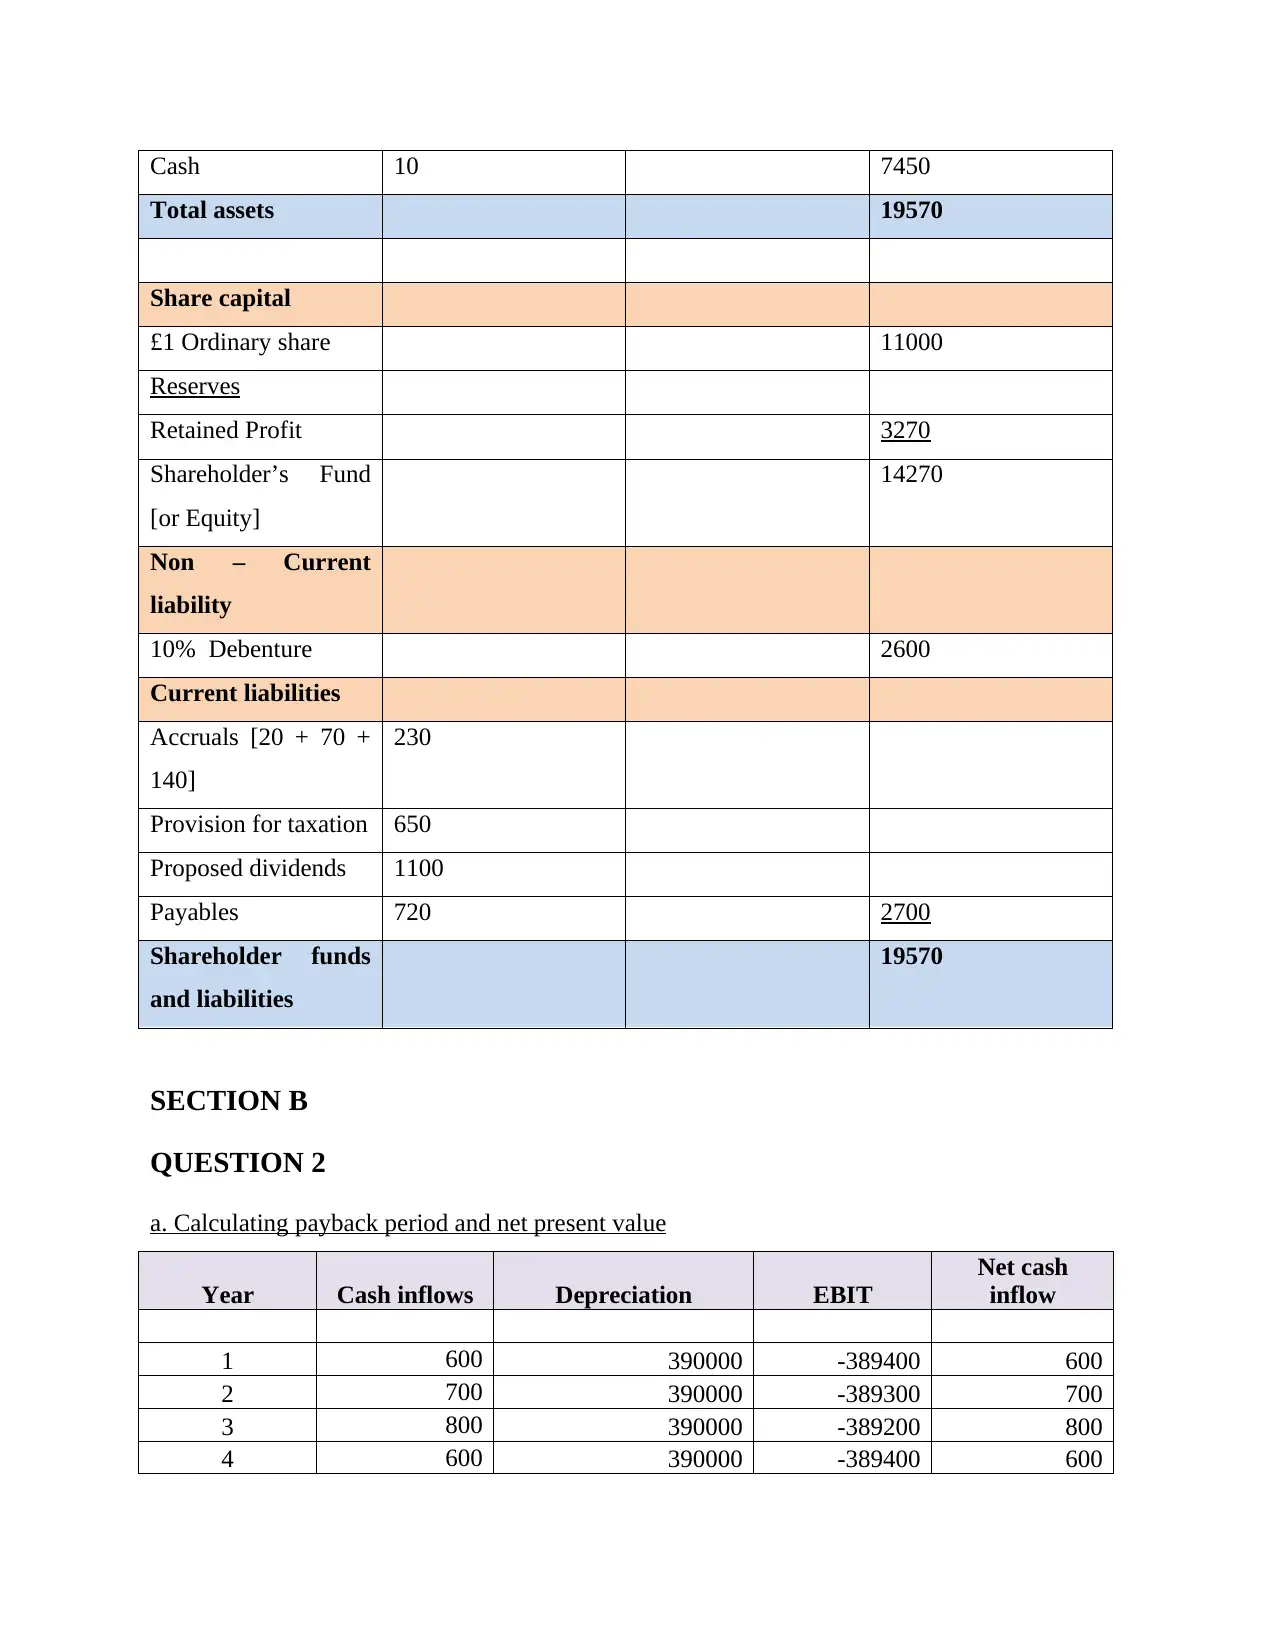
Cash 10 7450
Total assets 19570
Share capital
£1 Ordinary share 11000
Reserves
Retained Profit 3270
Shareholder’s Fund
[or Equity]
14270
Non – Current
liability
10% Debenture 2600
Current liabilities
Accruals [20 + 70 +
140]
230
Provision for taxation 650
Proposed dividends 1100
Payables 720 2700
Shareholder funds
and liabilities
19570
SECTION B
QUESTION 2
a. Calculating payback period and net present value
Year Cash inflows Depreciation EBIT
Net cash
inflow
1 600 390000 -389400 600
2 700 390000 -389300 700
3 800 390000 -389200 800
4 600 390000 -389400 600
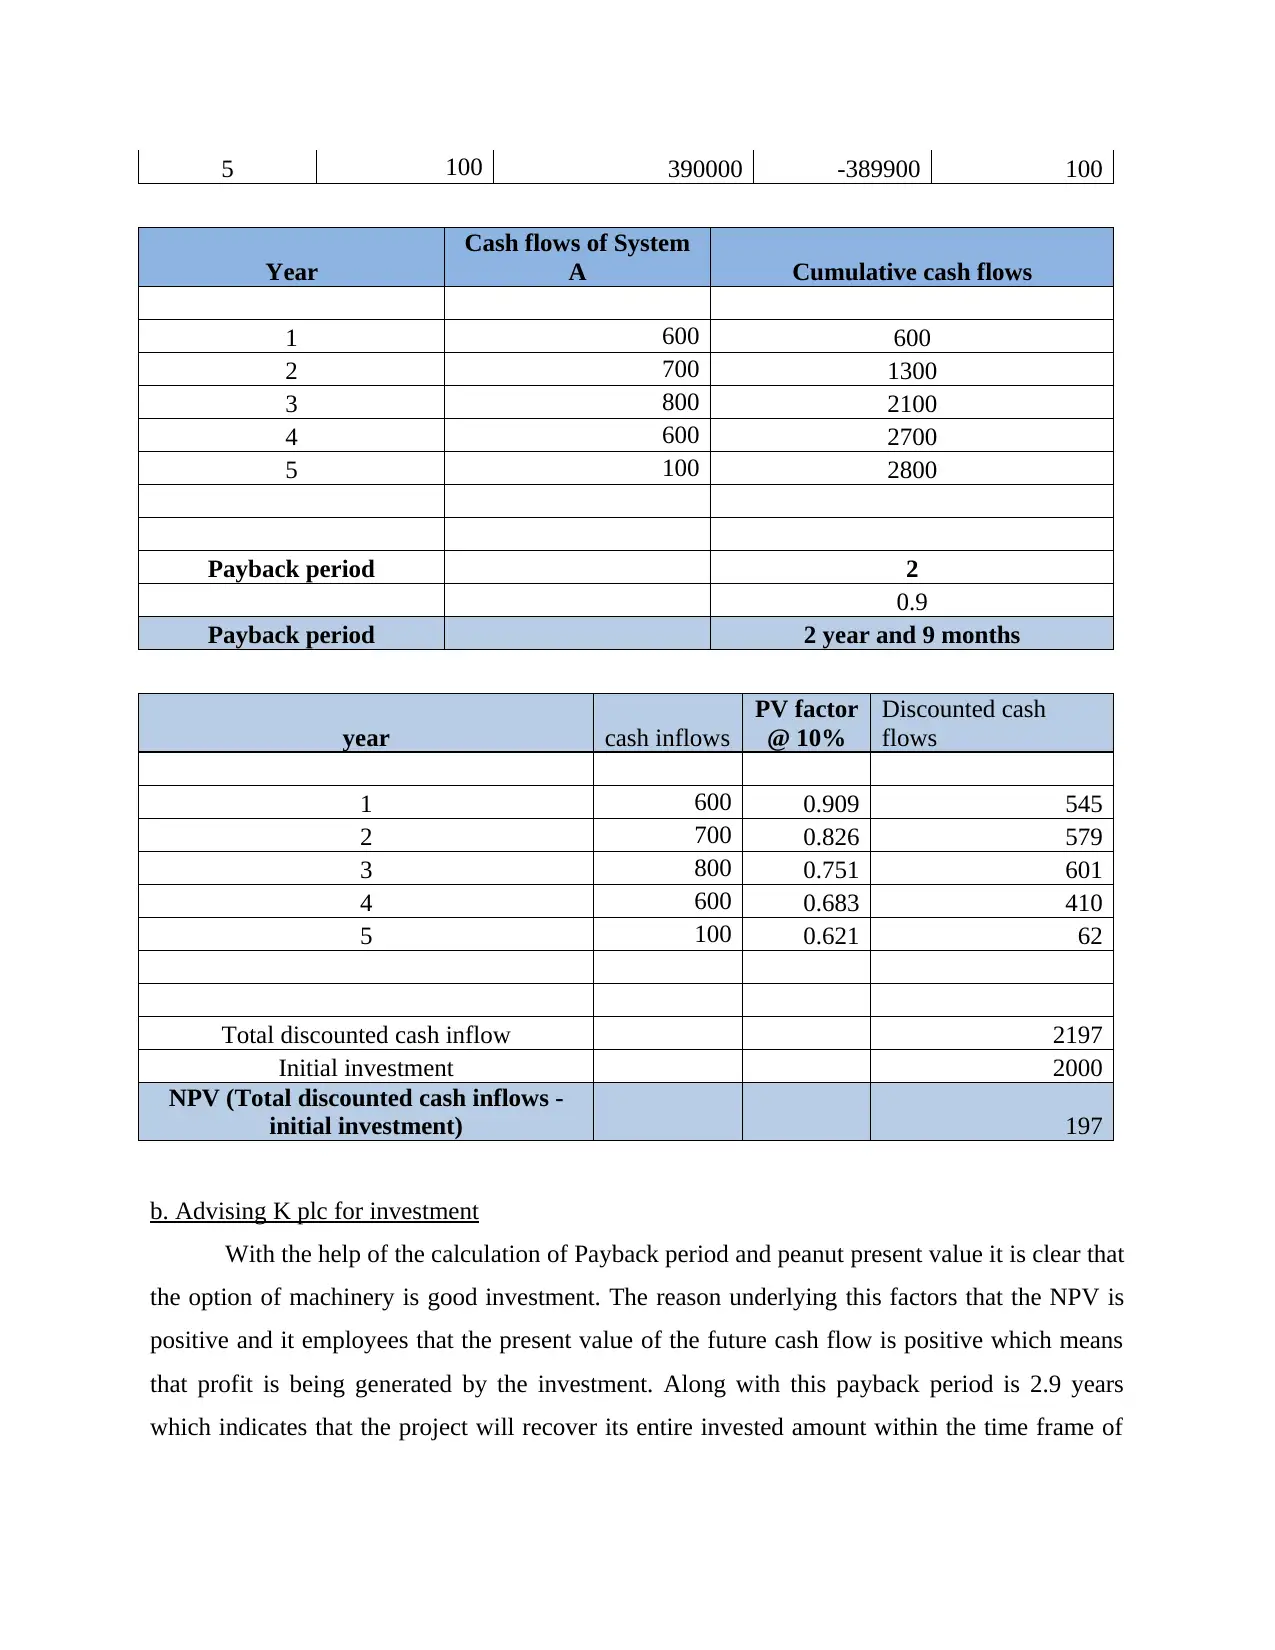
5 100 390000 -389900 100
Year
Cash flows of System
A Cumulative cash flows
1 600 600
2 700 1300
3 800 2100
4 600 2700
5 100 2800
Payback period 2
0.9
Payback period 2 year and 9 months
year cash inflows
PV factor
@ 10%
Discounted cash
flows
1 600 0.909 545
2 700 0.826 579
3 800 0.751 601
4 600 0.683 410
5 100 0.621 62
Total discounted cash inflow 2197
Initial investment 2000
NPV (Total discounted cash inflows -
initial investment) 197
b. Advising K plc for investment
With the help of the calculation of Payback period and peanut present value it is clear that
the option of machinery is good investment. The reason underlying this factors that the NPV is
positive and it employees that the present value of the future cash flow is positive which means
that profit is being generated by the investment. Along with this payback period is 2.9 years
which indicates that the project will recover its entire invested amount within the time frame of
less than 3 years. This is advisable to the company that they must invest within the project as the
payback period required by the companies also 3 years.
c. Non- financial factors affecting the decision
The non financial factors which need to be considered at time of taking investment appraisal
decision includes the following-
The first thing to be considered is to match the industry standard and the practices which
other companies are following (Hazen and Magni, 2021). This is necessary because in case
this will not be considered then it will be impacting the working efficiency.
Along with this another non financial factors to be considered is complaint with the future
legislations and current laws.
In addition to this another non financial factor to be considered for taking investment
decision is the political and other changes being taken place within the environment.
Moreover in addition to this another thing to be considered is the product quality and the
services which will be provided to the consumers need to be good and effective.
Along with this the technology and others related aspects need to be considered while taking
decision relating to the investment appraisal.
d. IRR and its advantages
The internal rate of return is a tool used within the financial analysis while estimating the
profitability which or potential investment can generate. Any investment is being done in order
to improve the profitability of the business and in case the investment option is not profitable
than it will be affecting the work in efficiency. Hence IRR helps company in estimating the
profitability of the investment and the present value of the future cash flow.
Advantages of IRR
One of the most common benefits of using internal rate of return is that it includes the
time value of money within the calculation. Hence this includes the present value of the
future cash flow is equivalent to the required capital investment.
In addition to this another benefit is that be use of IRR is very easy to be calculated.
Along with this another benefit of using the IRR is that it assists in ranking the project on
the basis of the profitability which they generate (Al-Mutairi, Naser and Saeid, 2018).
Paraphrase This Document
Need a fresh take? Get an instant paraphrase of this document with our AI Paraphraser
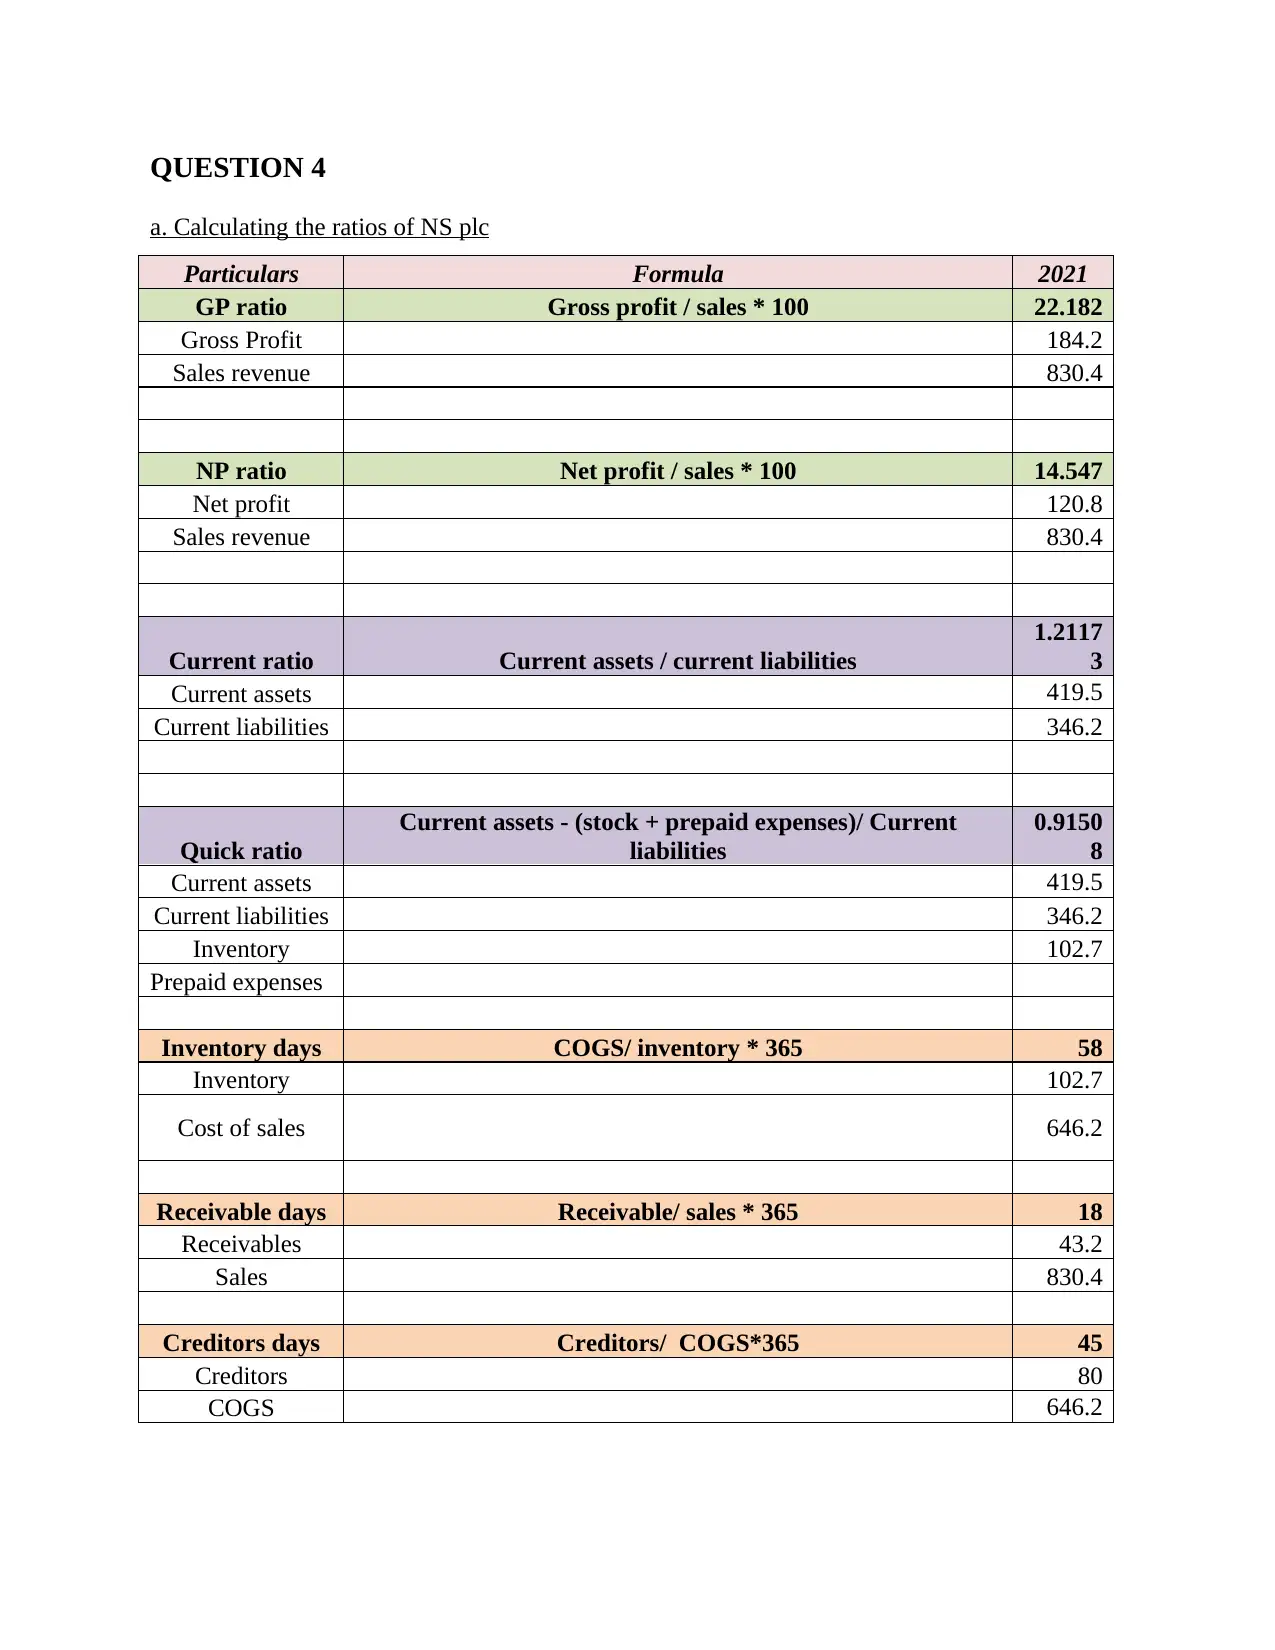
QUESTION 4
a. Calculating the ratios of NS plc
Particulars Formula 2021
GP ratio Gross profit / sales * 100 22.182
Gross Profit 184.2
Sales revenue 830.4
NP ratio Net profit / sales * 100 14.547
Net profit 120.8
Sales revenue 830.4
Current ratio Current assets / current liabilities
1.2117
3
Current assets 419.5
Current liabilities 346.2
Quick ratio
Current assets - (stock + prepaid expenses)/ Current
liabilities
0.9150
8
Current assets 419.5
Current liabilities 346.2
Inventory 102.7
Prepaid expenses
Inventory days COGS/ inventory * 365 58
Inventory 102.7
Cost of sales 646.2
Receivable days Receivable/ sales * 365 18
Receivables 43.2
Sales 830.4
Creditors days Creditors/ COGS*365 45
Creditors 80
COGS 646.2
b. Commenting on the financial ratios of NS plc
With the help of the profitability ratio it is clear that the gross profit ratio of the company
is 22% where as the industry average is 35%. This simply implies that working of the company
is not good in comparison to the industry average and NS PLC need to improve its working.
Along with this with the help of the net profit ratio it is clear that companies having 14% where
as the industry average is having 16%. It employees that there is light difference within the net
profit ratio of both the companies.
For the with help of the liquidity ratio that is the current ratio it is 1.2 times where as the
industry average is 2.2 times. Hence, it implies that the performance of the company is not good
in terms of liquidity (Zavadskas and et.al., 2018). With respect to the quick ratio it is somewhat
near to the industry average that as the companies having 0.91 times where as industry average is
0.96 times.
Further with help of the efficiency ratio it is clear that the industry average is good as
compared to the companies’ calculation. This is particularly because of the reason that them the
inventory days of NS plc is 58 days where as the industry average is 50 days. On the other hand
the receivable 18 for the company and 30 for the industry average. In addition to these credited
days is 45 days for companies and 30 days for the industry average. With the overall analysis it
is clear that the efficiency ratio and all the other ratios are good for the industry average and not
for the company. Hence it is advisable to company that they must improve the performance of
them in better an effective manner.
REFERENCES
Books and Journals
Al-Mutairi, A., Naser, K. and Saeid, M., 2018. Capital budgeting practices by non-financial
companies listed on Kuwait Stock Exchange (KSE). Cogent Economics &
Finance. 6(1). p.1468232.
Hazen, G. and Magni, C. A., 2021. Average internal rate of return for risky projects. The
Engineering Economist. 66(2). pp.90-120.
Zavadskas, E. K. and et.al., 2018. A novel multicriteria approach–rough step-wise weight
assessment ratio analysis method (R-SWARA) and its application in logistics. Studies in
Informatics and Control. 27(1). pp.97-106.
1 out of 10
Related Documents


Your All-in-One AI-Powered Toolkit for Academic Success.
+13062052269
info@desklib.com
Available 24*7 on WhatsApp / Email
![[object Object]](/_next/static/media/star-bottom.7253800d.svg)
Unlock your academic potential
© 2024 | Zucol Services PVT LTD | All rights reserved.