CSR Ltd & Boral Ltd: Detailed Financial Ratio Analysis Report
VerifiedAdded on 2023/03/31
|11
|1861
|104
Report
AI Summary
This report analyzes the financial performance of CSR Ltd, a major building products company, in comparison to its competitor, Boral Ltd, using key financial ratios. The analysis covers profitability, solvency, and liquidity, providing insights into the companies' operational efficiency and financial health from 2016 to 2018. CSR Ltd demonstrates strong asset turnover and profitability, but faces challenges in inventory management and cash cycle efficiency. Recommendations for CSR Ltd include cost reduction, improved inventory management, and shortening the cash cycle to enhance liquidity and overall performance. The report concludes that while CSR Ltd performs well in certain areas, implementing suggested improvements will further strengthen its business structure and competitive position.
Running head: ACCOUNTING FOR BUSINESS
Accounting for Business
Name of the Student:
Name of the University:
Author’s Notes:
Accounting for Business
Name of the Student:
Name of the University:
Author’s Notes:
Paraphrase This Document
Need a fresh take? Get an instant paraphrase of this document with our AI Paraphraser
1
ACCOUNTING FOR BUSINESS
Table of Contents
Introduction......................................................................................................................................2
Financial Ratio Analysis..................................................................................................................2
Recommendation.............................................................................................................................5
Conclusion.......................................................................................................................................6
Reference.........................................................................................................................................7
Appendix..........................................................................................................................................9
2
ACCOUNTING FOR BUSINESS
Introduction
The main purpose of the assessment is to analyse the business of CSR ltd which is
engaged in the business of producing major building products and the same also has a holding of
25% Tomago aluminium smelter. The company is considered to be one of the largest businesses
which is engaged in the business of providing infrastructure. The assessment would be analysing
the key financial ratios of the company and also analyse the performance of the business in
respect to different areas of performance of the business (Boral.com. 2019). In order to make
effective presentation of the performance of the business, comparison would be made with one
of the closest competitors of CSR Ltd which is Boral Ltd (Corporate. 2019). The key financial
ratios which are computed for this organization would be including aspects of profitability,
solvency and liquidity. On the basis of such estimates, the performance of the business would be
estimated and evaluated.
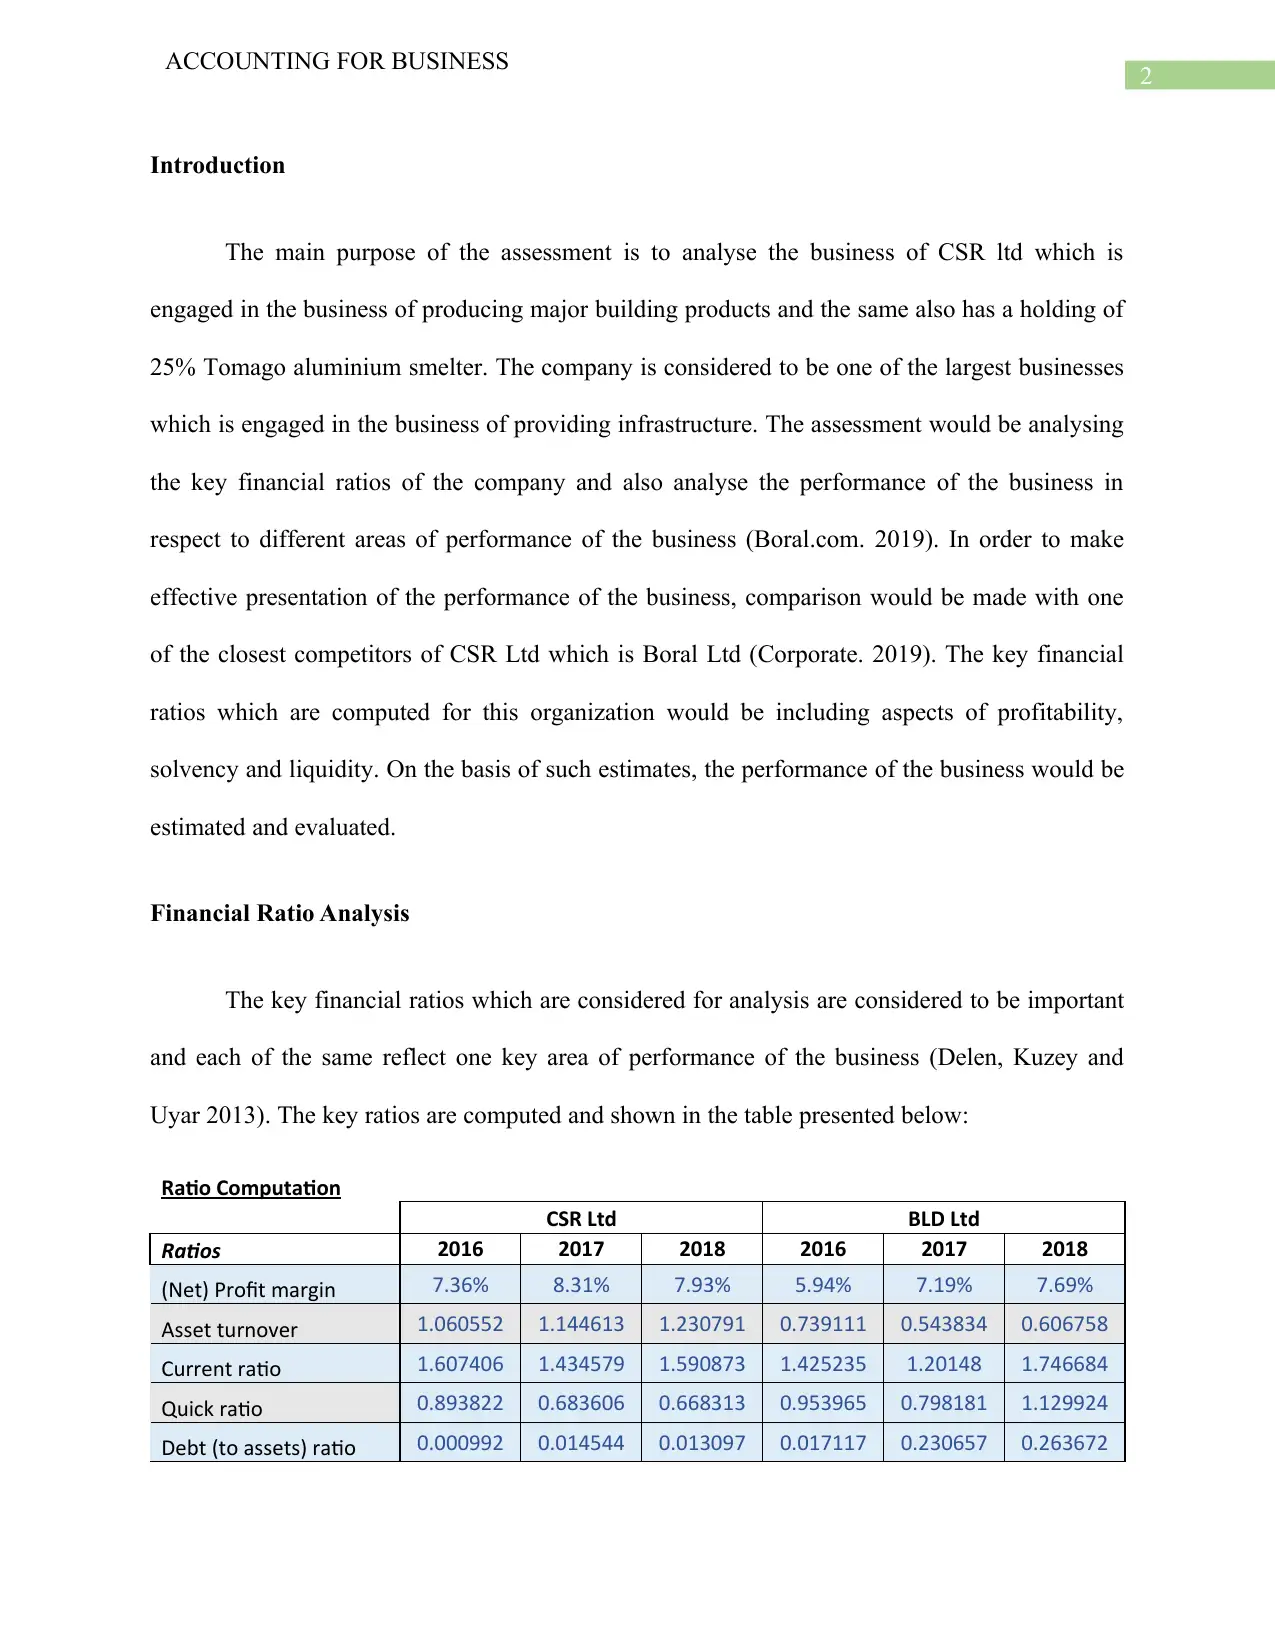
Financial Ratio Analysis
The key financial ratios which are considered for analysis are considered to be important
and each of the same reflect one key area of performance of the business (Delen, Kuzey and
Uyar 2013). The key ratios are computed and shown in the table presented below:
Ratio Computation
CSR Ltd BLD Ltd
Ratios 2016 2017 2018 2016 2017 2018
(Net) Profit margin 7.36% 8.31% 7.93% 5.94% 7.19% 7.69%
Asset turnover 1.060552 1.144613 1.230791 0.739111 0.543834 0.606758
Current ratio 1.607406 1.434579 1.590873 1.425235 1.20148 1.746684
Quick ratio 0.893822 0.683606 0.668313 0.953965 0.798181 1.129924
Debt (to assets) ratio 0.000992 0.014544 0.013097 0.017117 0.230657 0.263672
ACCOUNTING FOR BUSINESS
Introduction
The main purpose of the assessment is to analyse the business of CSR ltd which is
engaged in the business of producing major building products and the same also has a holding of
25% Tomago aluminium smelter. The company is considered to be one of the largest businesses
which is engaged in the business of providing infrastructure. The assessment would be analysing
the key financial ratios of the company and also analyse the performance of the business in
respect to different areas of performance of the business (Boral.com. 2019). In order to make
effective presentation of the performance of the business, comparison would be made with one
of the closest competitors of CSR Ltd which is Boral Ltd (Corporate. 2019). The key financial
ratios which are computed for this organization would be including aspects of profitability,
solvency and liquidity. On the basis of such estimates, the performance of the business would be
estimated and evaluated.
Financial Ratio Analysis
The key financial ratios which are considered for analysis are considered to be important
and each of the same reflect one key area of performance of the business (Delen, Kuzey and
Uyar 2013). The key ratios are computed and shown in the table presented below:
Ratio Computation
CSR Ltd BLD Ltd
Ratios 2016 2017 2018 2016 2017 2018
(Net) Profit margin 7.36% 8.31% 7.93% 5.94% 7.19% 7.69%
Asset turnover 1.060552 1.144613 1.230791 0.739111 0.543834 0.606758
Current ratio 1.607406 1.434579 1.590873 1.425235 1.20148 1.746684
Quick ratio 0.893822 0.683606 0.668313 0.953965 0.798181 1.129924
Debt (to assets) ratio 0.000992 0.014544 0.013097 0.017117 0.230657 0.263672
⊘ This is a preview!⊘
Do you want full access?
Subscribe today to unlock all pages.
Trusted by 1+ million students worldwide
3
ACCOUNTING FOR BUSINESS
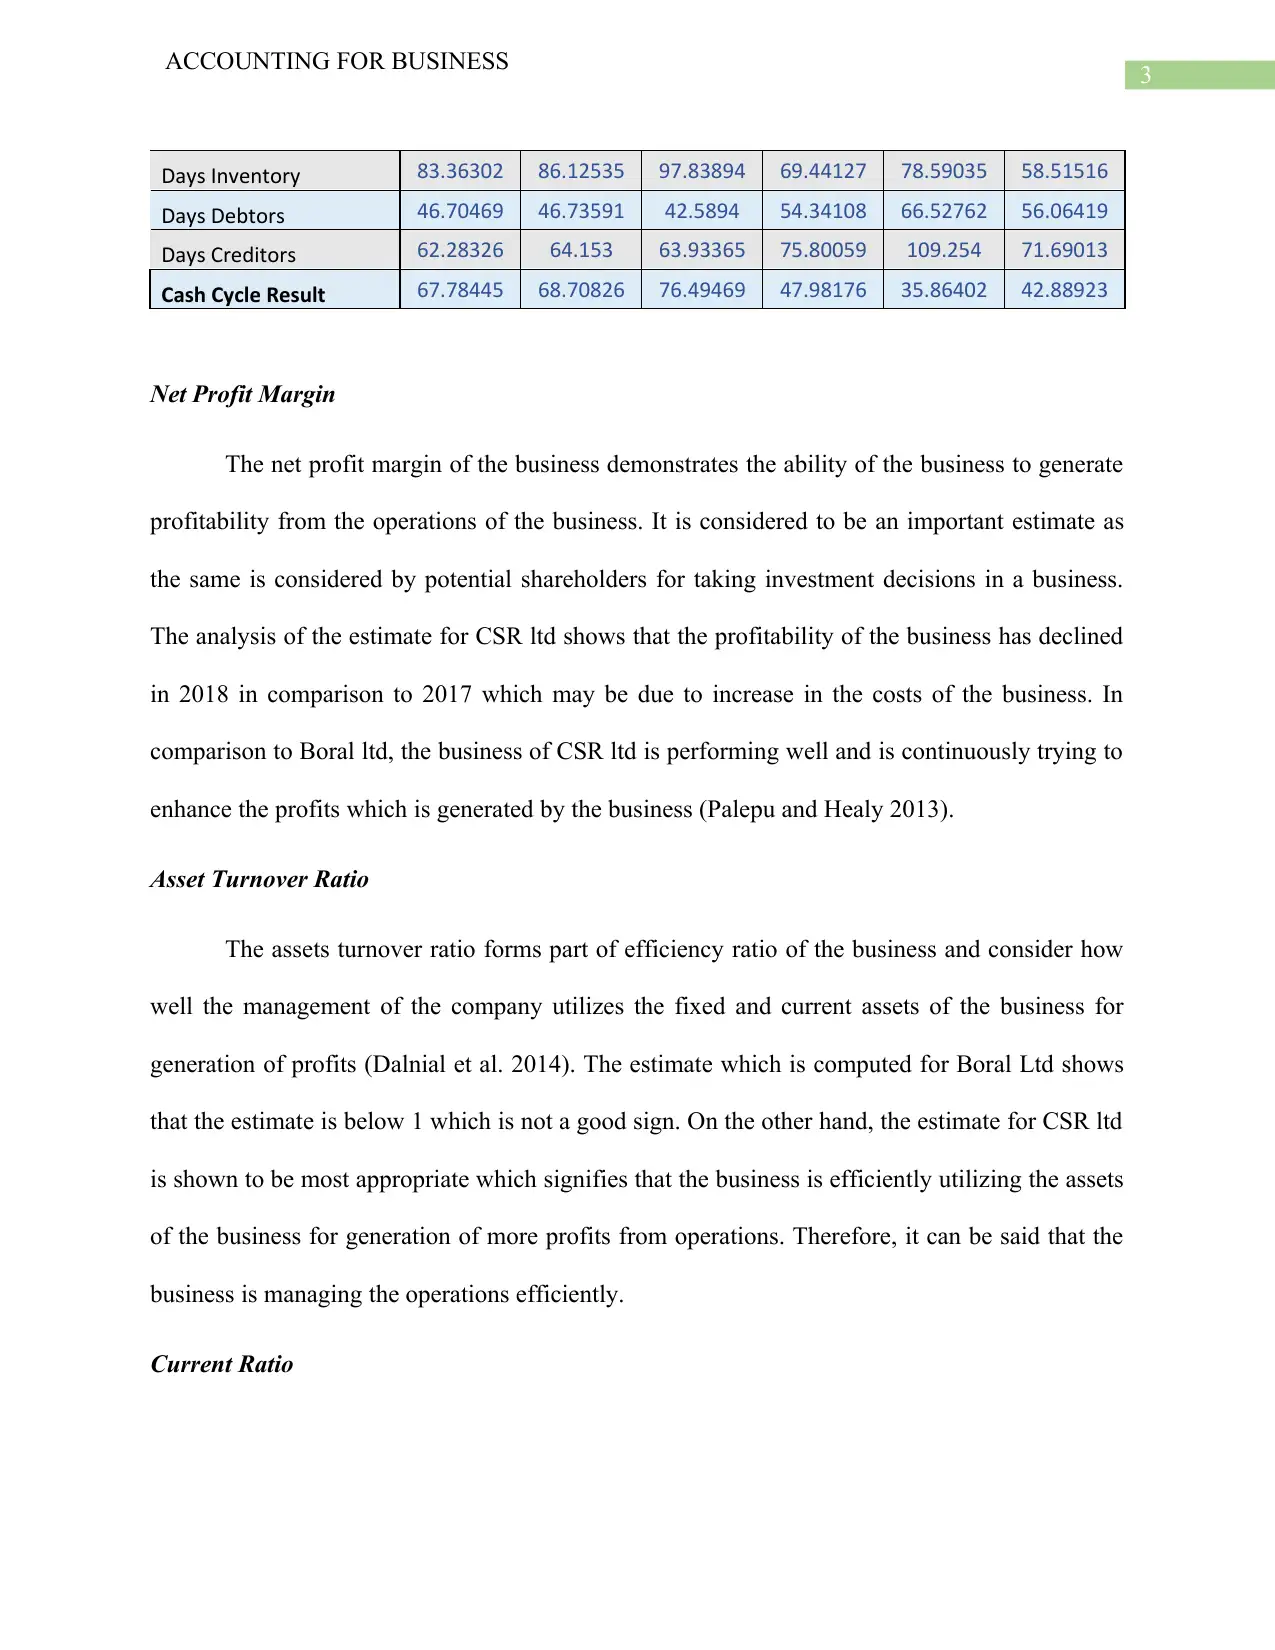
Days Inventory 83.36302 86.12535 97.83894 69.44127 78.59035 58.51516
Days Debtors 46.70469 46.73591 42.5894 54.34108 66.52762 56.06419
Days Creditors 62.28326 64.153 63.93365 75.80059 109.254 71.69013
Cash Cycle Result 67.78445 68.70826 76.49469 47.98176 35.86402 42.88923
Net Profit Margin
The net profit margin of the business demonstrates the ability of the business to generate
profitability from the operations of the business. It is considered to be an important estimate as
the same is considered by potential shareholders for taking investment decisions in a business.
The analysis of the estimate for CSR ltd shows that the profitability of the business has declined
in 2018 in comparison to 2017 which may be due to increase in the costs of the business. In
comparison to Boral ltd, the business of CSR ltd is performing well and is continuously trying to
enhance the profits which is generated by the business (Palepu and Healy 2013).
Asset Turnover Ratio
The assets turnover ratio forms part of efficiency ratio of the business and consider how
well the management of the company utilizes the fixed and current assets of the business for
generation of profits (Dalnial et al. 2014). The estimate which is computed for Boral Ltd shows
that the estimate is below 1 which is not a good sign. On the other hand, the estimate for CSR ltd
is shown to be most appropriate which signifies that the business is efficiently utilizing the assets
of the business for generation of more profits from operations. Therefore, it can be said that the
business is managing the operations efficiently.
Current Ratio
ACCOUNTING FOR BUSINESS
Days Inventory 83.36302 86.12535 97.83894 69.44127 78.59035 58.51516
Days Debtors 46.70469 46.73591 42.5894 54.34108 66.52762 56.06419
Days Creditors 62.28326 64.153 63.93365 75.80059 109.254 71.69013
Cash Cycle Result 67.78445 68.70826 76.49469 47.98176 35.86402 42.88923
Net Profit Margin
The net profit margin of the business demonstrates the ability of the business to generate
profitability from the operations of the business. It is considered to be an important estimate as
the same is considered by potential shareholders for taking investment decisions in a business.
The analysis of the estimate for CSR ltd shows that the profitability of the business has declined
in 2018 in comparison to 2017 which may be due to increase in the costs of the business. In
comparison to Boral ltd, the business of CSR ltd is performing well and is continuously trying to
enhance the profits which is generated by the business (Palepu and Healy 2013).
Asset Turnover Ratio
The assets turnover ratio forms part of efficiency ratio of the business and consider how
well the management of the company utilizes the fixed and current assets of the business for
generation of profits (Dalnial et al. 2014). The estimate which is computed for Boral Ltd shows
that the estimate is below 1 which is not a good sign. On the other hand, the estimate for CSR ltd
is shown to be most appropriate which signifies that the business is efficiently utilizing the assets
of the business for generation of more profits from operations. Therefore, it can be said that the
business is managing the operations efficiently.
Current Ratio
Paraphrase This Document
Need a fresh take? Get an instant paraphrase of this document with our AI Paraphraser
4
ACCOUNTING FOR BUSINESS
The current ratio is considered to be one of the important estimates which signifies the
liquidity position of the business (Ehiedu 2014). The current ratio shows the ability of the
business to meet the current obligations of the business in an effective manner. The current ratio
for CSR ltd is shown to be 1.59 in 2018 which has improved in comparison to previous year
estimate which is a positive sign for the business (Ecer and Boyukaslan 2014). On the other
hand, the current ratio for Boral ltd is also shown to be on a rising trend and the same is shown to
be 1.74 in 2018 which is more than CSR ltd. This means that the business of Boral ltd enjoys
superior liquidity position.
Quick Ratio
The quick ratio is quite similar to current ratio and the same also depicts the liquidity
position of the business and the ability of the business to meet the current obligations of the
business. The quick ratio of the business of CSR ltd is also shown to be proper and similar the
estimate for Boral ltd is also shown to be proper. This shows that both the companies enjoy
liquidity superiority and effectively manages the operations of the business.
Debt to Asset Ratio
The debt to asset ratio forms part of leverage ratios and the same reflects the debt capital
which is used by the business for generating profits and also effectively utilizing the assets of the
business (Enekwe, Agu and Nnagbogu 2014). The utilization of debt in the business of CSR ltd
is shown to be low in comparison to Boral Ltd and the same suggest that both the businesses
effectively utilizes the assets of the business and also manages the debts of the business.
Day Inventory
5
ACCOUNTING FOR BUSINESS
The days inventory of the business reflects the efficiency of the business in managing the
inventory balance of the business. The management of a company would be trying to reduce the
period so that there is more cash cycle in the business. The estimate for Boral ltd is shown to be
much more favourable in comparison to other business which suggest that the business is
performing well in this area. In addition to this, the management of CSR ltd need to make
improvement in the inventory management plan of the business.
Days Receivable
The days receivable estimates of the business shows the efficiency of the business in
managing the debtors of the business and ensuring that the collection of cash can be done as
quickly as possible. The management of CSR ltd follows an appropriate policy in managing the
debtors of the business and ensuring that there is appropriate flow of cash in the business in
comparison to Boral Ltd.
Days Payable
The days payable estimate shows the efficiency of the business in managing the payable
balances of the business and it is considered that if the period is long than the same is more
beneficial for the business. The days payable period effectively shows that Boral ltd has a better
credit period than CSR ltd and this shows that the efficiency of the business is better than the
CSR ltd. The management of CSR ltd needs to make improvements in the same.
Cash Cycle
The cash cycle of the business shows the cash flow in the business and whether the
business would have appropriate cash for ensuring that it is able to meet the current obligations
⊘ This is a preview!⊘
Do you want full access?
Subscribe today to unlock all pages.
Trusted by 1+ million students worldwide
6
ACCOUNTING FOR BUSINESS
of the business in an effective manner. The cash cycle is shown to be appropriate for both the
companies but the same would be requiring more improvements in the long run.
Recommendation
The management of CSR ltd needs to take the following steps for ensuring that the
business is able to meet the current obligations of the business and also improve the performance
of the business in different areas (Xu et al. 2014). On the basis of ratio analysis, the
recommendation which can be suggested to the management of CSR ltd are listed below in
details:
The management of the company needs to reduce the costs of the business so that the
profitability of the business can be improved.
In addition to this, the inventory management policy of the business needs to be revised
so that better control is maintained and the business is able to sell off the inventory in a
quicker time.
The management of the company also needs to reduce the cash cycle period which would
also improve the liquidity position of the business significantly.
Conclusion
The above discussion mainly relates to the interpretation of key financial ratios which is
computed and presented in the table above relating to both the companies which are considered.
The above analysis shows that the business of CSR ltd is performing well in certain areas but
there are still scope for further development. The discussion shows that the business of CSR ltd
is well ahead of Boral Ltd and the management needs to take steps for the purpose of
Paraphrase This Document
Need a fresh take? Get an instant paraphrase of this document with our AI Paraphraser
7
ACCOUNTING FOR BUSINESS
maintaining the status. In addition to this, the management of the company also needs to
implement the measures which have been suggested so that improvement can be brought about
in the business structure of the company.
Reference
Boral.com. (2019). Annual Reports | Boral. [online] Available at:
https://www.boral.com/news/annual-reports [Accessed 18 Aug. 2019].
Corporate. (2019). Annual Meetings and Reports. [online] Available at:
https://www.csr.com.au/investor-relations-and-news/annual-meetings-and-reports [Accessed 18
Aug. 2019].
Dalnial, H., Kamaluddin, A., Sanusi, Z.M. and Khairuddin, K.S., 2014. Detecting fraudulent
financial reporting through financial statement analysis. Journal of Advanced Management
Science Vol, 2(1).
Delen, D., Kuzey, C. and Uyar, A., 2013. Measuring firm performance using financial ratios: A
decision tree approach. Expert Systems with Applications, 40(10), pp.3970-3983.
Ecer, F. and Boyukaslan, A., 2014. Measuring performances of football clubs using financial
ratios: the gray relational analysis approach. American Journal of Economics, 4(1), pp.62-71.
Ehiedu, V.C., 2014. The impact of liquidity on profitability of some selected companies: The
financial statement analysis (FSA) approach. Research Journal of Finance and Accounting, 5(5),
pp.81-90.
8
ACCOUNTING FOR BUSINESS
Enekwe, C.I., Agu, C.I. and Nnagbogu, E.K., 2014. The effect of financial leverage on financial
performance: Evidence of quoted pharmaceutical companies in Nigeria. Journal of Economics
and Finance, 5(3), pp.17-25.
Palepu, K.G. and Healy, P.M., 2013. Business analysis and valuation: Using financial
statements, text and cases.
Xu, W., Xiao, Z., Dang, X., Yang, D. and Yang, X., 2014. Financial ratio selection for business
failure prediction using soft set theory. Knowledge-Based Systems, 63, pp.59-67.
⊘ This is a preview!⊘
Do you want full access?
Subscribe today to unlock all pages.
Trusted by 1+ million students worldwide
9
ACCOUNTING FOR BUSINESS
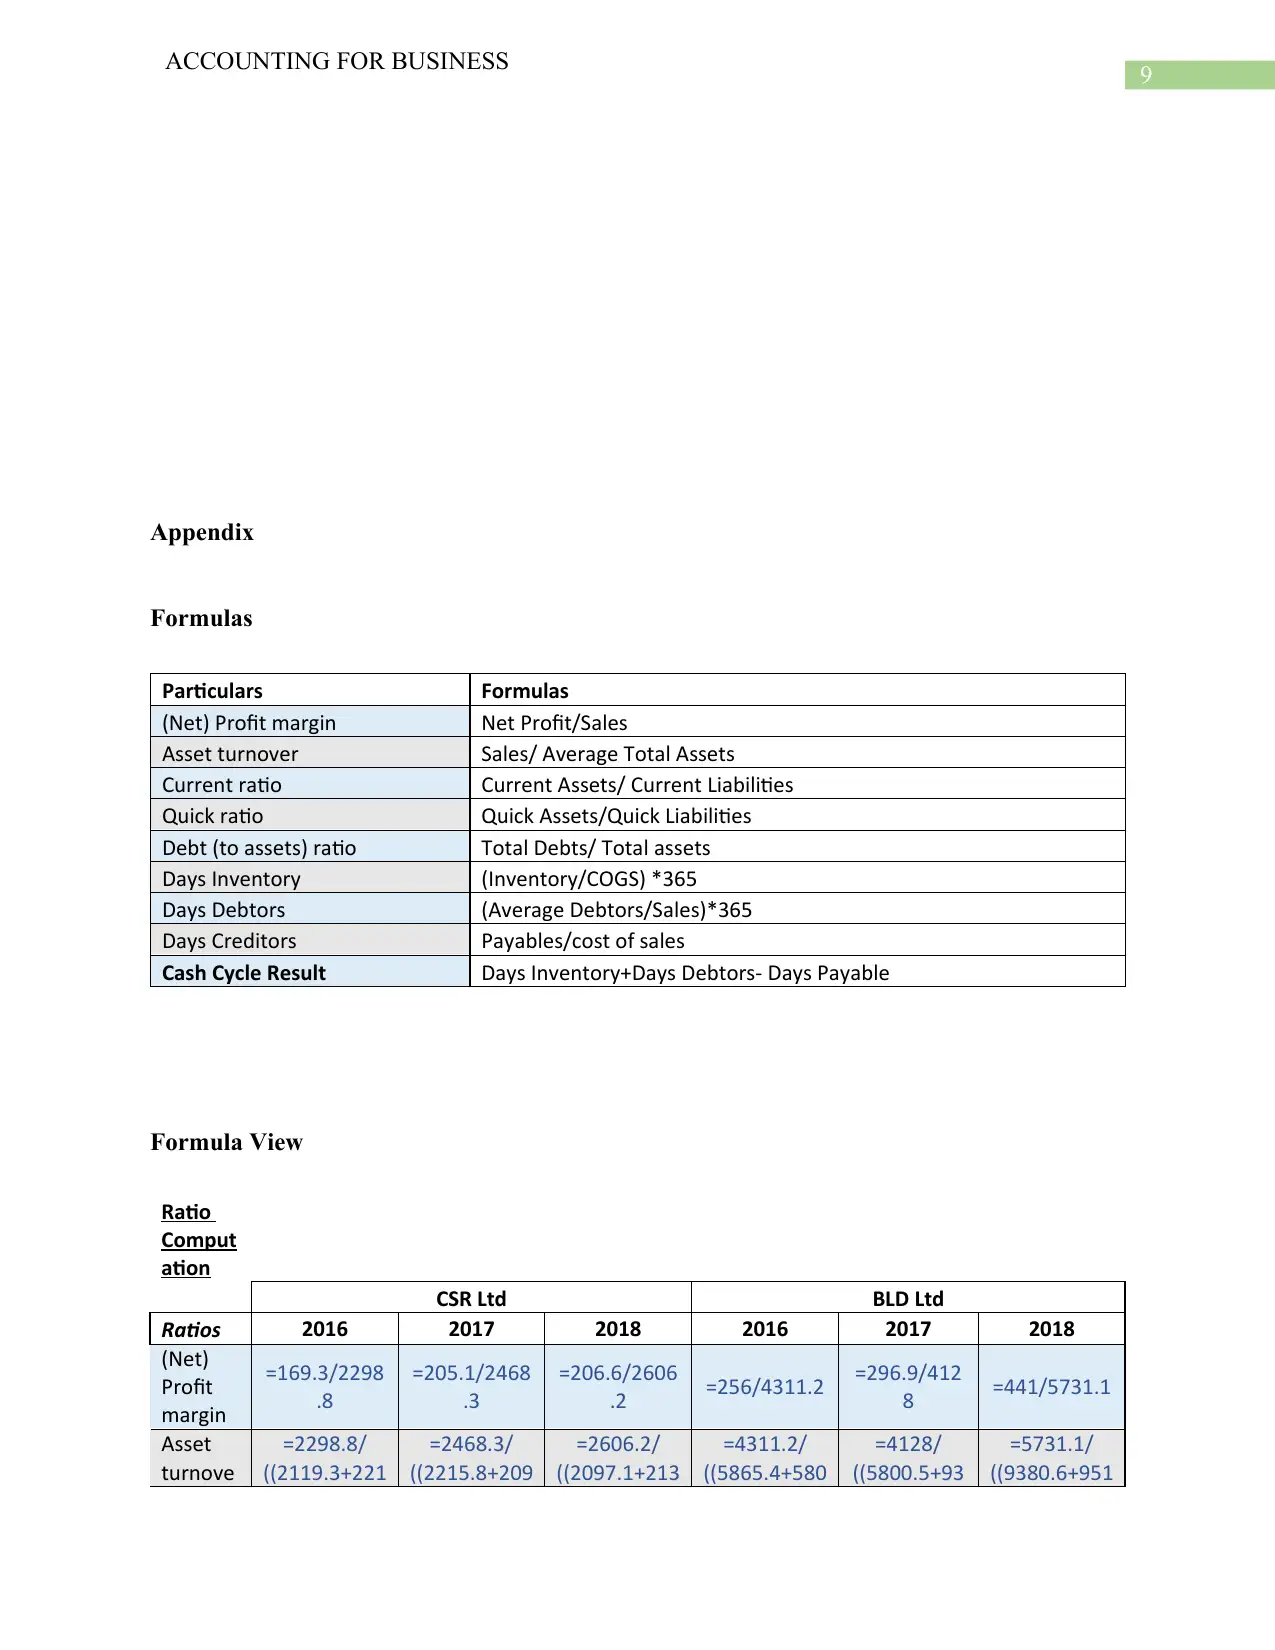
Appendix
Formulas
Particulars Formulas
(Net) Profit margin Net Profit/Sales
Asset turnover Sales/ Average Total Assets
Current ratio Current Assets/ Current Liabilities
Quick ratio Quick Assets/Quick Liabilities
Debt (to assets) ratio Total Debts/ Total assets
Days Inventory (Inventory/COGS) *365
Days Debtors (Average Debtors/Sales)*365
Days Creditors Payables/cost of sales
Cash Cycle Result Days Inventory+Days Debtors- Days Payable
Formula View
Ratio
Comput
ation
CSR Ltd BLD Ltd
Ratios 2016 2017 2018 2016 2017 2018
(Net)
Profit
margin
=169.3/2298
.8
=205.1/2468
.3
=206.6/2606
.2 =256/4311.2 =296.9/412
8 =441/5731.1
Asset
turnove
=2298.8/
((2119.3+221
=2468.3/
((2215.8+209
=2606.2/
((2097.1+213
=4311.2/
((5865.4+580
=4128/
((5800.5+93
=5731.1/
((9380.6+951
ACCOUNTING FOR BUSINESS
Appendix
Formulas
Particulars Formulas
(Net) Profit margin Net Profit/Sales
Asset turnover Sales/ Average Total Assets
Current ratio Current Assets/ Current Liabilities
Quick ratio Quick Assets/Quick Liabilities
Debt (to assets) ratio Total Debts/ Total assets
Days Inventory (Inventory/COGS) *365
Days Debtors (Average Debtors/Sales)*365
Days Creditors Payables/cost of sales
Cash Cycle Result Days Inventory+Days Debtors- Days Payable
Formula View
Ratio
Comput
ation
CSR Ltd BLD Ltd
Ratios 2016 2017 2018 2016 2017 2018
(Net)
Profit
margin
=169.3/2298
.8
=205.1/2468
.3
=206.6/2606
.2 =256/4311.2 =296.9/412
8 =441/5731.1
Asset
turnove
=2298.8/
((2119.3+221
=2468.3/
((2215.8+209
=2606.2/
((2097.1+213
=4311.2/
((5865.4+580
=4128/
((5800.5+93
=5731.1/
((9380.6+951
Paraphrase This Document
Need a fresh take? Get an instant paraphrase of this document with our AI Paraphraser
10
ACCOUNTING FOR BUSINESS
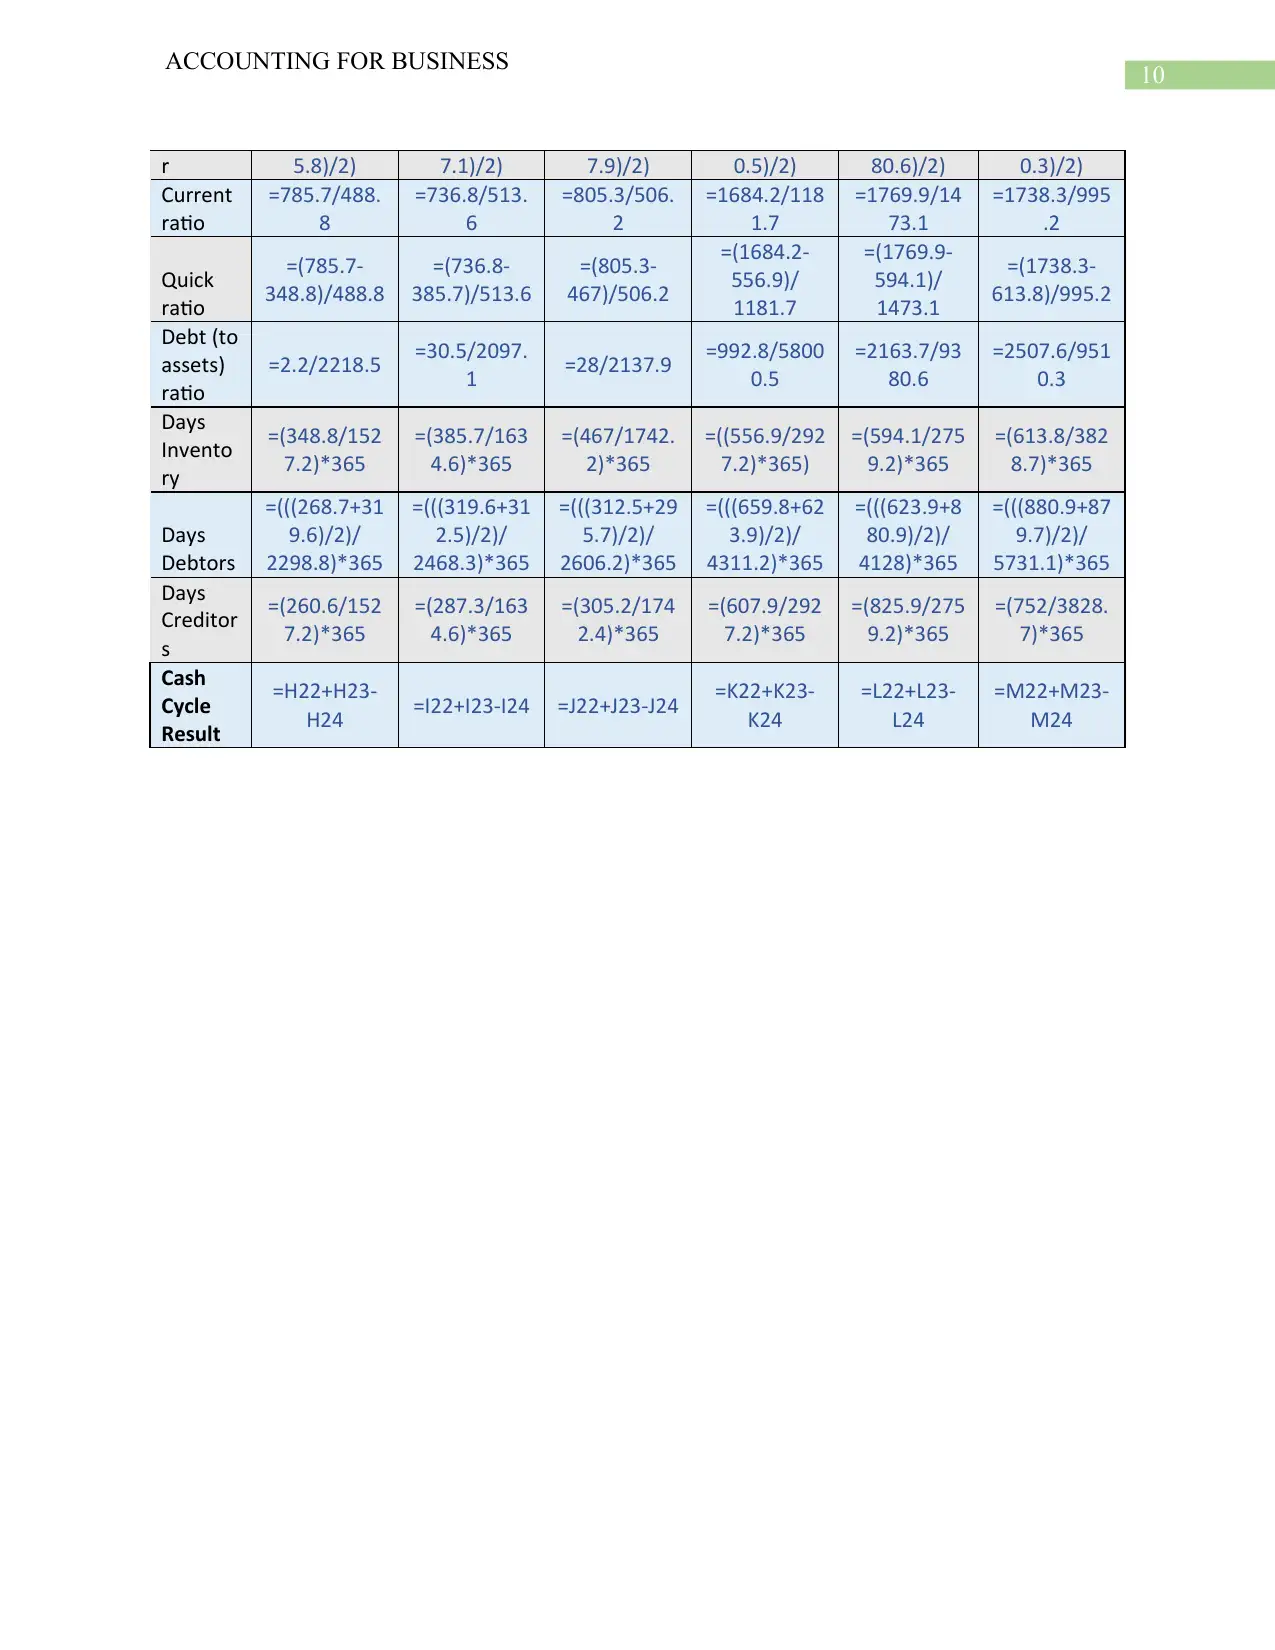
r 5.8)/2) 7.1)/2) 7.9)/2) 0.5)/2) 80.6)/2) 0.3)/2)
Current
ratio
=785.7/488.
8
=736.8/513.
6
=805.3/506.
2
=1684.2/118
1.7
=1769.9/14
73.1
=1738.3/995
.2
Quick
ratio
=(785.7-
348.8)/488.8
=(736.8-
385.7)/513.6
=(805.3-
467)/506.2
=(1684.2-
556.9)/
1181.7
=(1769.9-
594.1)/
1473.1
=(1738.3-
613.8)/995.2
Debt (to
assets)
ratio
=2.2/2218.5 =30.5/2097.
1 =28/2137.9 =992.8/5800
0.5
=2163.7/93
80.6
=2507.6/951
0.3
Days
Invento
ry
=(348.8/152
7.2)*365
=(385.7/163
4.6)*365
=(467/1742.
2)*365
=((556.9/292
7.2)*365)
=(594.1/275
9.2)*365
=(613.8/382
8.7)*365
Days
Debtors
=(((268.7+31
9.6)/2)/
2298.8)*365
=(((319.6+31
2.5)/2)/
2468.3)*365
=(((312.5+29
5.7)/2)/
2606.2)*365
=(((659.8+62
3.9)/2)/
4311.2)*365
=(((623.9+8
80.9)/2)/
4128)*365
=(((880.9+87
9.7)/2)/
5731.1)*365
Days
Creditor
s
=(260.6/152
7.2)*365
=(287.3/163
4.6)*365
=(305.2/174
2.4)*365
=(607.9/292
7.2)*365
=(825.9/275
9.2)*365
=(752/3828.
7)*365
Cash
Cycle
Result
=H22+H23-
H24 =I22+I23-I24 =J22+J23-J24 =K22+K23-
K24
=L22+L23-
L24
=M22+M23-
M24
ACCOUNTING FOR BUSINESS
r 5.8)/2) 7.1)/2) 7.9)/2) 0.5)/2) 80.6)/2) 0.3)/2)
Current
ratio
=785.7/488.
8
=736.8/513.
6
=805.3/506.
2
=1684.2/118
1.7
=1769.9/14
73.1
=1738.3/995
.2
Quick
ratio
=(785.7-
348.8)/488.8
=(736.8-
385.7)/513.6
=(805.3-
467)/506.2
=(1684.2-
556.9)/
1181.7
=(1769.9-
594.1)/
1473.1
=(1738.3-
613.8)/995.2
Debt (to
assets)
ratio
=2.2/2218.5 =30.5/2097.
1 =28/2137.9 =992.8/5800
0.5
=2163.7/93
80.6
=2507.6/951
0.3
Days
Invento
ry
=(348.8/152
7.2)*365
=(385.7/163
4.6)*365
=(467/1742.
2)*365
=((556.9/292
7.2)*365)
=(594.1/275
9.2)*365
=(613.8/382
8.7)*365
Days
Debtors
=(((268.7+31
9.6)/2)/
2298.8)*365
=(((319.6+31
2.5)/2)/
2468.3)*365
=(((312.5+29
5.7)/2)/
2606.2)*365
=(((659.8+62
3.9)/2)/
4311.2)*365
=(((623.9+8
80.9)/2)/
4128)*365
=(((880.9+87
9.7)/2)/
5731.1)*365
Days
Creditor
s
=(260.6/152
7.2)*365
=(287.3/163
4.6)*365
=(305.2/174
2.4)*365
=(607.9/292
7.2)*365
=(825.9/275
9.2)*365
=(752/3828.
7)*365
Cash
Cycle
Result
=H22+H23-
H24 =I22+I23-I24 =J22+J23-J24 =K22+K23-
K24
=L22+L23-
L24
=M22+M23-
M24
1 out of 11
Related Documents


Your All-in-One AI-Powered Toolkit for Academic Success.
+13062052269
info@desklib.com
Available 24*7 on WhatsApp / Email
![[object Object]](/_next/static/media/star-bottom.7253800d.svg)
Unlock your academic potential
Copyright © 2020–2025 A2Z Services. All Rights Reserved. Developed and managed by ZUCOL.