Finance Report: Accounting for Decision Making and Control Analysis
VerifiedAdded on 2022/08/11
|17
|3336
|33
Report
AI Summary
This report analyzes accounting for decision making and control, addressing cost allocation, revenue reconciliation, and financial performance. It begins with a cost analysis of support services, comparing traditional and activity-based costing methods, and evaluates the profitability of telephone support and on-site services. The report then applies DuPont analysis to assess and compare the financial performance of two companies, evaluating their profitability, asset turnover, and return on equity. Finally, it examines revenue budgeting, reconciliation, and performance evaluation, considering factors such as student numbers, course fees, and feedback scores. The analysis includes a revenue reconciliation statement, and assesses the performance of marketing, program administration, and faculty.
Running head: ACCOUNTING FOR DECISION MAKING AND CONTROL
Accounting for Decision Making and Control
Name of the Student:
Name of the University:
Author’s Note:
Accounting for Decision Making and Control
Name of the Student:
Name of the University:
Author’s Note:
Paraphrase This Document
Need a fresh take? Get an instant paraphrase of this document with our AI Paraphraser
1ACCOUNTING FOR DECISION MAKING AND CONTROL
Table of Contents
Answer to question 1:......................................................................................................................2
Part a:...........................................................................................................................................2
Part b:...........................................................................................................................................2
Part c:...........................................................................................................................................3
Part d:...........................................................................................................................................3
Part e:...........................................................................................................................................4
Part f:...........................................................................................................................................4
Answer to question 2:......................................................................................................................5
Part a:...........................................................................................................................................5
Part b:...........................................................................................................................................6
Answer to question 3:......................................................................................................................8
Part a:...........................................................................................................................................8
Part b:...........................................................................................................................................8
Part c:...........................................................................................................................................9
Answer to question 4:....................................................................................................................10
Part a:.........................................................................................................................................10
Part b:.........................................................................................................................................11
Answer to question 5:....................................................................................................................11
Part a:.........................................................................................................................................11
2ACCOUNTING FOR DECISION MAKING AND CONTROL
Part b:.........................................................................................................................................11
Part c:.........................................................................................................................................12
Part d:.........................................................................................................................................12
Part e:.........................................................................................................................................12
Bibliography:.................................................................................................................................14
⊘ This is a preview!⊘
Do you want full access?
Subscribe today to unlock all pages.
Trusted by 1+ million students worldwide
3ACCOUNTING FOR DECISION MAKING AND CONTROL
Answer to question 1:
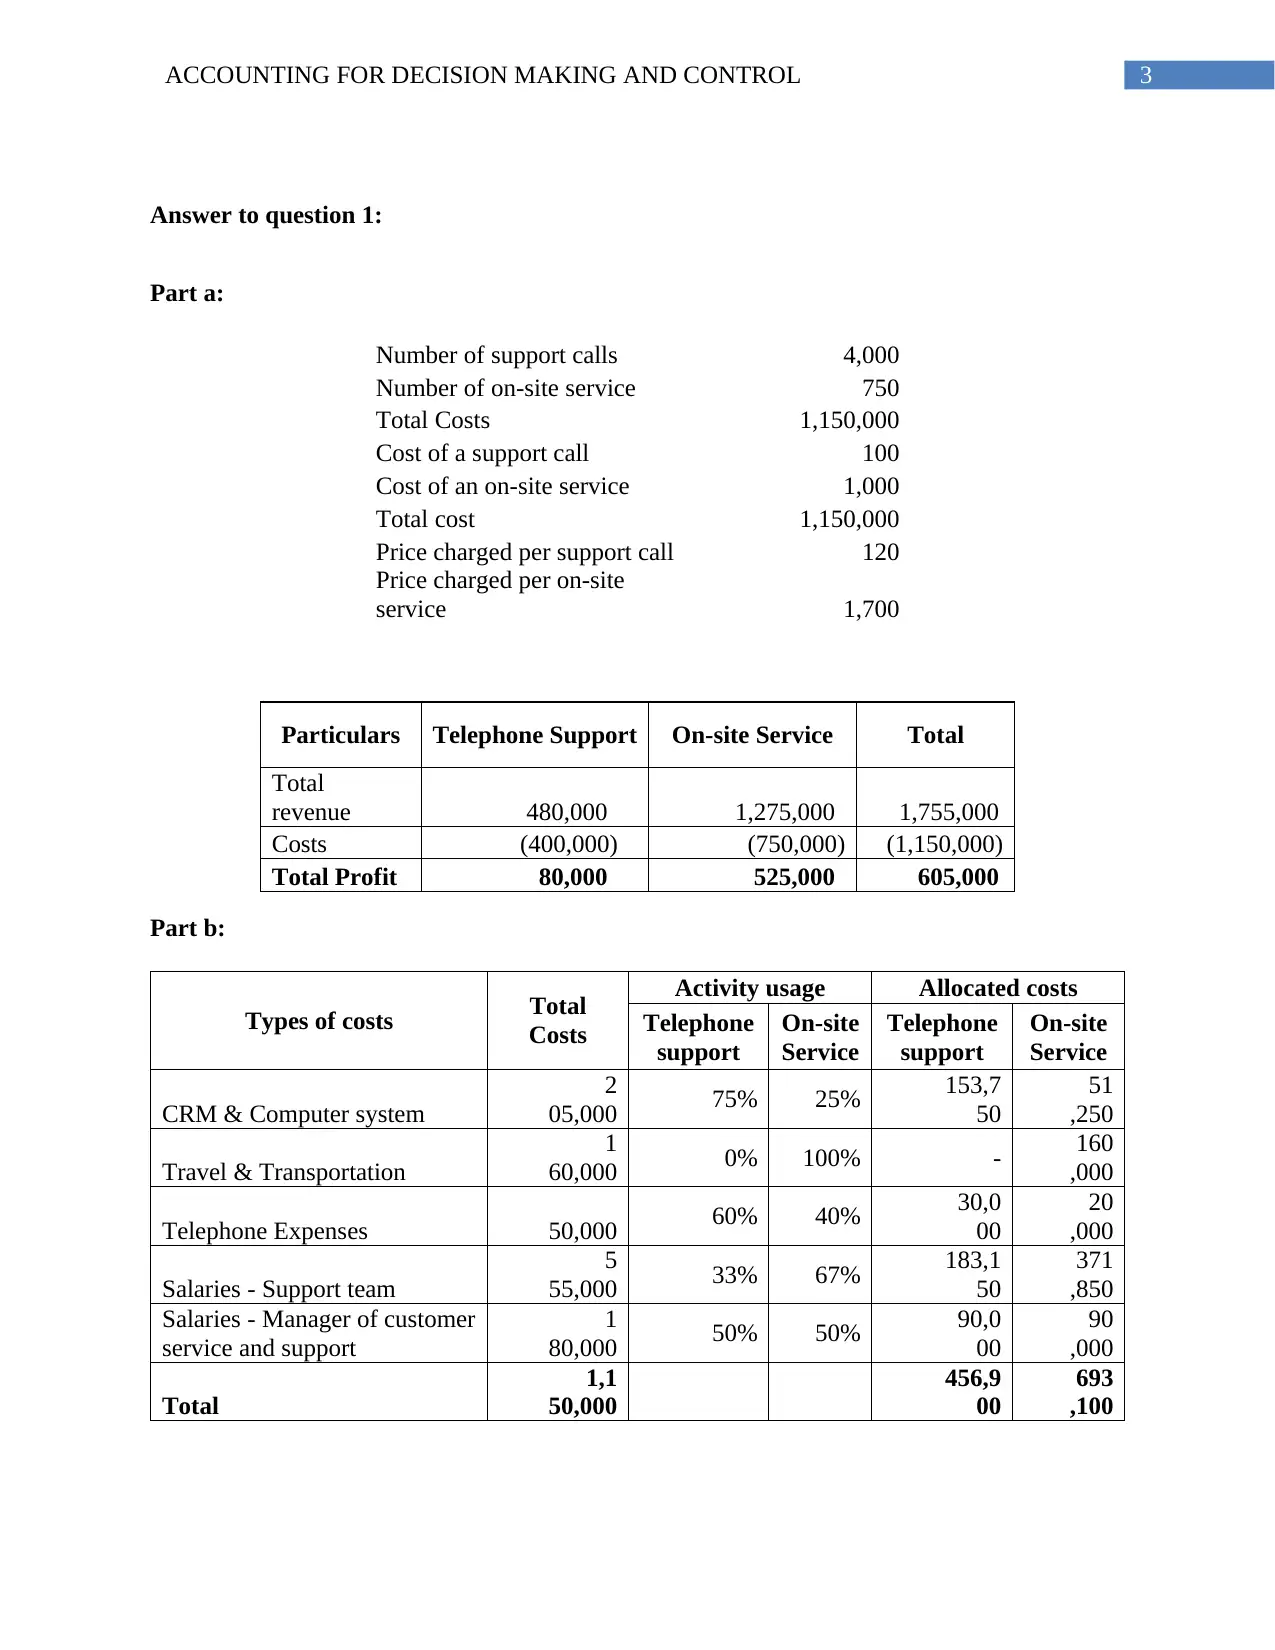
Part a:
Number of support calls 4,000
Number of on-site service 750
Total Costs 1,150,000
Cost of a support call 100
Cost of an on-site service 1,000
Total cost 1,150,000
Price charged per support call 120
Price charged per on-site
service 1,700
Particulars Telephone Support On-site Service Total
Total
revenue 480,000 1,275,000 1,755,000
Costs (400,000) (750,000) (1,150,000)
Total Profit 80,000 525,000 605,000
Part b:
Types of costs Total
Costs
Activity usage Allocated costs
Telephone
support
On-site
Service
Telephone
support
On-site
Service
CRM & Computer system
2
05,000 75% 25% 153,7
50
51
,250
Travel & Transportation
1
60,000 0% 100% - 160
,000
Telephone Expenses 50,000 60% 40% 30,0
00
20
,000
Salaries - Support team
5
55,000 33% 67% 183,1
50
371
,850
Salaries - Manager of customer
service and support
1
80,000 50% 50% 90,0
00
90
,000
Total
1,1
50,000
456,9
00
693
,100
Answer to question 1:
Part a:
Number of support calls 4,000
Number of on-site service 750
Total Costs 1,150,000
Cost of a support call 100
Cost of an on-site service 1,000
Total cost 1,150,000
Price charged per support call 120
Price charged per on-site
service 1,700
Particulars Telephone Support On-site Service Total
Total
revenue 480,000 1,275,000 1,755,000
Costs (400,000) (750,000) (1,150,000)
Total Profit 80,000 525,000 605,000
Part b:
Types of costs Total
Costs
Activity usage Allocated costs
Telephone
support
On-site
Service
Telephone
support
On-site
Service
CRM & Computer system
2
05,000 75% 25% 153,7
50
51
,250
Travel & Transportation
1
60,000 0% 100% - 160
,000
Telephone Expenses 50,000 60% 40% 30,0
00
20
,000
Salaries - Support team
5
55,000 33% 67% 183,1
50
371
,850
Salaries - Manager of customer
service and support
1
80,000 50% 50% 90,0
00
90
,000
Total
1,1
50,000
456,9
00
693
,100
Paraphrase This Document
Need a fresh take? Get an instant paraphrase of this document with our AI Paraphraser
4ACCOUNTING FOR DECISION MAKING AND CONTROL
Particulars Telephone support On-site Service
Total allocated costs 456,900 693,100
Number of calls and services 4000 750
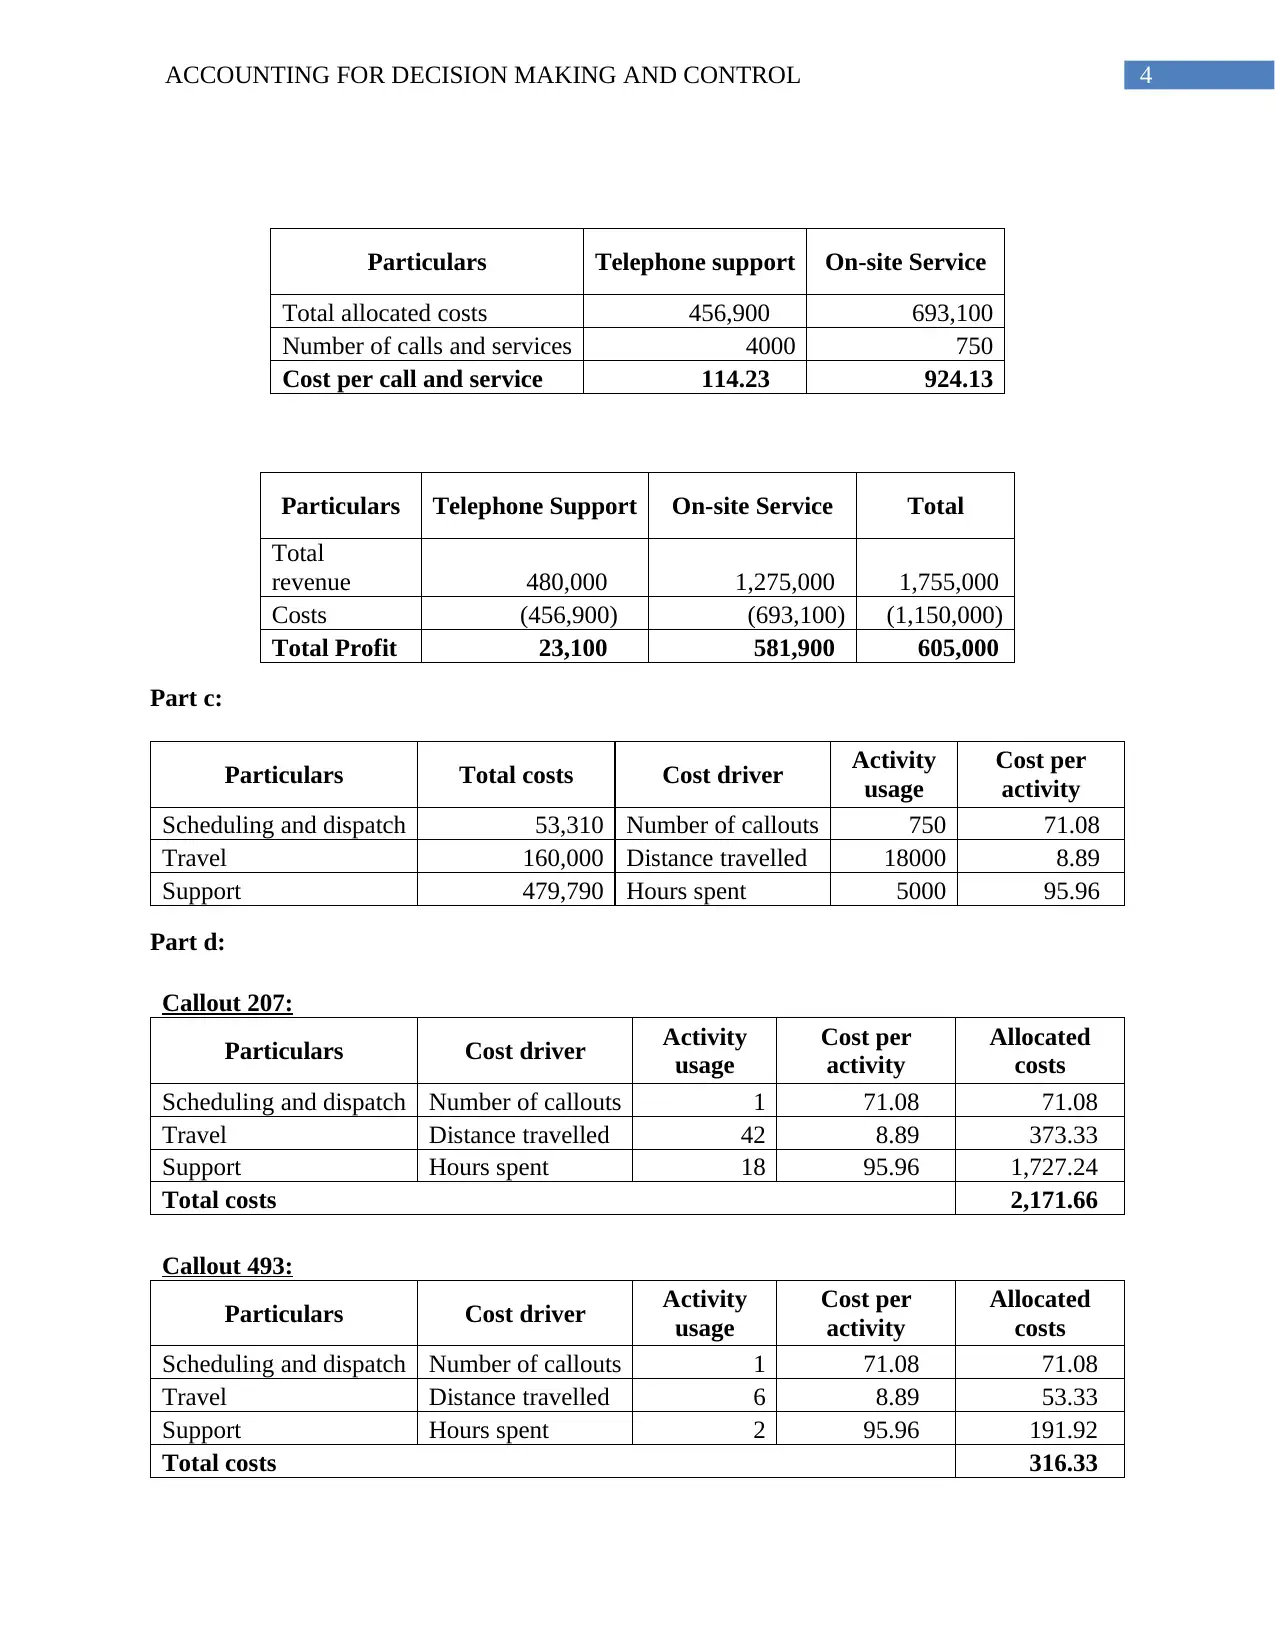
Cost per call and service 114.23 924.13
Particulars Telephone Support On-site Service Total
Total
revenue 480,000 1,275,000 1,755,000
Costs (456,900) (693,100) (1,150,000)
Total Profit 23,100 581,900 605,000
Part c:
Particulars Total costs Cost driver Activity
usage
Cost per
activity
Scheduling and dispatch 53,310 Number of callouts 750 71.08
Travel 160,000 Distance travelled 18000 8.89
Support 479,790 Hours spent 5000 95.96
Part d:
Callout 207:
Particulars Cost driver Activity
usage
Cost per
activity
Allocated
costs
Scheduling and dispatch Number of callouts 1 71.08 71.08
Travel Distance travelled 42 8.89 373.33
Support Hours spent 18 95.96 1,727.24
Total costs 2,171.66
Callout 493:
Particulars Cost driver Activity
usage
Cost per
activity
Allocated
costs
Scheduling and dispatch Number of callouts 1 71.08 71.08
Travel Distance travelled 6 8.89 53.33
Support Hours spent 2 95.96 191.92
Total costs 316.33
Particulars Telephone support On-site Service
Total allocated costs 456,900 693,100
Number of calls and services 4000 750
Cost per call and service 114.23 924.13
Particulars Telephone Support On-site Service Total
Total
revenue 480,000 1,275,000 1,755,000
Costs (456,900) (693,100) (1,150,000)
Total Profit 23,100 581,900 605,000
Part c:
Particulars Total costs Cost driver Activity
usage
Cost per
activity
Scheduling and dispatch 53,310 Number of callouts 750 71.08
Travel 160,000 Distance travelled 18000 8.89
Support 479,790 Hours spent 5000 95.96
Part d:
Callout 207:
Particulars Cost driver Activity
usage
Cost per
activity
Allocated
costs
Scheduling and dispatch Number of callouts 1 71.08 71.08
Travel Distance travelled 42 8.89 373.33
Support Hours spent 18 95.96 1,727.24
Total costs 2,171.66
Callout 493:
Particulars Cost driver Activity
usage
Cost per
activity
Allocated
costs
Scheduling and dispatch Number of callouts 1 71.08 71.08
Travel Distance travelled 6 8.89 53.33
Support Hours spent 2 95.96 191.92
Total costs 316.33
5ACCOUNTING FOR DECISION MAKING AND CONTROL
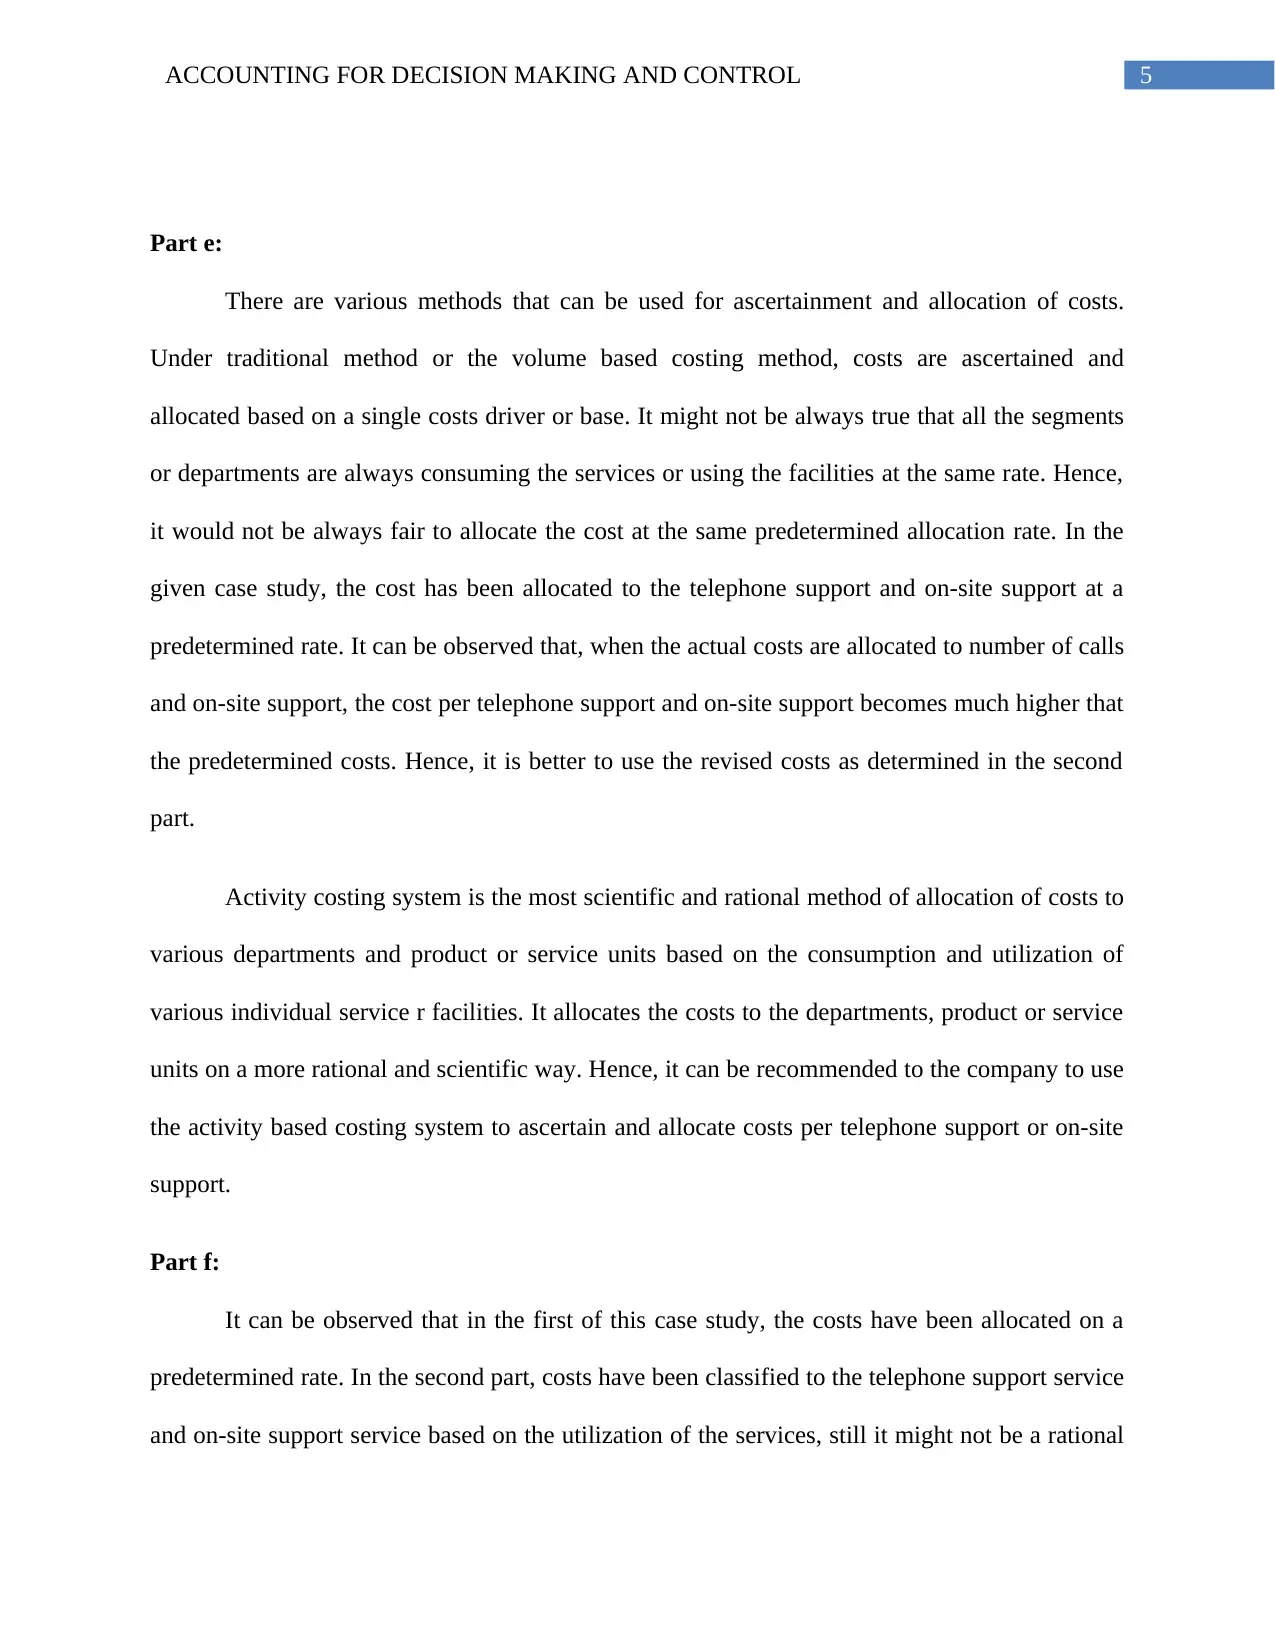
Part e:
There are various methods that can be used for ascertainment and allocation of costs.
Under traditional method or the volume based costing method, costs are ascertained and
allocated based on a single costs driver or base. It might not be always true that all the segments
or departments are always consuming the services or using the facilities at the same rate. Hence,
it would not be always fair to allocate the cost at the same predetermined allocation rate. In the
given case study, the cost has been allocated to the telephone support and on-site support at a
predetermined rate. It can be observed that, when the actual costs are allocated to number of calls
and on-site support, the cost per telephone support and on-site support becomes much higher that
the predetermined costs. Hence, it is better to use the revised costs as determined in the second
part.
Activity costing system is the most scientific and rational method of allocation of costs to
various departments and product or service units based on the consumption and utilization of
various individual service r facilities. It allocates the costs to the departments, product or service
units on a more rational and scientific way. Hence, it can be recommended to the company to use
the activity based costing system to ascertain and allocate costs per telephone support or on-site
support.
Part f:
It can be observed that in the first of this case study, the costs have been allocated on a
predetermined rate. In the second part, costs have been classified to the telephone support service
and on-site support service based on the utilization of the services, still it might not be a rational
⊘ This is a preview!⊘
Do you want full access?
Subscribe today to unlock all pages.
Trusted by 1+ million students worldwide
6ACCOUNTING FOR DECISION MAKING AND CONTROL
way of allocating costs to the telephone support and on-site service, as the time consumption for
the each of the individual telephone call and on-site support may be different. Therefore, an
activity based costing system for allocation and ascertainment of costs for each of the telephone
support and on-site service should be applied. It can be observed that, in the last part of the case
study, only a few activities have been identified for the on-site support service. There might be
other activities also which can be considered as the costs drivers and based on that costs can be
allocated further in more rational and efficient way. Moreover, for the on-site service only the
activities have been identified, though it can be identified and implemented for the telephone
support service also.
Answer to question 2:
Part a:
DuPont analysis is a method of evaluation of the financial performance and financial
strength of a company based on the return on equity calculated from various other performance
measurement ratios. In DuPont analysis the return on equity is calculated as the product of
profitability, assets turnover and the equity multiplier or the leverage of the company. In the
given case study, information related to the financial performance and financial position of the
Nimble Ned Pty Ltd and the Agile Andrea Pty Ltd have been given. The non-current liabilities of
both the companies have been computed as the balancing figure of current liabilities and equity
from the total assets. The net profit margin has been calculated from the profit after interest.
Following calculations shows the parameters of the DuPont analysis and the return on equity
under the DuPont analysis.
Paraphrase This Document
Need a fresh take? Get an instant paraphrase of this document with our AI Paraphraser
7ACCOUNTING FOR DECISION MAKING AND CONTROL
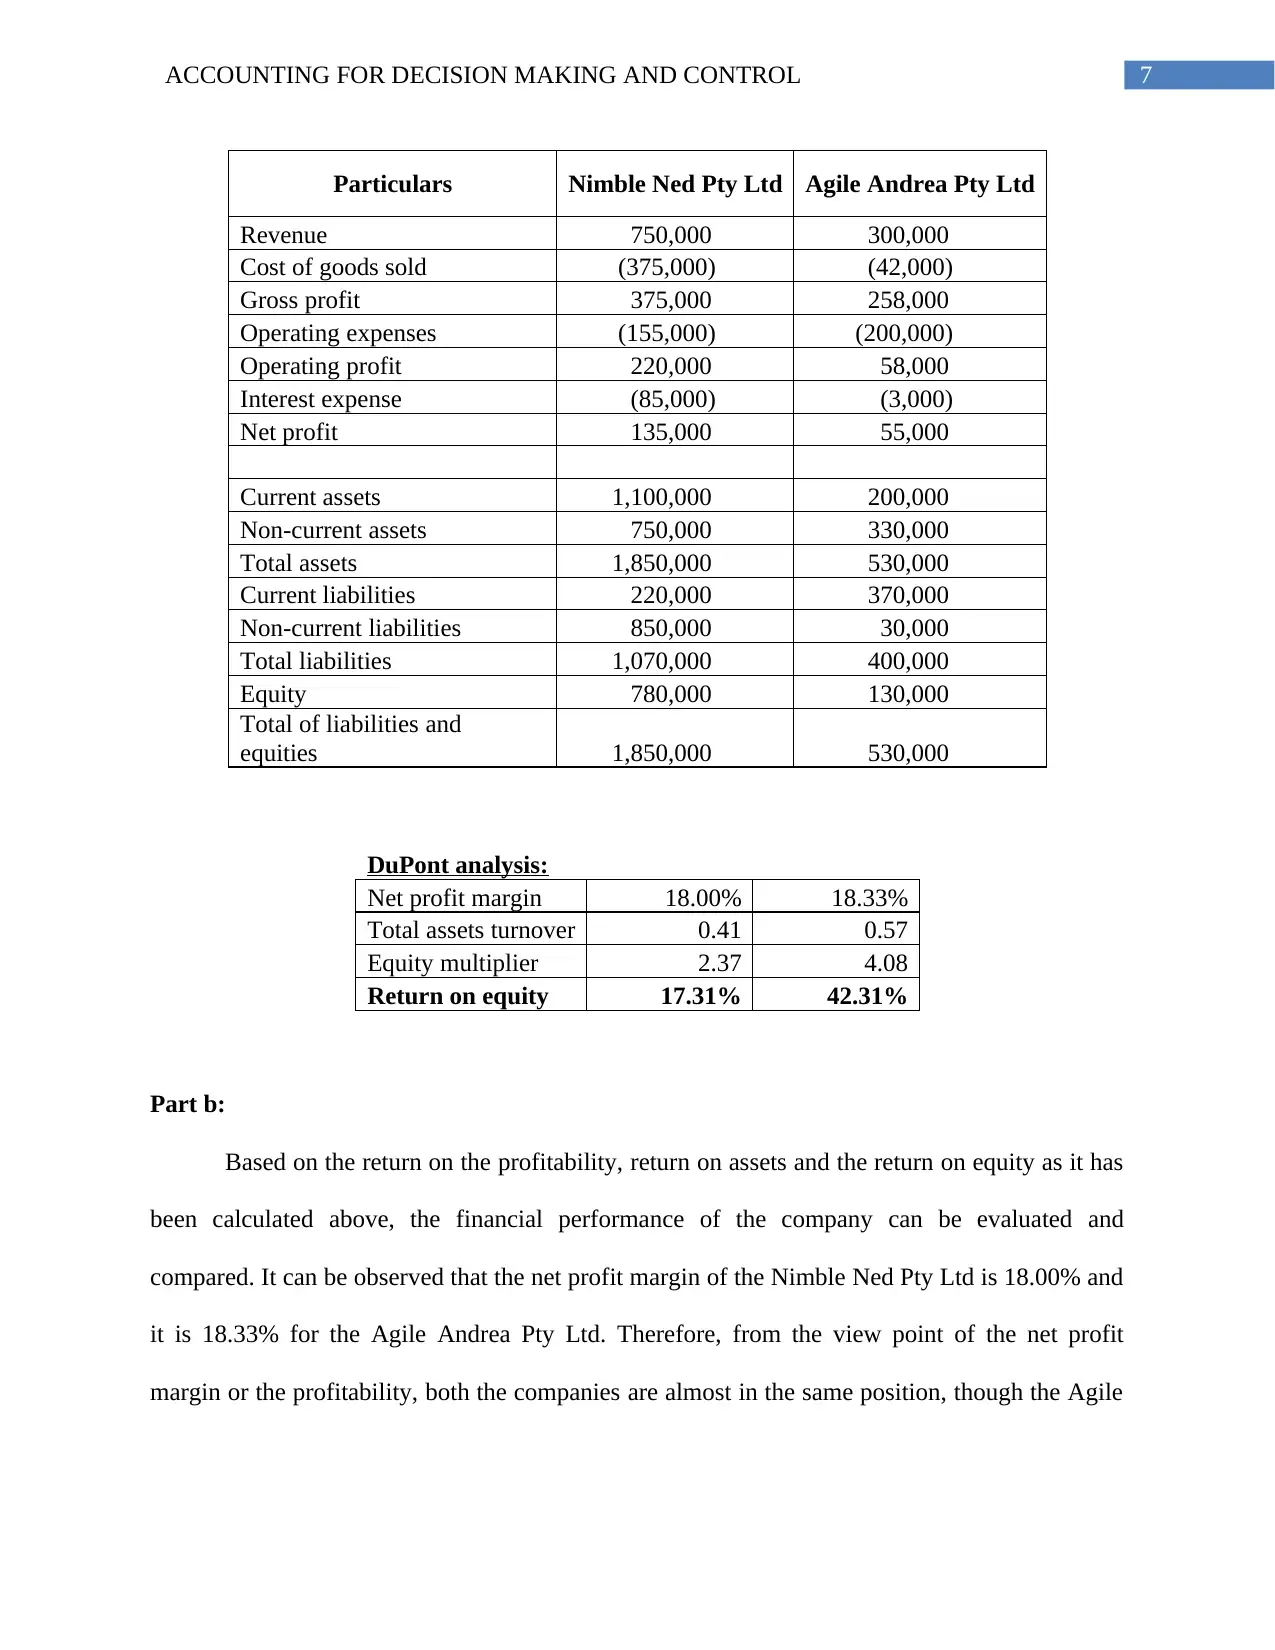
Particulars Nimble Ned Pty Ltd Agile Andrea Pty Ltd
Revenue 750,000 300,000
Cost of goods sold (375,000) (42,000)
Gross profit 375,000 258,000
Operating expenses (155,000) (200,000)
Operating profit 220,000 58,000
Interest expense (85,000) (3,000)
Net profit 135,000 55,000
Current assets 1,100,000 200,000
Non-current assets 750,000 330,000
Total assets 1,850,000 530,000
Current liabilities 220,000 370,000
Non-current liabilities 850,000 30,000
Total liabilities 1,070,000 400,000
Equity 780,000 130,000
Total of liabilities and
equities 1,850,000 530,000
DuPont analysis:
Net profit margin 18.00% 18.33%
Total assets turnover 0.41 0.57
Equity multiplier 2.37 4.08
Return on equity 17.31% 42.31%
Part b:
Based on the return on the profitability, return on assets and the return on equity as it has
been calculated above, the financial performance of the company can be evaluated and
compared. It can be observed that the net profit margin of the Nimble Ned Pty Ltd is 18.00% and
it is 18.33% for the Agile Andrea Pty Ltd. Therefore, from the view point of the net profit
margin or the profitability, both the companies are almost in the same position, though the Agile
8ACCOUNTING FOR DECISION MAKING AND CONTROL
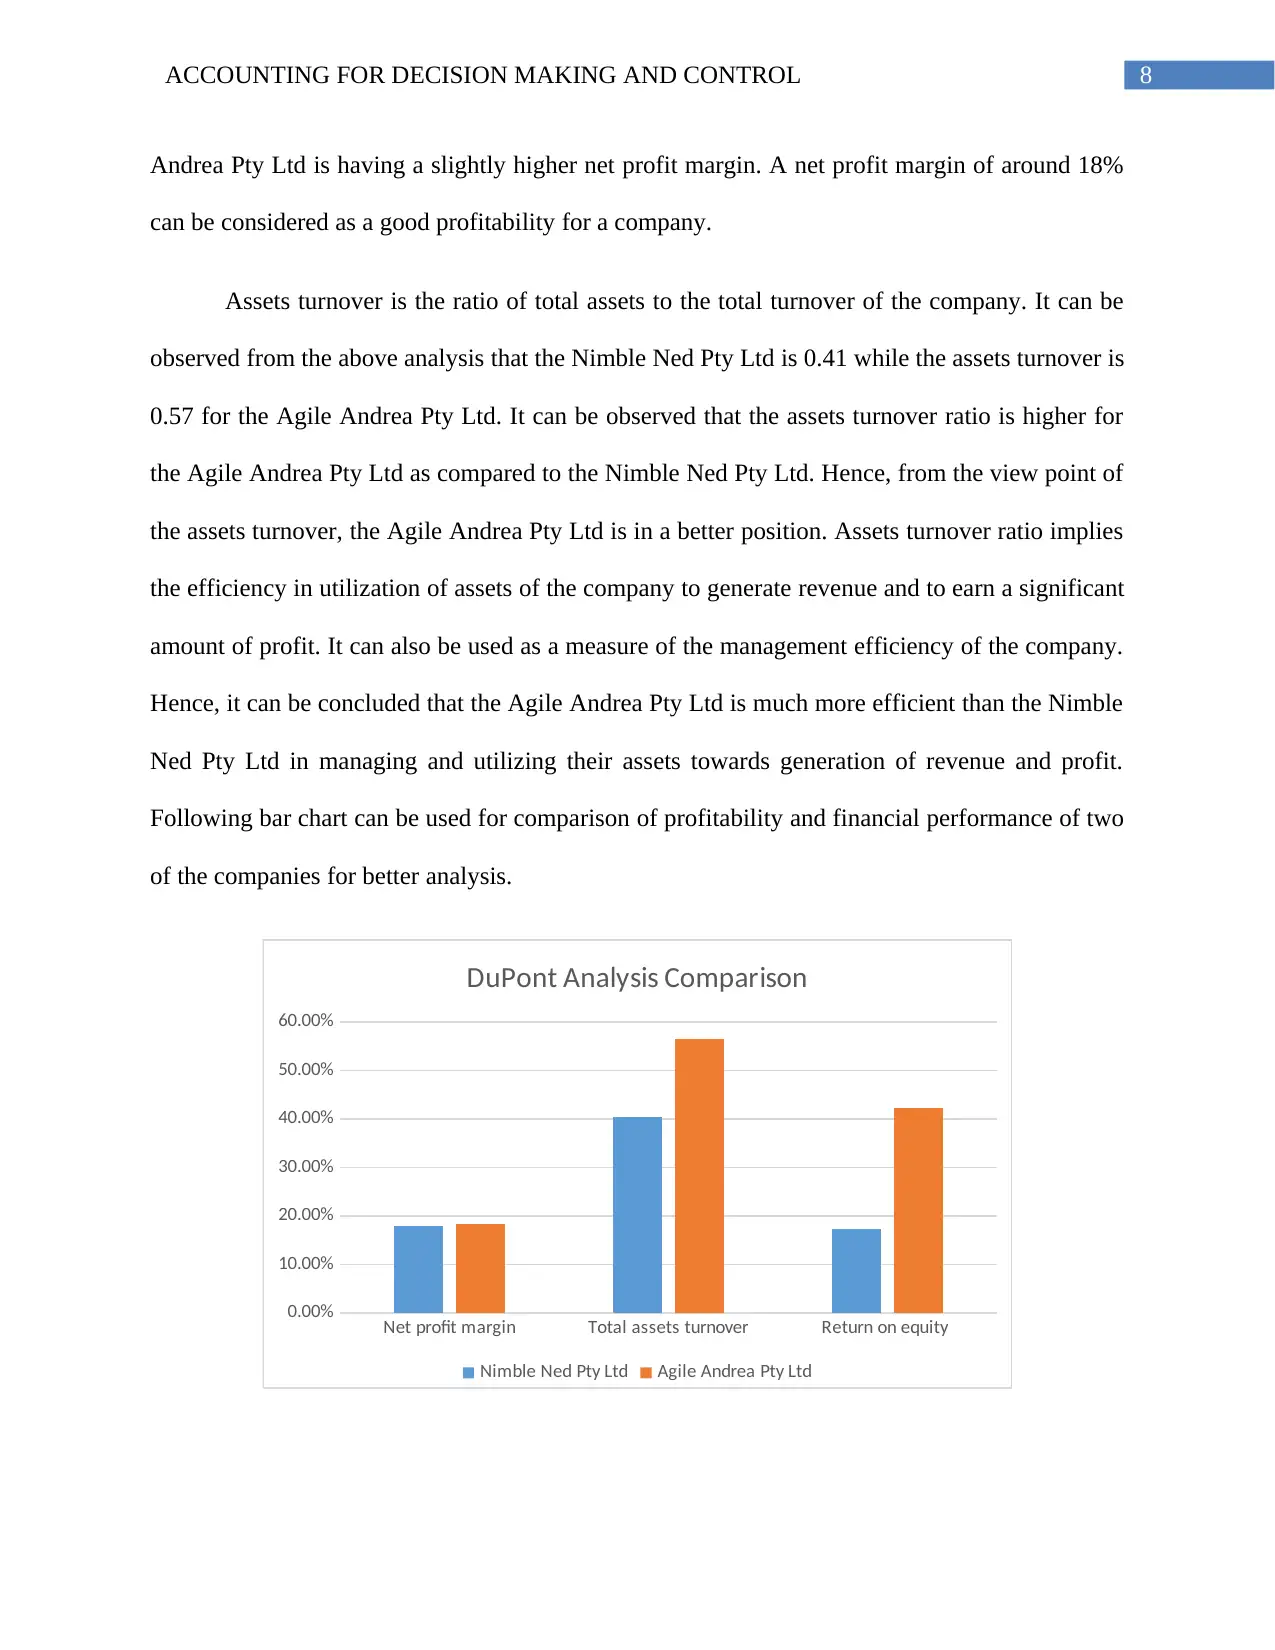
Andrea Pty Ltd is having a slightly higher net profit margin. A net profit margin of around 18%
can be considered as a good profitability for a company.
Assets turnover is the ratio of total assets to the total turnover of the company. It can be
observed from the above analysis that the Nimble Ned Pty Ltd is 0.41 while the assets turnover is
0.57 for the Agile Andrea Pty Ltd. It can be observed that the assets turnover ratio is higher for
the Agile Andrea Pty Ltd as compared to the Nimble Ned Pty Ltd. Hence, from the view point of
the assets turnover, the Agile Andrea Pty Ltd is in a better position. Assets turnover ratio implies
the efficiency in utilization of assets of the company to generate revenue and to earn a significant
amount of profit. It can also be used as a measure of the management efficiency of the company.
Hence, it can be concluded that the Agile Andrea Pty Ltd is much more efficient than the Nimble
Ned Pty Ltd in managing and utilizing their assets towards generation of revenue and profit.
Following bar chart can be used for comparison of profitability and financial performance of two
of the companies for better analysis.
Net profit margin Total assets turnover Return on equity
0.00%
10.00%
20.00%
30.00%
40.00%
50.00%
60.00%
DuPont Analysis Comparison
Nimble Ned Pty Ltd Agile Andrea Pty Ltd
⊘ This is a preview!⊘
Do you want full access?
Subscribe today to unlock all pages.
Trusted by 1+ million students worldwide
9ACCOUNTING FOR DECISION MAKING AND CONTROL
Return on equity is another measure of the profitability and management efficiency of the
company. It can be observed that the return on equity for the Nimble Ned Pty Ltd is 17.31%,
while the return on equity is 42.31% for the Agile Andrea Pty Ltd. Therefor it can be concluded
that with the higher profit margin, assets turnover and equity multiplier, the Agile Andrea Pty
Ltd is having better financial performance and financial position as compared to the financial
performance and financial position of Nimble Ned Pty Ltd.
Answer to question 3:
Part a:
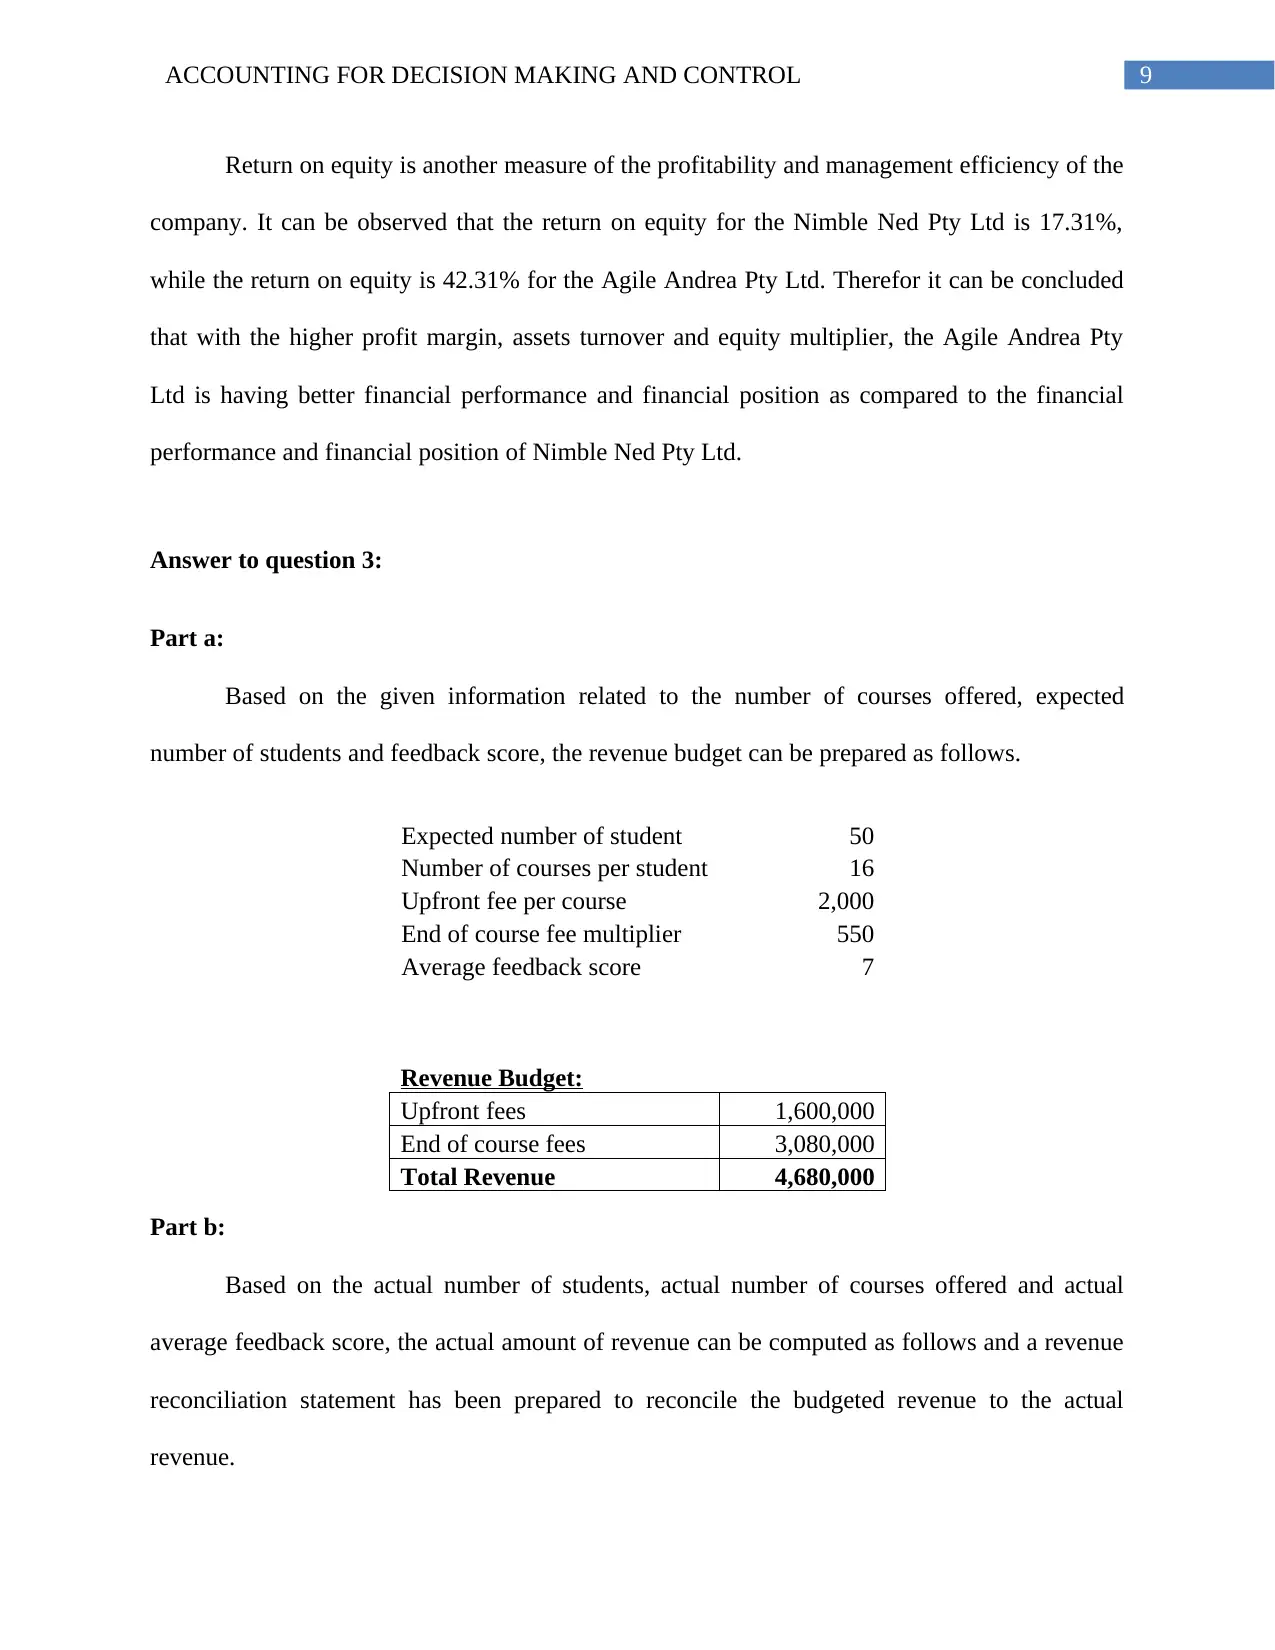
Based on the given information related to the number of courses offered, expected
number of students and feedback score, the revenue budget can be prepared as follows.
Expected number of student 50
Number of courses per student 16
Upfront fee per course 2,000
End of course fee multiplier 550
Average feedback score 7
Revenue Budget:
Upfront fees 1,600,000
End of course fees 3,080,000
Total Revenue 4,680,000
Part b:
Based on the actual number of students, actual number of courses offered and actual
average feedback score, the actual amount of revenue can be computed as follows and a revenue
reconciliation statement has been prepared to reconcile the budgeted revenue to the actual
revenue.
Return on equity is another measure of the profitability and management efficiency of the
company. It can be observed that the return on equity for the Nimble Ned Pty Ltd is 17.31%,
while the return on equity is 42.31% for the Agile Andrea Pty Ltd. Therefor it can be concluded
that with the higher profit margin, assets turnover and equity multiplier, the Agile Andrea Pty
Ltd is having better financial performance and financial position as compared to the financial
performance and financial position of Nimble Ned Pty Ltd.
Answer to question 3:
Part a:
Based on the given information related to the number of courses offered, expected
number of students and feedback score, the revenue budget can be prepared as follows.
Expected number of student 50
Number of courses per student 16
Upfront fee per course 2,000
End of course fee multiplier 550
Average feedback score 7
Revenue Budget:
Upfront fees 1,600,000
End of course fees 3,080,000
Total Revenue 4,680,000
Part b:
Based on the actual number of students, actual number of courses offered and actual
average feedback score, the actual amount of revenue can be computed as follows and a revenue
reconciliation statement has been prepared to reconcile the budgeted revenue to the actual
revenue.
Paraphrase This Document
Need a fresh take? Get an instant paraphrase of this document with our AI Paraphraser
10ACCOUNTING FOR DECISION MAKING AND CONTROL
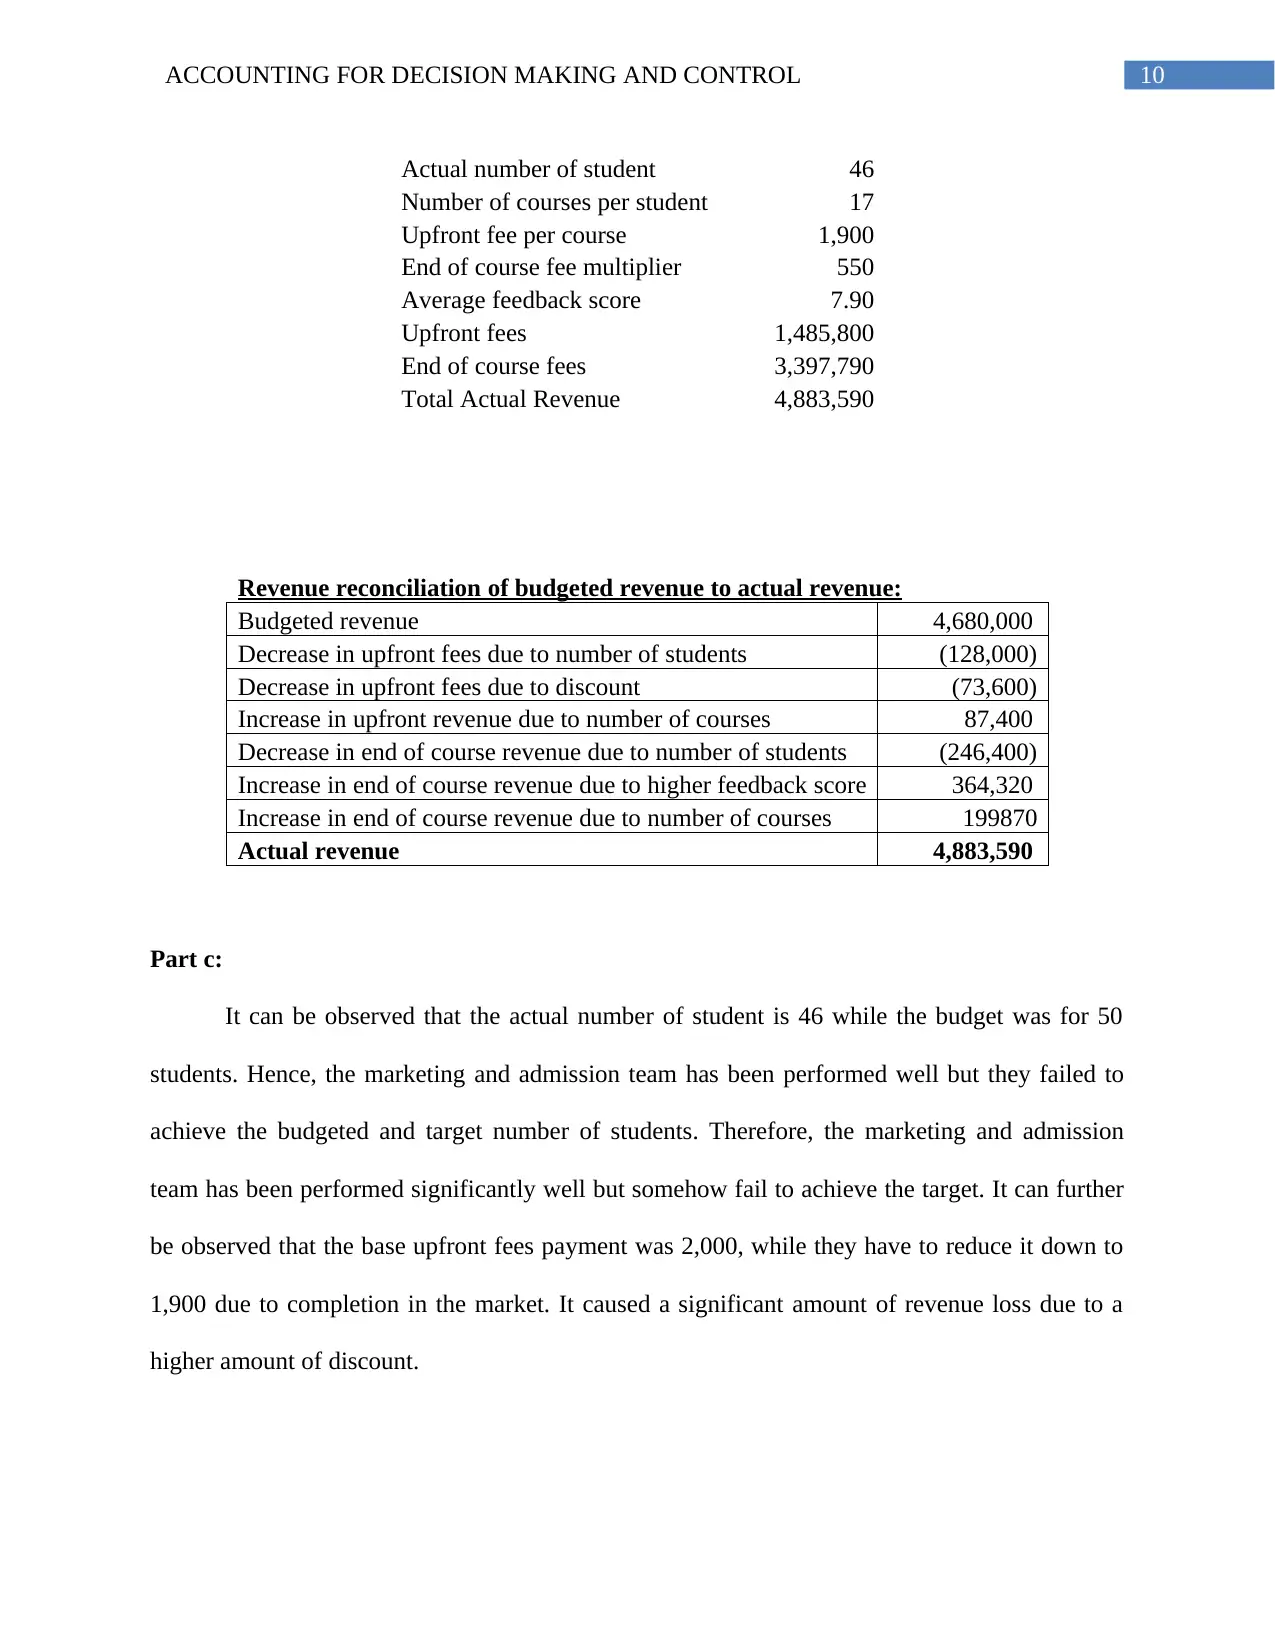
Actual number of student 46
Number of courses per student 17
Upfront fee per course 1,900
End of course fee multiplier 550
Average feedback score 7.90
Upfront fees 1,485,800
End of course fees 3,397,790
Total Actual Revenue 4,883,590
Revenue reconciliation of budgeted revenue to actual revenue:
Budgeted revenue 4,680,000
Decrease in upfront fees due to number of students (128,000)
Decrease in upfront fees due to discount (73,600)
Increase in upfront revenue due to number of courses 87,400
Decrease in end of course revenue due to number of students (246,400)
Increase in end of course revenue due to higher feedback score 364,320
Increase in end of course revenue due to number of courses 199870
Actual revenue 4,883,590
Part c:
It can be observed that the actual number of student is 46 while the budget was for 50
students. Hence, the marketing and admission team has been performed well but they failed to
achieve the budgeted and target number of students. Therefore, the marketing and admission
team has been performed significantly well but somehow fail to achieve the target. It can further
be observed that the base upfront fees payment was 2,000, while they have to reduce it down to
1,900 due to completion in the market. It caused a significant amount of revenue loss due to a
higher amount of discount.
11ACCOUNTING FOR DECISION MAKING AND CONTROL
The programme admin is responsible for the course structure and conducting the courses
successfully. It can be observed that, while there was a budget for 16 number of courses, they
managed to offer 17 number of courses actually, which implies a better performance of the
programme admin. Moreover, it has been estimated that there would be an average feedback
score of 7, while the actual average feedback score is 7.9. It contributed significantly to the total
revenue of the organization, as the end of course fee depends on the feedback score. Therefore, it
can be concluded that the programme admin performed very well.
Faculties of the organization are responsible for the efficient delivery of the course and
successful completion of the course. Based on the average feedback score of the students, it can
be concluded that the faculties of the organization have performed very well though there are
still ample scope of improvement of the service leading to a full satisfaction and higher feedback
score.
Answer to question 4:
Part a:
Strategies are the set of alternative plans for an organization which are built up for
achieving the mission and vision or overall objectives of the organization. It always have
different alternatives and changing plans for different and changing situations. Execution or
implementation of the strategies at the management level and at the ground level of an
organization is the way in which the organization can achieve their mission and vision.
Performance measure of the organization as well as the employees are important for
evaluating the performance of the organization and to find out any discrepancies and to take
⊘ This is a preview!⊘
Do you want full access?
Subscribe today to unlock all pages.
Trusted by 1+ million students worldwide
1 out of 17

Your All-in-One AI-Powered Toolkit for Academic Success.
+13062052269
info@desklib.com
Available 24*7 on WhatsApp / Email
![[object Object]](/_next/static/media/star-bottom.7253800d.svg)
Unlock your academic potential
Copyright © 2020–2026 A2Z Services. All Rights Reserved. Developed and managed by ZUCOL.