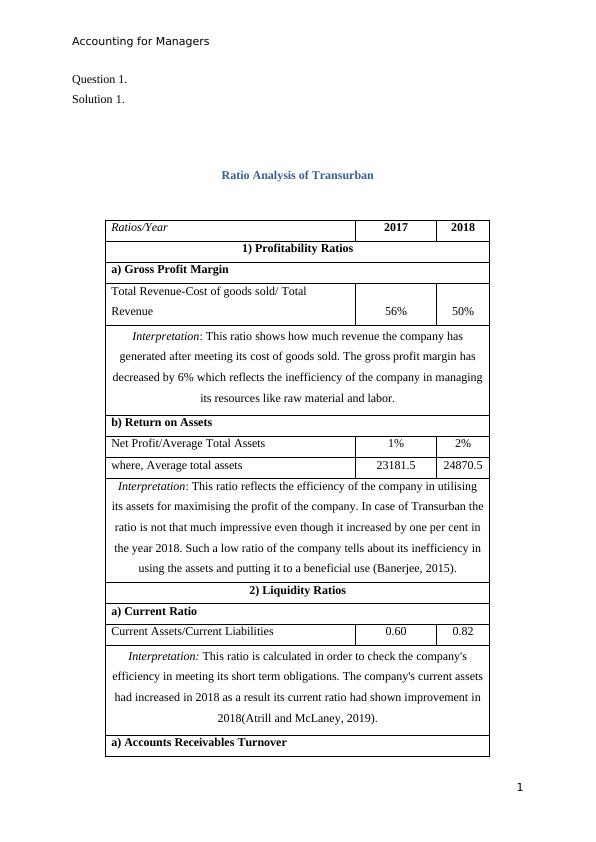
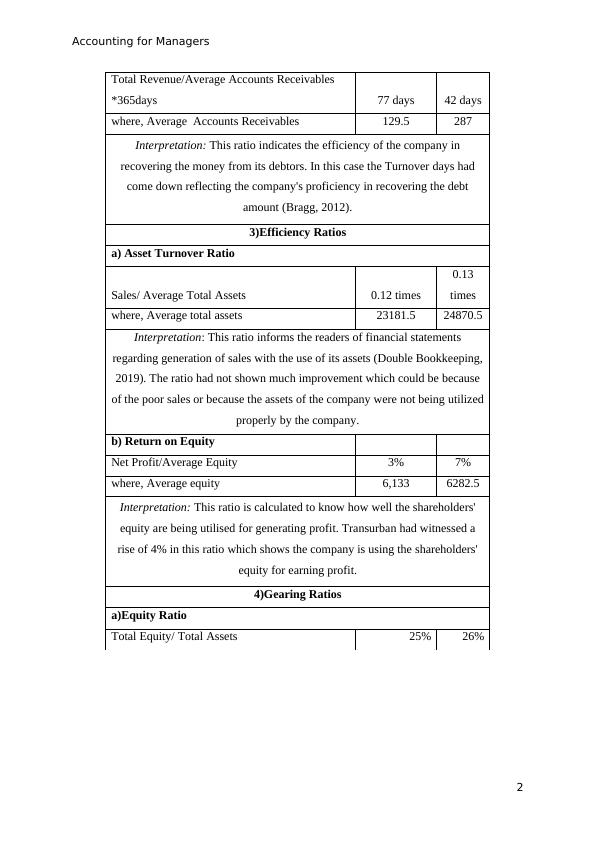
Ratio Analysis of Transurban
Compare the financial results of Transurban between 2017 and 2018 using their annual report, and explain how they are meeting the UN Sustainable Development Goals.
7 Pages1239 Words189 Views
Added on 2022-11-26
About This Document
This document provides a detailed ratio analysis of Transurban, including profitability ratios, liquidity ratios, efficiency ratios, and gearing ratios. It also offers interpretations and recommendations for improving the company's financial position.
Ratio Analysis of Transurban
Compare the financial results of Transurban between 2017 and 2018 using their annual report, and explain how they are meeting the UN Sustainable Development Goals.
Added on 2022-11-26
ShareRelated Documents
End of preview
Want to access all the pages? Upload your documents or become a member.
Principle of Finance: Income Statement, Balance Sheet, Ratio Analysis
|7
|939
|32
Evaluation of Company's Financial Position and Ratios
|10
|1161
|218
Ratio Analysis: Use of Accounting Concepts
|9
|1700
|186
Formulas for Ratio - Assignment
|4
|212
|35
Ratio Analysis and Overhead Calculation in Accounting
|10
|1256
|489
Ratio Analysis of Tesco Plc for 2018-2019
|15
|3290
|447