ACC00724 Accounting for Managers: A Financial Report on JB Hi-Fi
VerifiedAdded on 2023/06/09
|8
|1565
|231
Report
AI Summary
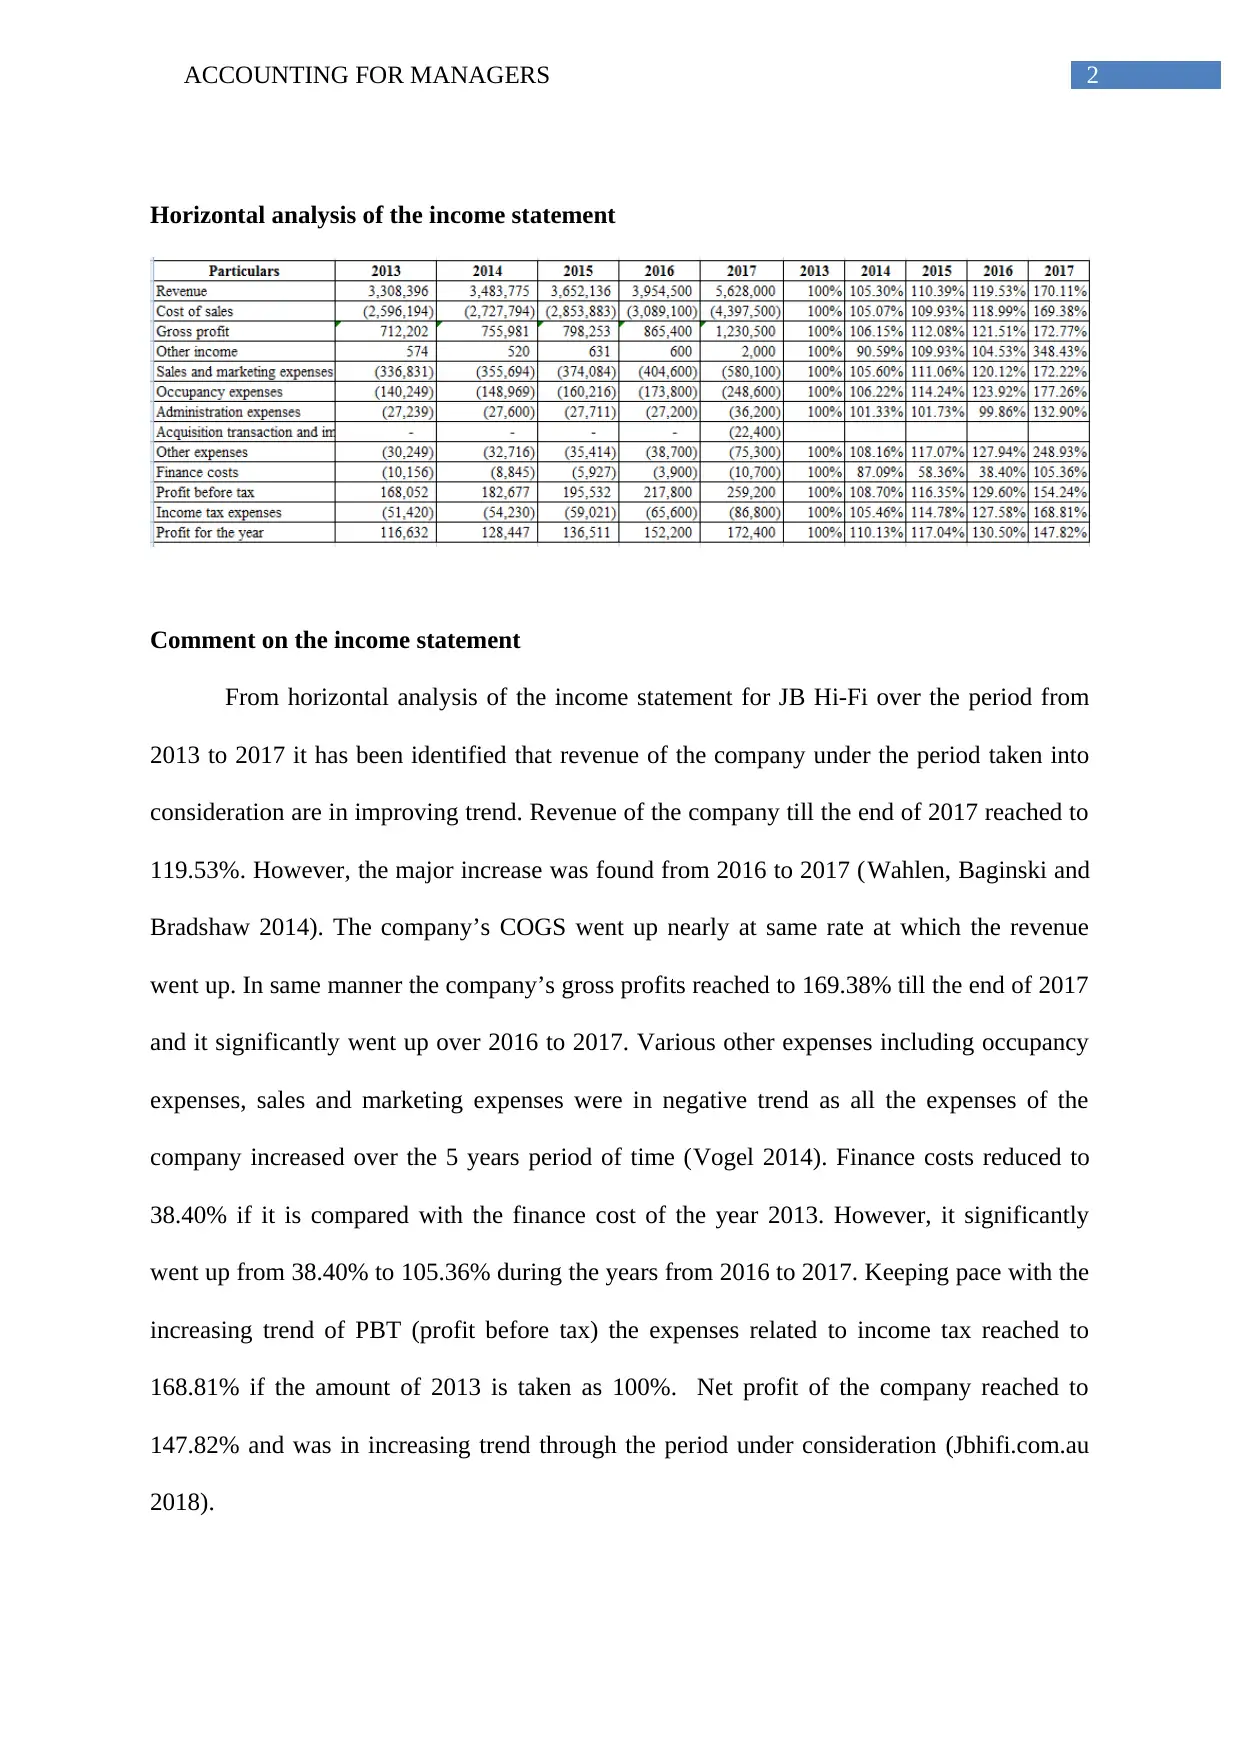
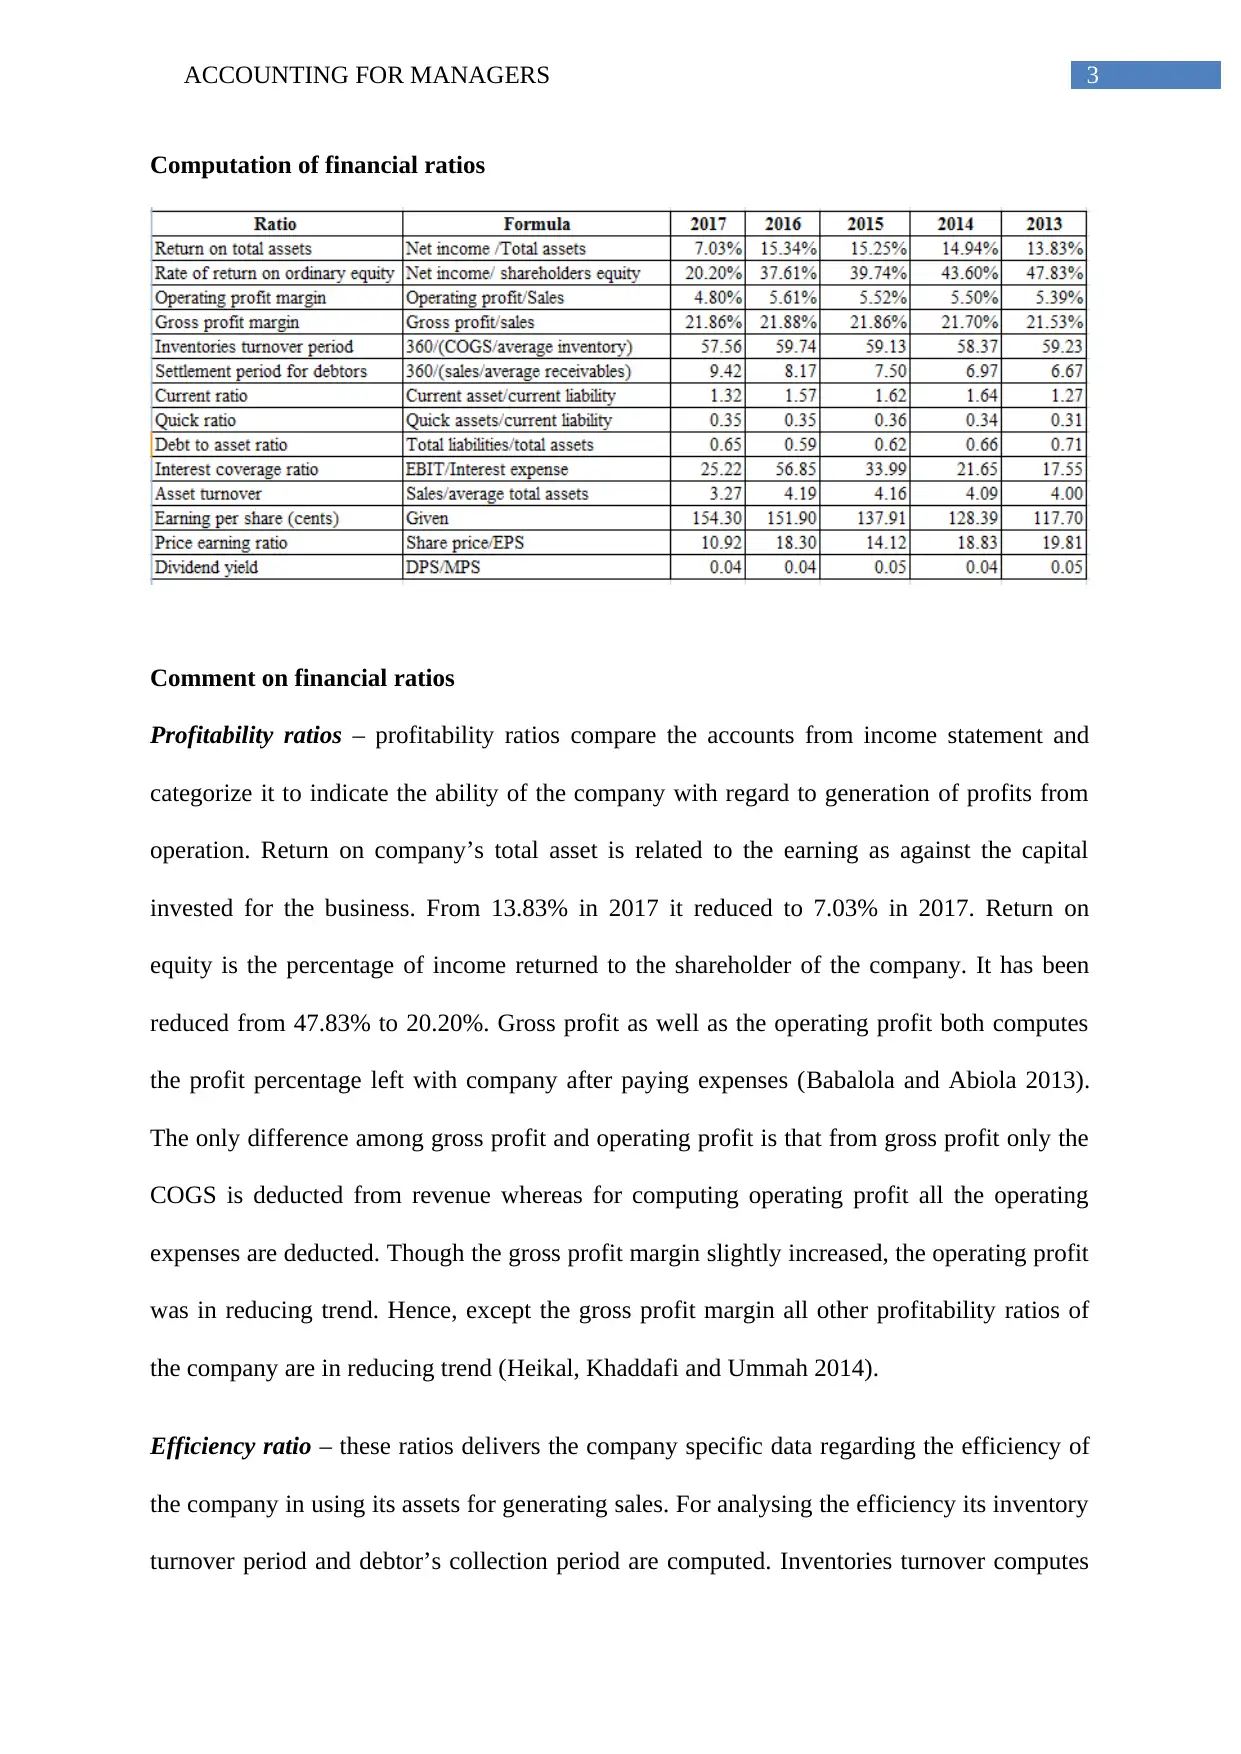
This report provides a comprehensive financial analysis of JB Hi-Fi Ltd from 2013 to 2017. It includes a horizontal analysis of the income statement, highlighting revenue growth and expense trends. Key financial ratios such as profitability, efficiency, liquidity, financial gearing, and investment r...

Running head: ACCOUNTING FOR MANAGERS
Accounting for managers
Name of the student
Name of the university
Student ID
Author note
Accounting for managers
Name of the student
Name of the university
Student ID
Author note
Paraphrase This Document
Need a fresh take? Get an instant paraphrase of this document with our AI Paraphraser

1ACCOUNTING FOR MANAGERS
Table of Contents
Horizontal analysis of the income statement.............................................................................2
Comment on the income statement............................................................................................2
Computation of financial ratios..................................................................................................3
Comment on financial ratios......................................................................................................3
Reference....................................................................................................................................6

2ACCOUNTING FOR MANAGERS
Horizontal analysis of the income statement
Comment on the income statement
From horizontal analysis of the income statement for JB Hi-Fi over the period from
2013 to 2017 it has been identified that revenue of the company under the period taken into
consideration are in improving trend. Revenue of the company till the end of 2017 reached to
119.53%. However, the major increase was found from 2016 to 2017 (Wahlen, Baginski and
Bradshaw 2014). The company’s COGS went up nearly at same rate at which the revenue
went up. In same manner the company’s gross profits reached to 169.38% till the end of 2017
and it significantly went up over 2016 to 2017. Various other expenses including occupancy
expenses, sales and marketing expenses were in negative trend as all the expenses of the
company increased over the 5 years period of time (Vogel 2014). Finance costs reduced to
38.40% if it is compared with the finance cost of the year 2013. However, it significantly
went up from 38.40% to 105.36% during the years from 2016 to 2017. Keeping pace with the
increasing trend of PBT (profit before tax) the expenses related to income tax reached to
168.81% if the amount of 2013 is taken as 100%. Net profit of the company reached to
147.82% and was in increasing trend through the period under consideration (Jbhifi.com.au
2018).
⊘ This is a preview!⊘
Do you want full access?
Subscribe today to unlock all pages.

Trusted by 1+ million students worldwide

3ACCOUNTING FOR MANAGERS
Computation of financial ratios
Comment on financial ratios
Profitability ratios – profitability ratios compare the accounts from income statement and
categorize it to indicate the ability of the company with regard to generation of profits from
operation. Return on company’s total asset is related to the earning as against the capital
invested for the business. From 13.83% in 2017 it reduced to 7.03% in 2017. Return on
equity is the percentage of income returned to the shareholder of the company. It has been
reduced from 47.83% to 20.20%. Gross profit as well as the operating profit both computes
the profit percentage left with company after paying expenses (Babalola and Abiola 2013).
The only difference among gross profit and operating profit is that from gross profit only the
COGS is deducted from revenue whereas for computing operating profit all the operating
expenses are deducted. Though the gross profit margin slightly increased, the operating profit
was in reducing trend. Hence, except the gross profit margin all other profitability ratios of
the company are in reducing trend (Heikal, Khaddafi and Ummah 2014).
Efficiency ratio – these ratios delivers the company specific data regarding the efficiency of
the company in using its assets for generating sales. For analysing the efficiency its inventory
turnover period and debtor’s collection period are computed. Inventories turnover computes
Paraphrase This Document
Need a fresh take? Get an instant paraphrase of this document with our AI Paraphraser

4ACCOUNTING FOR MANAGERS
the efficiency of the entity regarding managing the inventory level. It indicates the time a
company replaced or sold its inventories within a specific period usually a year. Big changes
were not found for managing the inventory level and the inventories are replaced in 57 to 59
days (Jbhifi.com.au 2018). On the other hand, debtor’s collection period indicates the days
consumed by the company to collect its dues from the sales made on credit. It has been found
that the company is very efficient in collecting its dues from credit sales as the dues are
collected in 6 to 10 days.
Liquidity ratio – it determines the company’s ability to pay off the debt when the dues
become payable. In other words, it determines the efficiency of the company in converting its
short-term assets into cash which in turn will enable it to pay the short term obligations on
time. Both current ratios as well as quick ratio of the company over the period under
consideration has been improved (Mathuva 2015). Therefore, the liquidity position of the
company has been enhanced. Current ratio of 1 or more indicates that the current asset of the
company is more as compared to the current liabilities and therefore the current assets are
sufficient to pay off the obligations. Both current ratio as well as quick ratio of the company
over the period under consideration has been improved (Komala and Nugroho 2013).
However, the quick ratio of the company is quite low as it is ranged between 0.31 and 0.36
for the period under concern. It states that if the inventories are not considered the company
will face issues when the obligations will become payable.
Financial gearing ratio – it determines the long term capital level of the entity as compared
to the level of equity. Debt to asset ratio indicates the percentage of debt raised by the
company for acquiring its assets as compared to own fund like equity. Generally, 40% debt
component indicates that the company is financially healthy and lower leveraged (Enekwe,
Agu and Eziedo 2014). However, it has been found that the debt component of the company
is quite high as it is more than 60%. Interest coverage ratio of the company is indicating that

5ACCOUNTING FOR MANAGERS
the operating profits are sufficient to meet the interest obligation. Moreover, the company’s
ability to meet the interest obligation has been improved as the interest coverage ratio is
increased from 17.55 times to 25.22 times over the periods under consideration. On the
contrary, assets turnover ratio has been reduced from 4 to 3.27 (Jbhifi.com.au 2018). Hence,
the company’s ability to generate revenue as compared to the value of its asset is worsened.
Investment ratio – these are used for analysing the company’s performance with regard to its
share price, payment of dividend and earnings per share. It is majorly used by the potential
investors to analyse the company’s performance before investing their money and compare
its performance with major competitors of the company (Tayeh, Al-Jarrah and Tarhini 2015).
EPS states the percentage of profit distributed to the shareholders on each outstanding share
whereas the dividend yield is the dividend paid to the investors on each share as compared to
the share’s market price. Though the earnings per share of the company increased from
117.70 cents to 154.30 cents, dividend yield as well as PE ratio both was in reducing trend
(Jbhifi.com.au 2018).
⊘ This is a preview!⊘
Do you want full access?
Subscribe today to unlock all pages.

Trusted by 1+ million students worldwide

6ACCOUNTING FOR MANAGERS
Reference
Babalola, Y.A. and Abiola, F.R., 2013. Financial ratio analysis of firms: A tool for decision
making. International journal of management sciences, 1(4), pp.132-137.
Enekwe, C.I., Agu, C.I. and Eziedo, K.N., 2014. The effect of financial leverage on financial
performance: evidence of quoted pharmaceutical companies in Nigeria. IOSR Journal of
Economics and Finance, 5(3), pp.17-25.
Heikal, M., Khaddafi, M. and Ummah, A., 2014. Influence analysis of return on assets
(ROA), return on equity (ROE), net profit margin (NPM), debt to equity ratio (DER), and
current ratio (CR), against corporate profit growth in automotive in Indonesia Stock
Exchange. International Journal of Academic Research in Business and Social
Sciences, 4(12), p.101.
Jbhifi.com.au., 2018. JB Hi-Fi | JB Hi-Fi - Australia's Largest Home Entertainment Retailer.
[online] Available at: https://www.jbhifi.com.au/ [Accessed 23 Jul. 2018].
Komala, L.A.P. and Nugroho, P.I., 2013. The Effects of Profitability Ratio, Liquidity, and
Debt towards Investment Return. Journal of Business and Economics, 4(11), pp.1176-1186.
Mathuva, D., 2015. The Influence of working capital management components on corporate
profitability.
Tayeh, M., Al-Jarrah, I.M. and Tarhini, A., 2015. Accounting vs. market-based measures of
firm performance related to information technology investments. International Review of
Social Sciences and Humanities, 9(1), pp.129-145.
Vogel, H.L., 2014. Entertainment industry economics: A guide for financial analysis.
Cambridge University Press.
Paraphrase This Document
Need a fresh take? Get an instant paraphrase of this document with our AI Paraphraser

7ACCOUNTING FOR MANAGERS
Wahlen, J., Baginski, S. and Bradshaw, M., 2014. Financial reporting, financial statement
analysis and valuation. Nelson Education.
Wahlen, J., Baginski, S. and Bradshaw, M., 2014. Financial reporting, financial statement
analysis and valuation. Nelson Education.
1 out of 8
Related Documents

Your All-in-One AI-Powered Toolkit for Academic Success.
+13062052269
info@desklib.com
Available 24*7 on WhatsApp / Email
Unlock your academic potential
© 2024 | Zucol Services PVT LTD | All rights reserved.