Accounting for Managers: Calculation of Ratios, Comparison of Ratios, Accounting Treatment of Transactions
VerifiedAdded on 2023/06/15
|10
|1905
|279
AI Summary
This report analyzes the financial statements of Nimbin Pty Ltd and calculates various ratios to determine the company's profitability and liquidity. It also discusses the effect of various transactions on the financial statements. The report concludes that the day-to-day business transactions will definitely affect company’s financial statements.
Contribute Materials
Your contribution can guide someone’s learning journey. Share your
documents today.
Running Head: ACCOUNTING FOR MANAGERS
accounting concepts
accounting concepts
Secure Best Marks with AI Grader
Need help grading? Try our AI Grader for instant feedback on your assignments.

Accounting for Managers 1
Contents
Introduction................................................................................................................................2
Calculation of Ratios..................................................................................................................2
Comparison of Ratios.................................................................................................................5
Accounting treatment of transactions.........................................................................................6
Conclusion..................................................................................................................................7
References..................................................................................................................................8
Accounting for Managers 2
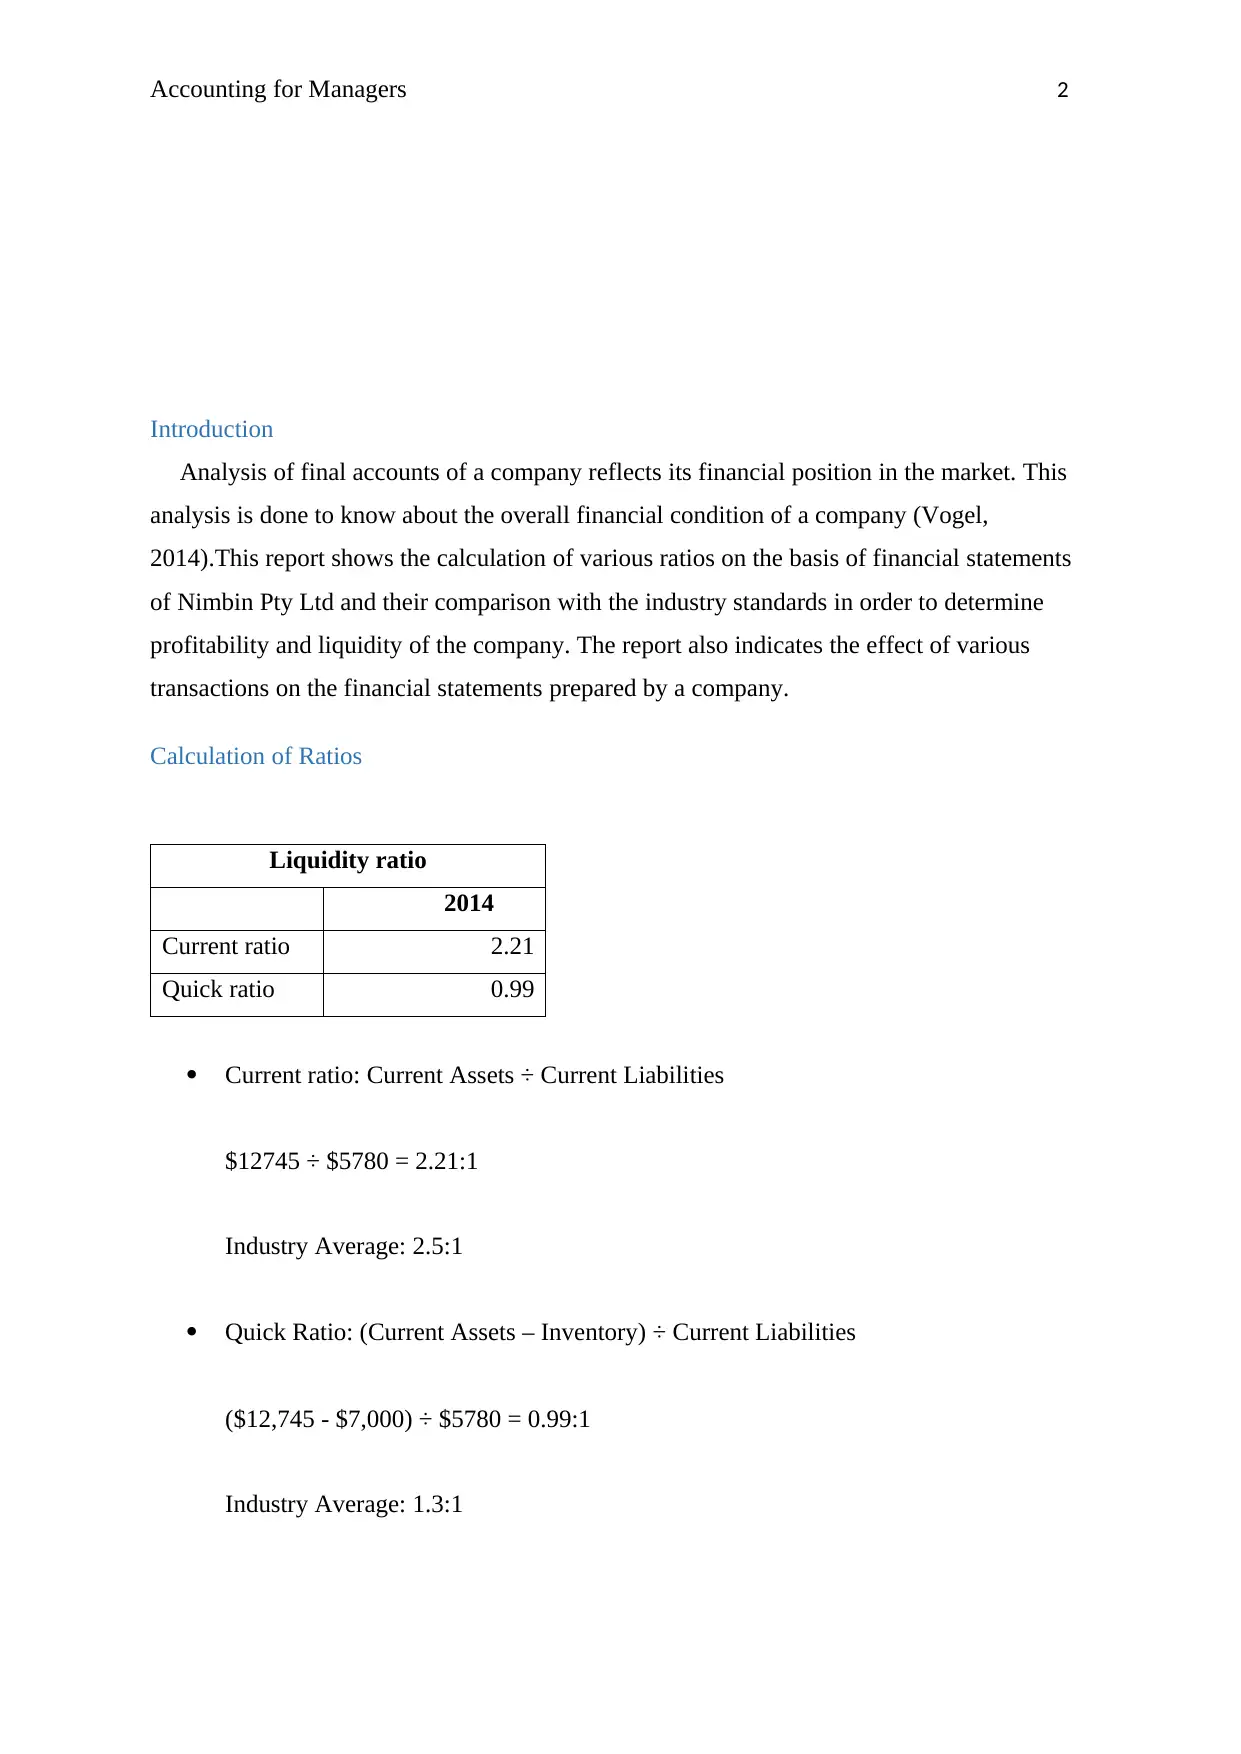
Introduction
Analysis of final accounts of a company reflects its financial position in the market. This
analysis is done to know about the overall financial condition of a company (Vogel,
2014).This report shows the calculation of various ratios on the basis of financial statements
of Nimbin Pty Ltd and their comparison with the industry standards in order to determine
profitability and liquidity of the company. The report also indicates the effect of various
transactions on the financial statements prepared by a company.
Calculation of Ratios
Liquidity ratio
2014
Current ratio 2.21
Quick ratio 0.99
Current ratio: Current Assets ÷ Current Liabilities
$12745 ÷ $5780 = 2.21:1
Industry Average: 2.5:1
Quick Ratio: (Current Assets – Inventory) ÷ Current Liabilities
($12,745 - $7,000) ÷ $5780 = 0.99:1
Industry Average: 1.3:1
Accounting for Managers 3
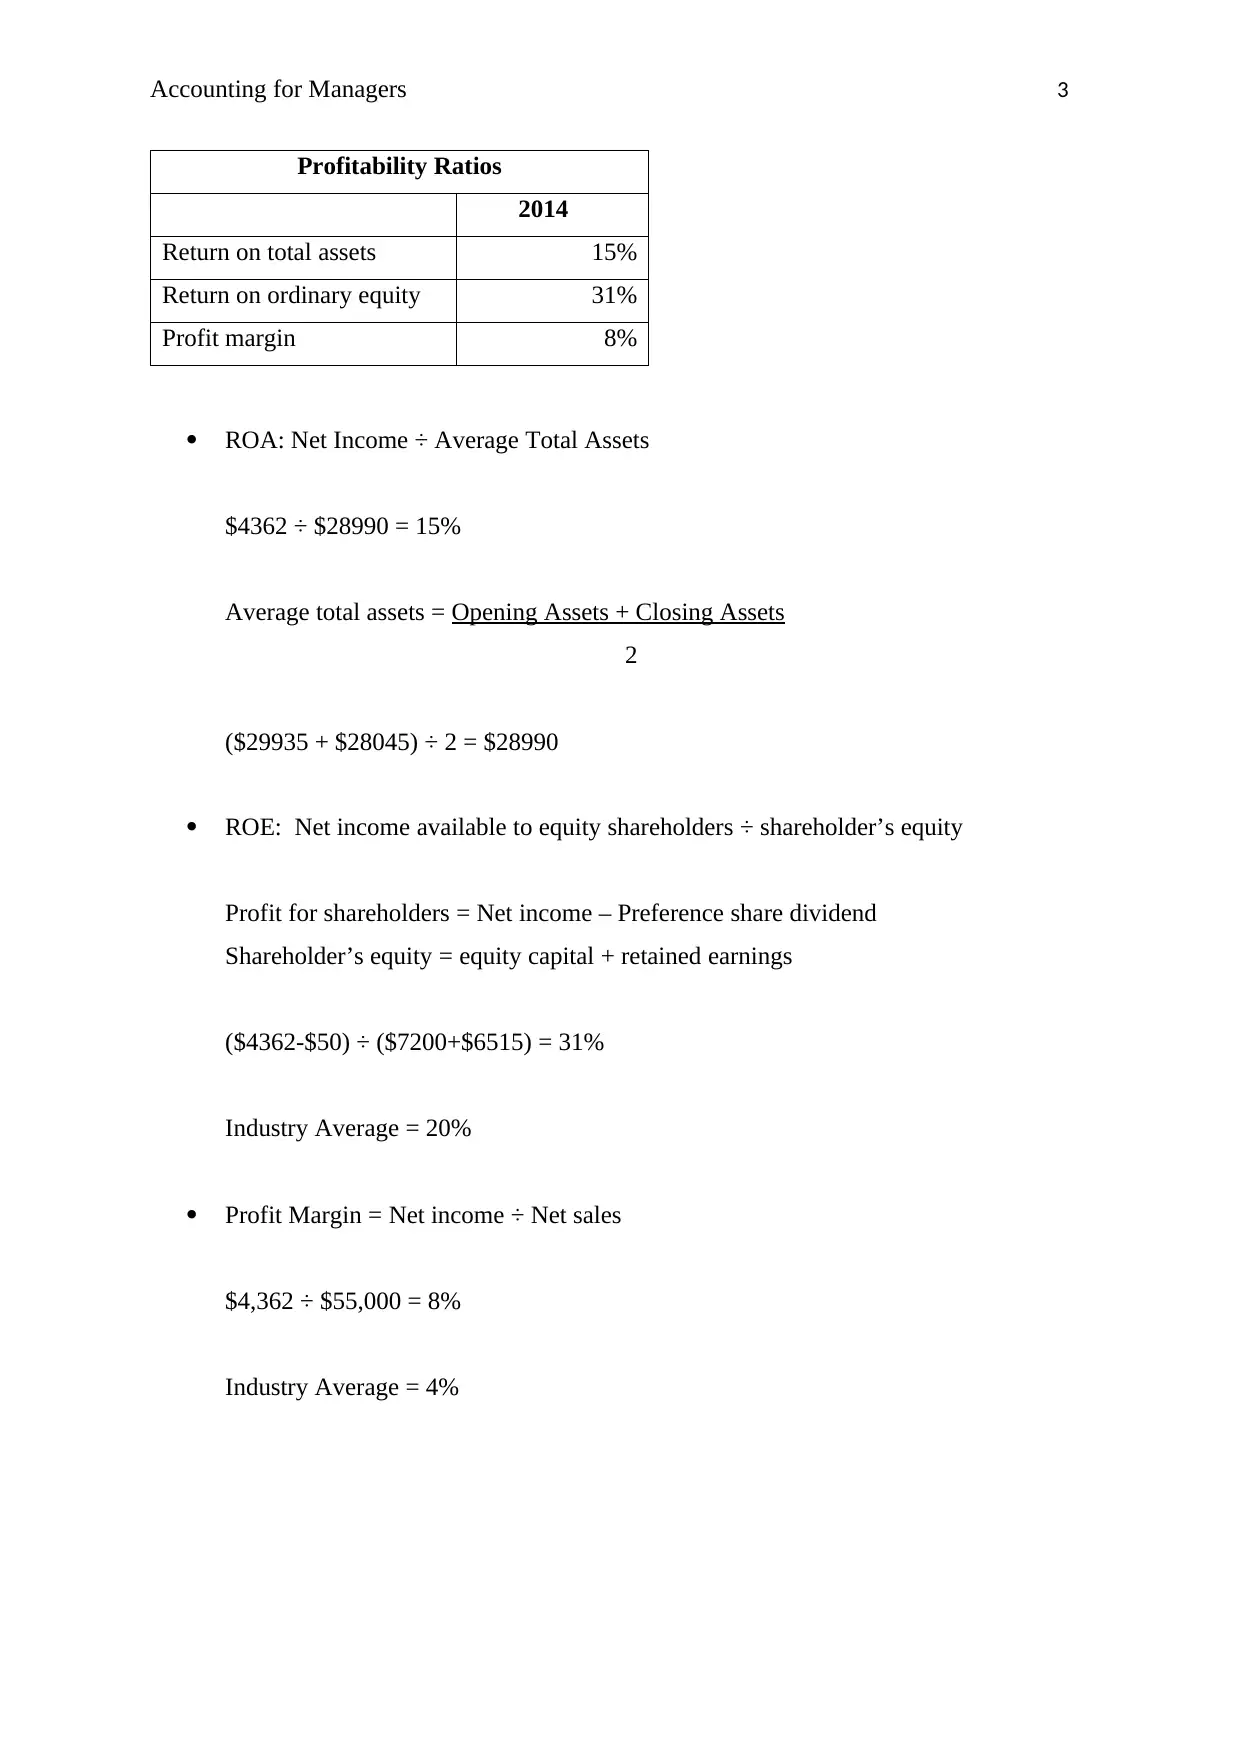
Profitability Ratios
2014
Return on total assets 15%
Return on ordinary equity 31%
Profit margin 8%
ROA: Net Income ÷ Average Total Assets
$4362 ÷ $28990 = 15%
Average total assets = Opening Assets + Closing Assets
2
($29935 + $28045) ÷ 2 = $28990
ROE: Net income available to equity shareholders ÷ shareholder’s equity
Profit for shareholders = Net income – Preference share dividend
Shareholder’s equity = equity capital + retained earnings
($4362-$50) ÷ ($7200+$6515) = 31%
Industry Average = 20%
Profit Margin = Net income ÷ Net sales
$4,362 ÷ $55,000 = 8%
Industry Average = 4%
Secure Best Marks with AI Grader
Need help grading? Try our AI Grader for instant feedback on your assignments.
Accounting for Managers 4
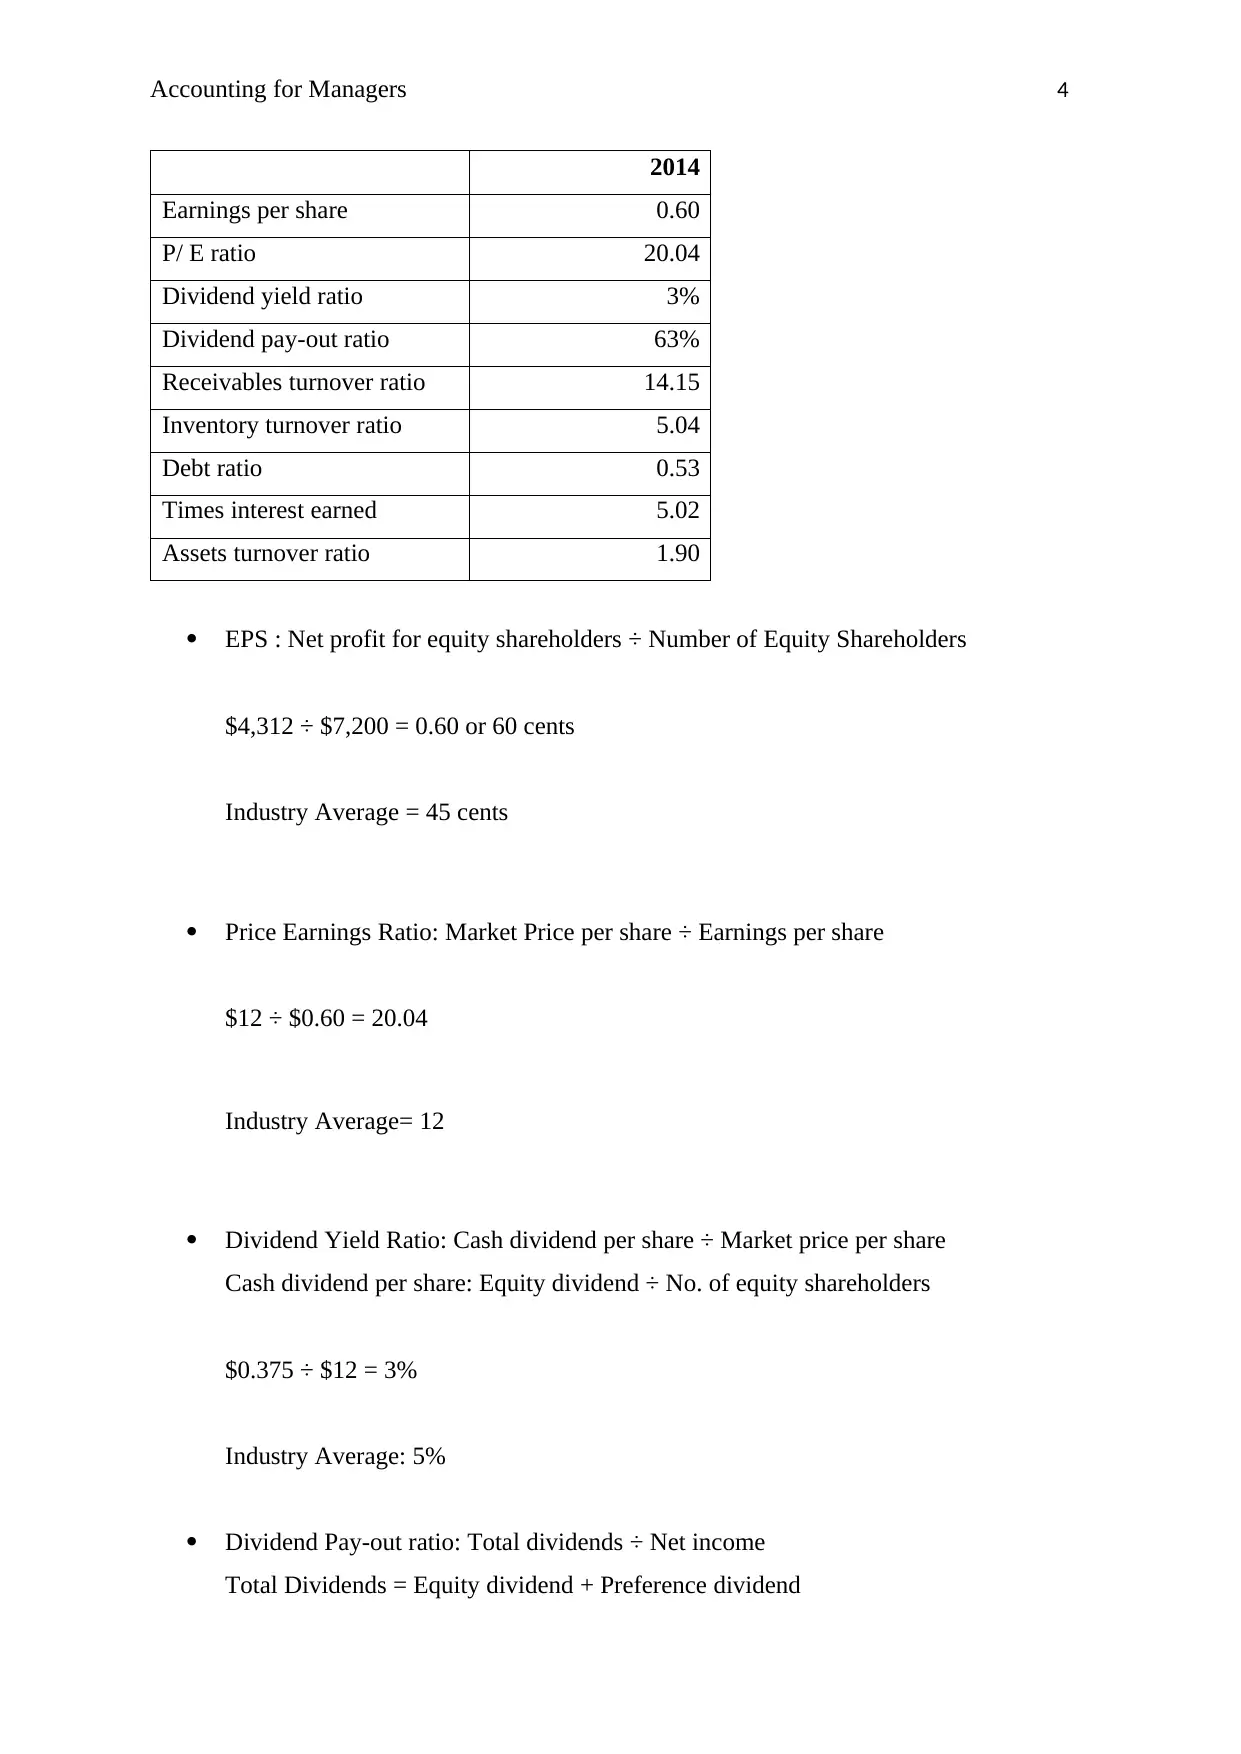
2014
Earnings per share 0.60
P/ E ratio 20.04
Dividend yield ratio 3%
Dividend pay-out ratio 63%
Receivables turnover ratio 14.15
Inventory turnover ratio 5.04
Debt ratio 0.53
Times interest earned 5.02
Assets turnover ratio 1.90
EPS : Net profit for equity shareholders ÷ Number of Equity Shareholders
$4,312 ÷ $7,200 = 0.60 or 60 cents
Industry Average = 45 cents
Price Earnings Ratio: Market Price per share ÷ Earnings per share
$12 ÷ $0.60 = 20.04
Industry Average= 12
Dividend Yield Ratio: Cash dividend per share ÷ Market price per share
Cash dividend per share: Equity dividend ÷ No. of equity shareholders
$0.375 ÷ $12 = 3%
Industry Average: 5%
Dividend Pay-out ratio: Total dividends ÷ Net income
Total Dividends = Equity dividend + Preference dividend
Accounting for Managers 5
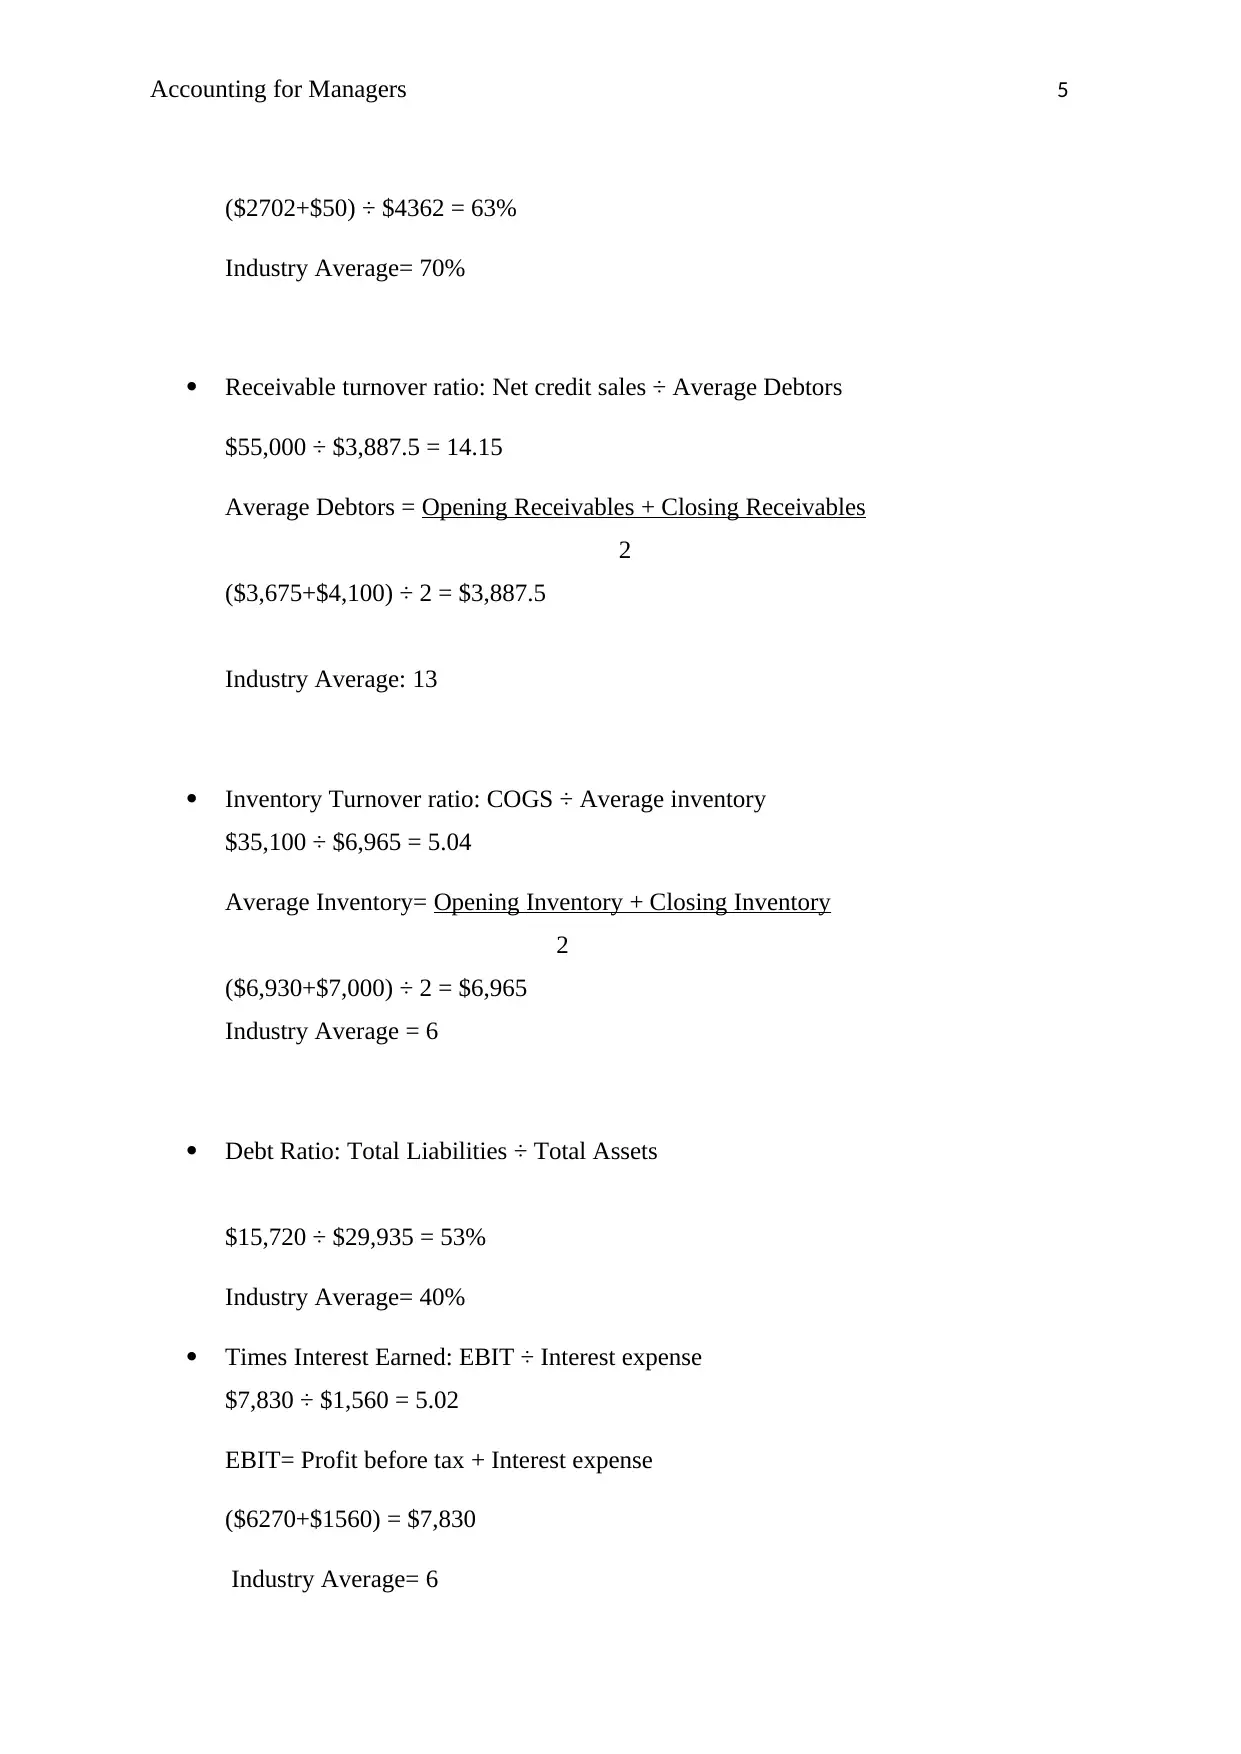
($2702+$50) ÷ $4362 = 63%
Industry Average= 70%
Receivable turnover ratio: Net credit sales ÷ Average Debtors
$55,000 ÷ $3,887.5 = 14.15
Average Debtors = Opening Receivables + Closing Receivables
2
($3,675+$4,100) ÷ 2 = $3,887.5
Industry Average: 13
Inventory Turnover ratio: COGS ÷ Average inventory
$35,100 ÷ $6,965 = 5.04
Average Inventory= Opening Inventory + Closing Inventory
2
($6,930+$7,000) ÷ 2 = $6,965
Industry Average = 6
Debt Ratio: Total Liabilities ÷ Total Assets
$15,720 ÷ $29,935 = 53%
Industry Average= 40%
Times Interest Earned: EBIT ÷ Interest expense
$7,830 ÷ $1,560 = 5.02
EBIT= Profit before tax + Interest expense
($6270+$1560) = $7,830
Industry Average= 6
Accounting for Managers 6
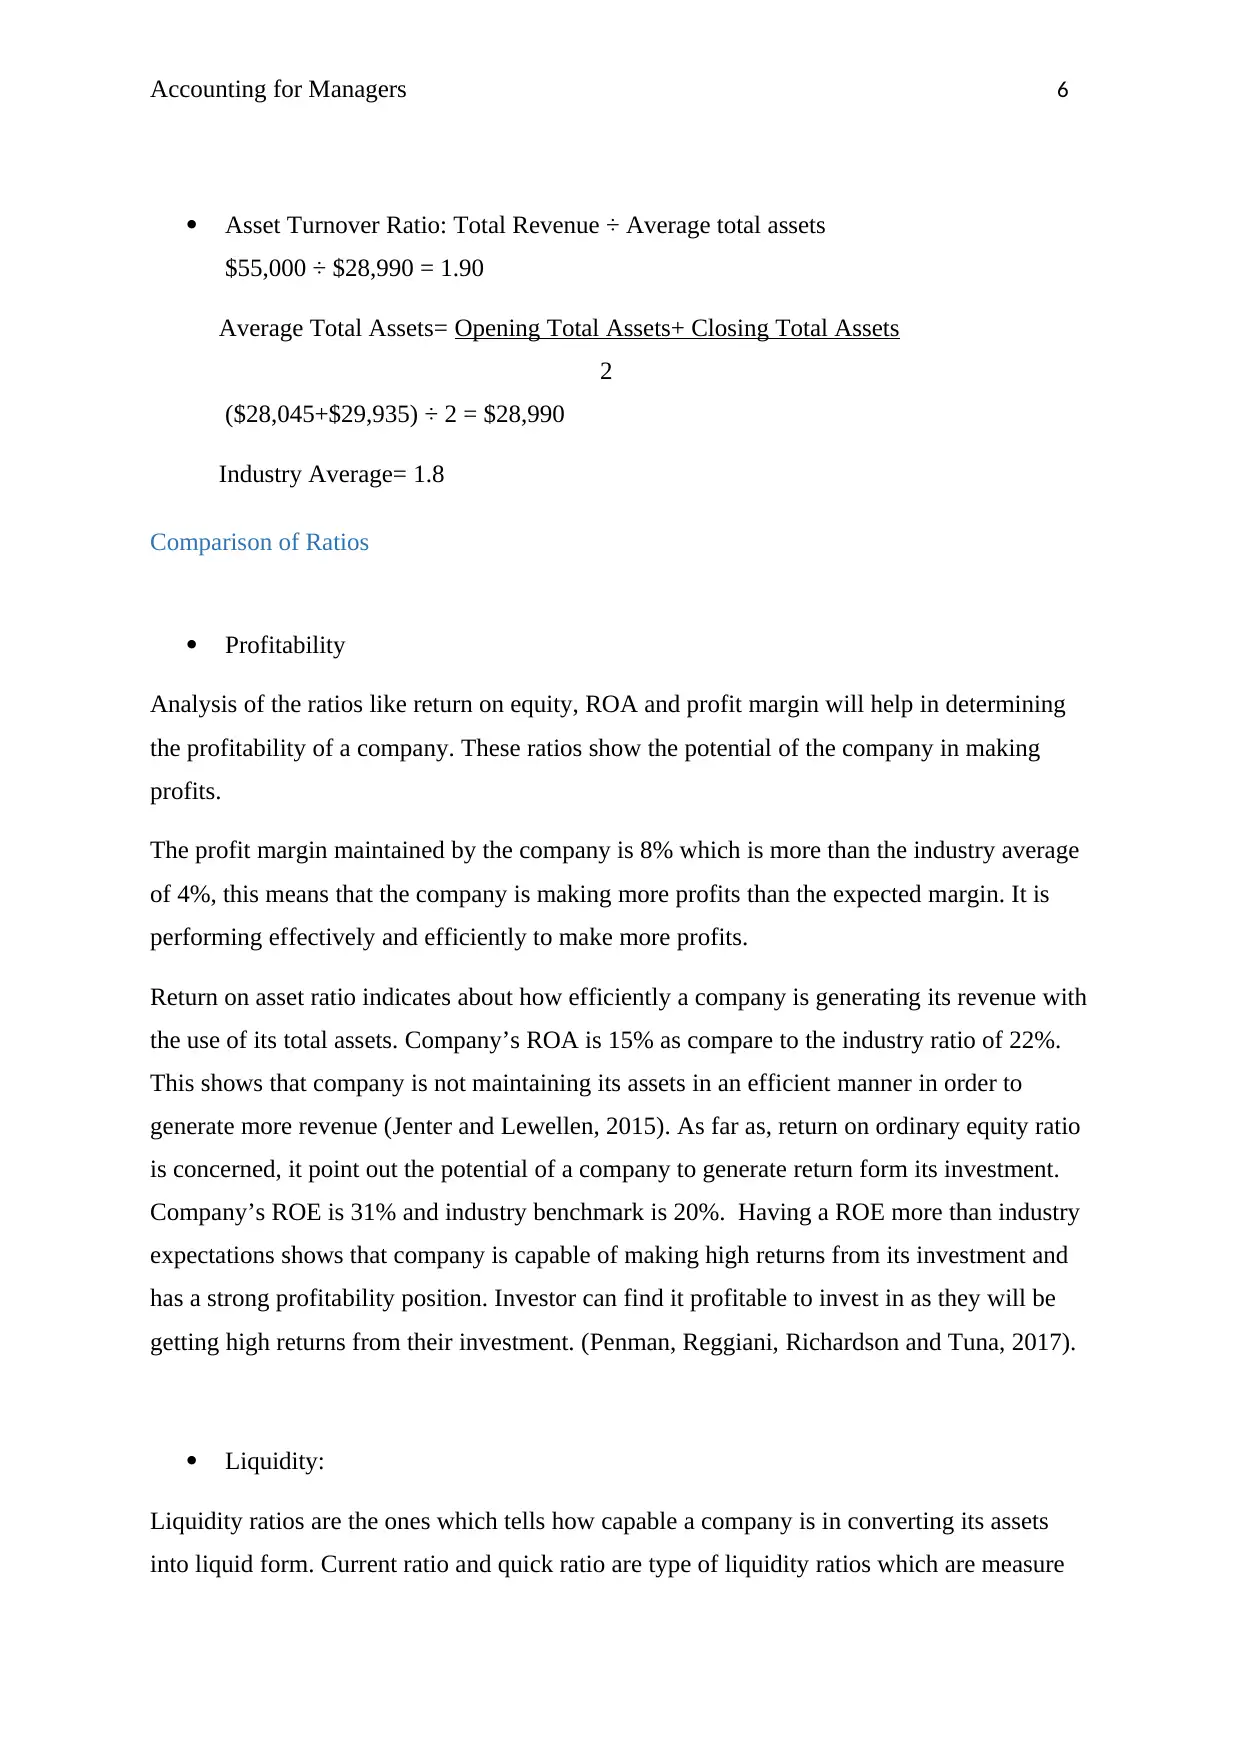
Asset Turnover Ratio: Total Revenue ÷ Average total assets
$55,000 ÷ $28,990 = 1.90
Average Total Assets= Opening Total Assets+ Closing Total Assets
2
($28,045+$29,935) ÷ 2 = $28,990
Industry Average= 1.8
Comparison of Ratios
Profitability
Analysis of the ratios like return on equity, ROA and profit margin will help in determining
the profitability of a company. These ratios show the potential of the company in making
profits.
The profit margin maintained by the company is 8% which is more than the industry average
of 4%, this means that the company is making more profits than the expected margin. It is
performing effectively and efficiently to make more profits.
Return on asset ratio indicates about how efficiently a company is generating its revenue with
the use of its total assets. Company’s ROA is 15% as compare to the industry ratio of 22%.
This shows that company is not maintaining its assets in an efficient manner in order to
generate more revenue (Jenter and Lewellen, 2015). As far as, return on ordinary equity ratio
is concerned, it point out the potential of a company to generate return form its investment.
Company’s ROE is 31% and industry benchmark is 20%. Having a ROE more than industry
expectations shows that company is capable of making high returns from its investment and
has a strong profitability position. Investor can find it profitable to invest in as they will be
getting high returns from their investment. (Penman, Reggiani, Richardson and Tuna, 2017).
Liquidity:
Liquidity ratios are the ones which tells how capable a company is in converting its assets
into liquid form. Current ratio and quick ratio are type of liquidity ratios which are measure
Paraphrase This Document
Need a fresh take? Get an instant paraphrase of this document with our AI Paraphraser
Accounting for Managers 7
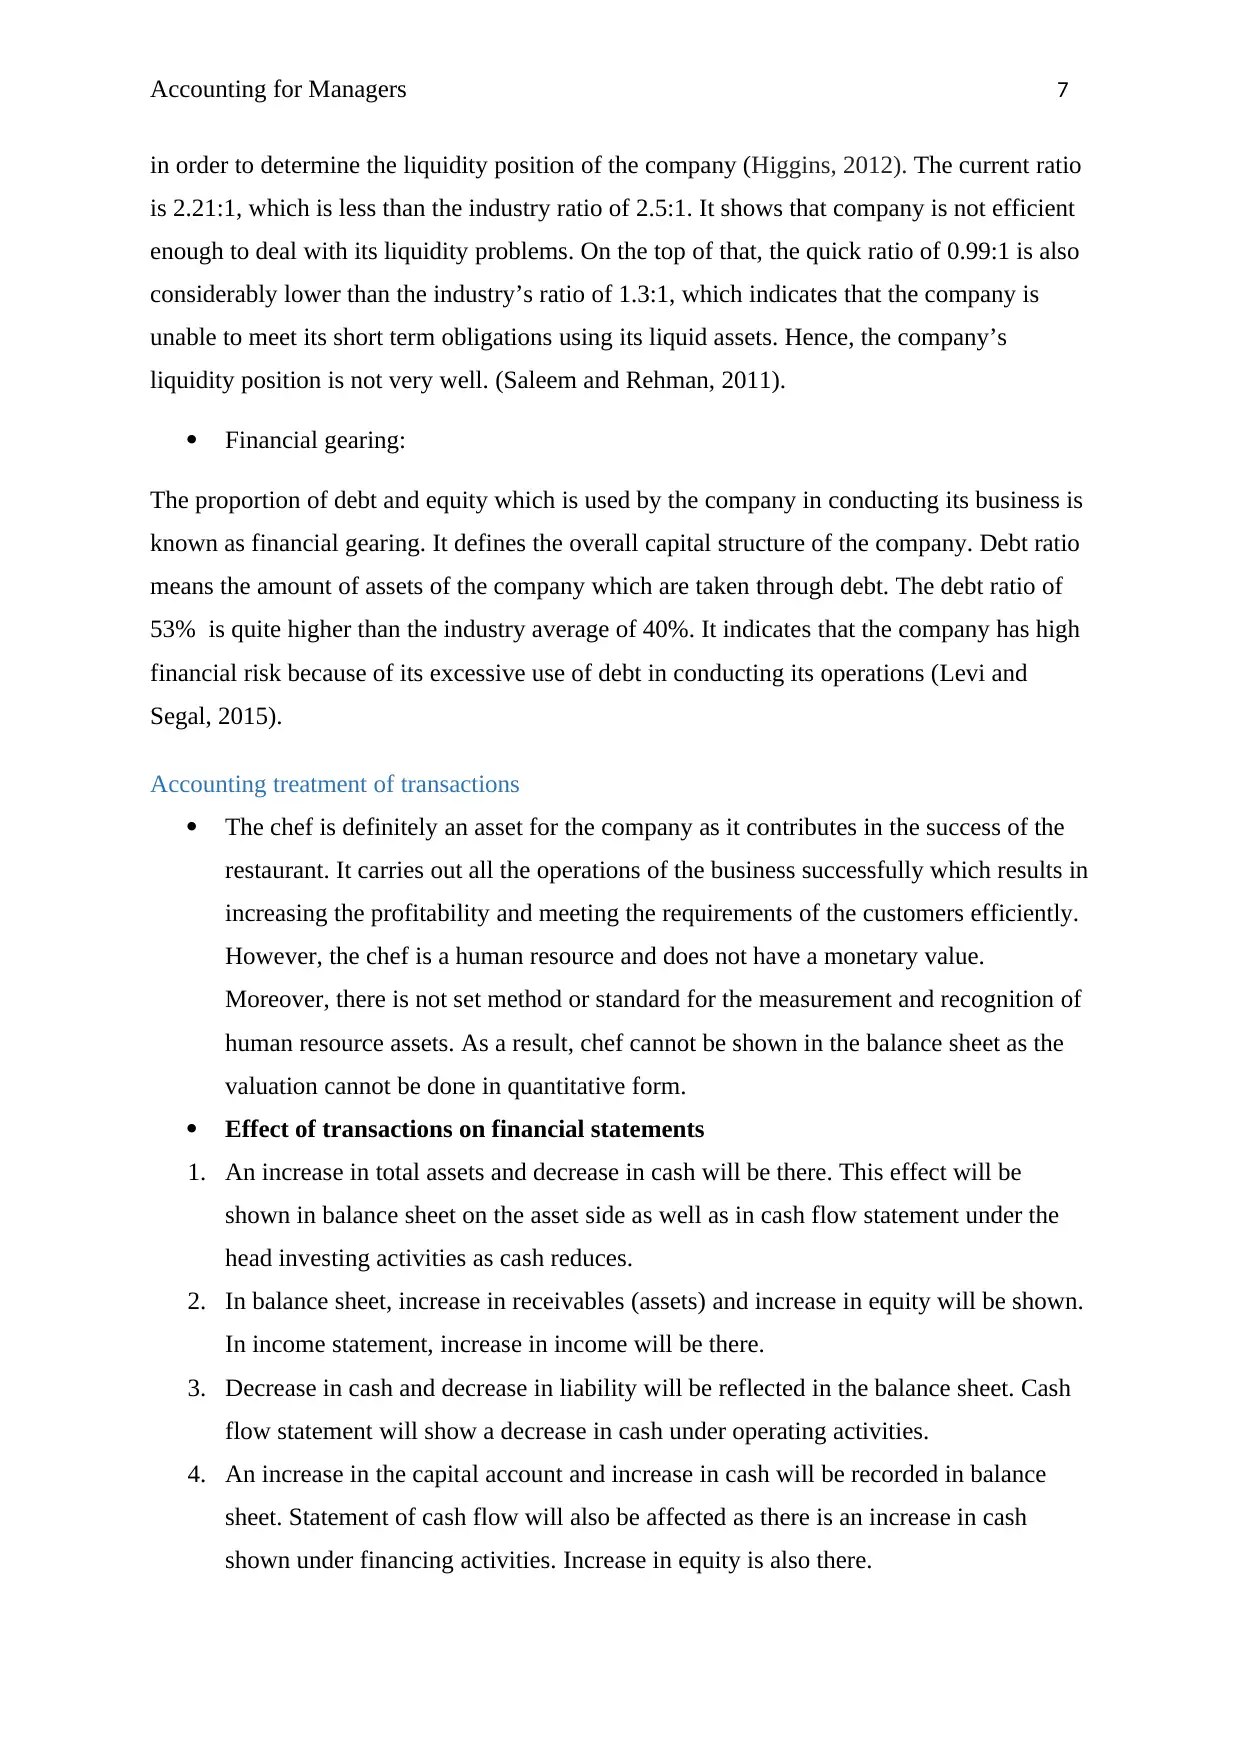
in order to determine the liquidity position of the company (Higgins, 2012). The current ratio
is 2.21:1, which is less than the industry ratio of 2.5:1. It shows that company is not efficient
enough to deal with its liquidity problems. On the top of that, the quick ratio of 0.99:1 is also
considerably lower than the industry’s ratio of 1.3:1, which indicates that the company is
unable to meet its short term obligations using its liquid assets. Hence, the company’s
liquidity position is not very well. (Saleem and Rehman, 2011).
Financial gearing:
The proportion of debt and equity which is used by the company in conducting its business is
known as financial gearing. It defines the overall capital structure of the company. Debt ratio
means the amount of assets of the company which are taken through debt. The debt ratio of
53% is quite higher than the industry average of 40%. It indicates that the company has high
financial risk because of its excessive use of debt in conducting its operations (Levi and
Segal, 2015).
Accounting treatment of transactions
The chef is definitely an asset for the company as it contributes in the success of the
restaurant. It carries out all the operations of the business successfully which results in
increasing the profitability and meeting the requirements of the customers efficiently.
However, the chef is a human resource and does not have a monetary value.
Moreover, there is not set method or standard for the measurement and recognition of
human resource assets. As a result, chef cannot be shown in the balance sheet as the
valuation cannot be done in quantitative form.
Effect of transactions on financial statements
1. An increase in total assets and decrease in cash will be there. This effect will be
shown in balance sheet on the asset side as well as in cash flow statement under the
head investing activities as cash reduces.
2. In balance sheet, increase in receivables (assets) and increase in equity will be shown.
In income statement, increase in income will be there.
3. Decrease in cash and decrease in liability will be reflected in the balance sheet. Cash
flow statement will show a decrease in cash under operating activities.
4. An increase in the capital account and increase in cash will be recorded in balance
sheet. Statement of cash flow will also be affected as there is an increase in cash
shown under financing activities. Increase in equity is also there.
Accounting for Managers 8
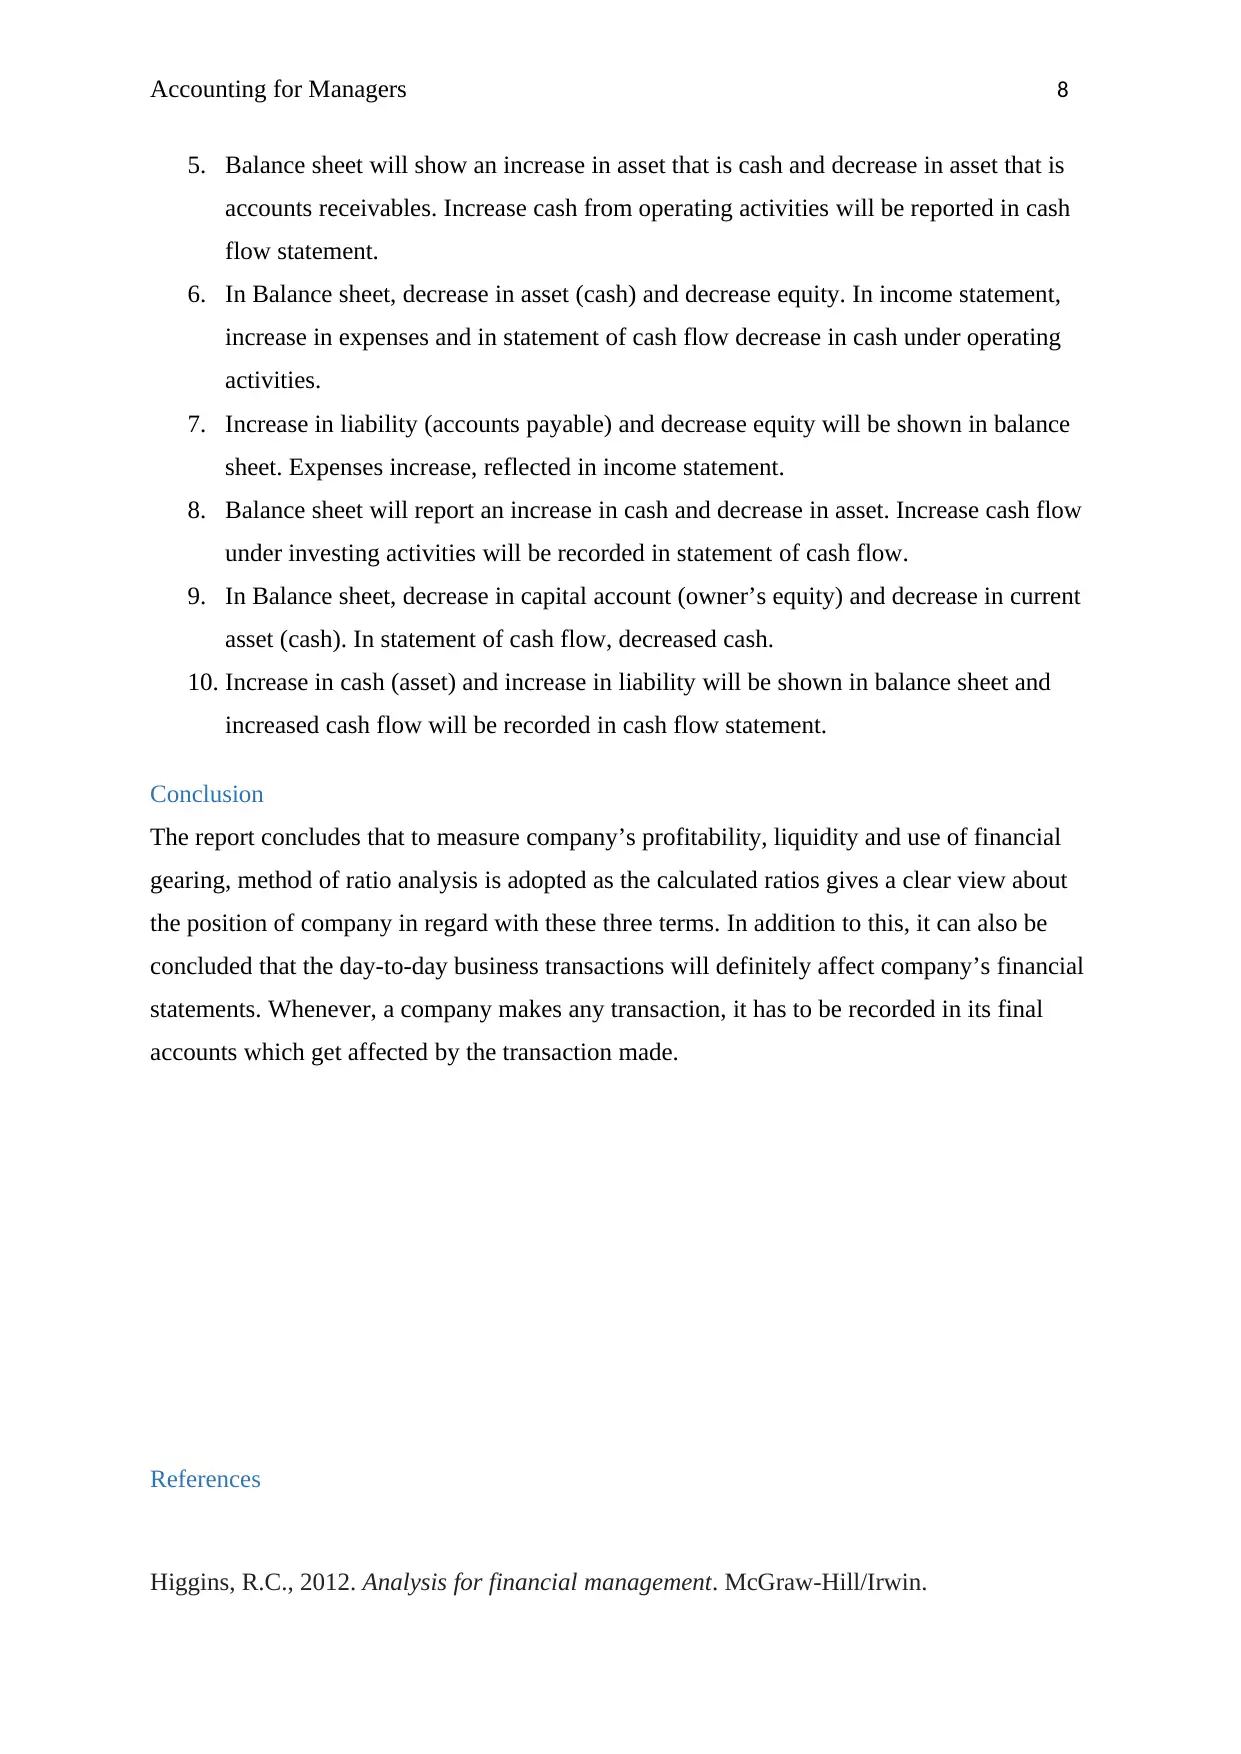
5. Balance sheet will show an increase in asset that is cash and decrease in asset that is
accounts receivables. Increase cash from operating activities will be reported in cash
flow statement.
6. In Balance sheet, decrease in asset (cash) and decrease equity. In income statement,
increase in expenses and in statement of cash flow decrease in cash under operating
activities.
7. Increase in liability (accounts payable) and decrease equity will be shown in balance
sheet. Expenses increase, reflected in income statement.
8. Balance sheet will report an increase in cash and decrease in asset. Increase cash flow
under investing activities will be recorded in statement of cash flow.
9. In Balance sheet, decrease in capital account (owner’s equity) and decrease in current
asset (cash). In statement of cash flow, decreased cash.
10. Increase in cash (asset) and increase in liability will be shown in balance sheet and
increased cash flow will be recorded in cash flow statement.
Conclusion
The report concludes that to measure company’s profitability, liquidity and use of financial
gearing, method of ratio analysis is adopted as the calculated ratios gives a clear view about
the position of company in regard with these three terms. In addition to this, it can also be
concluded that the day-to-day business transactions will definitely affect company’s financial
statements. Whenever, a company makes any transaction, it has to be recorded in its final
accounts which get affected by the transaction made.
References
Higgins, R.C., 2012. Analysis for financial management. McGraw-Hill/Irwin.
Accounting for Managers 9
Jenter, D. and Lewellen, K., 2015. CEO preferences and acquisitions. The Journal of
Finance, 70(6), pp.2813-2852.
Levi, S. and Segal, B., 2015. The Impact of Debt-Equity Reporting Classifications on the
Firm's Decision to Issue Hybrid Securities. European Accounting Review, 24(4), pp.801-822.
Penman, S.H., Reggiani, F., Richardson, S.A. and Tuna, A., 2017. A Framework for
Identifying Accounting Characteristics for Asset Pricing Models, with an Evaluation of
Book-To-Price.
Saleem, Q. and Rehman, R.U., 2011. Impacts of liquidity ratios on
profitability. Interdisciplinary Journal of Research in Business, 1(7), pp.95-98.
Vogel, H.L., 2014. Entertainment industry economics: A guide for financial analysis.
Cambridge University Press.
1 out of 10
Related Documents


Your All-in-One AI-Powered Toolkit for Academic Success.
+13062052269
info@desklib.com
Available 24*7 on WhatsApp / Email
![[object Object]](/_next/static/media/star-bottom.7253800d.svg)
Unlock your academic potential
© 2024 | Zucol Services PVT LTD | All rights reserved.