Accounting Analysis: Cash Converters International Limited (2013-2017)
VerifiedAdded on 2020/10/05
|8
|1486
|343
Report
AI Summary
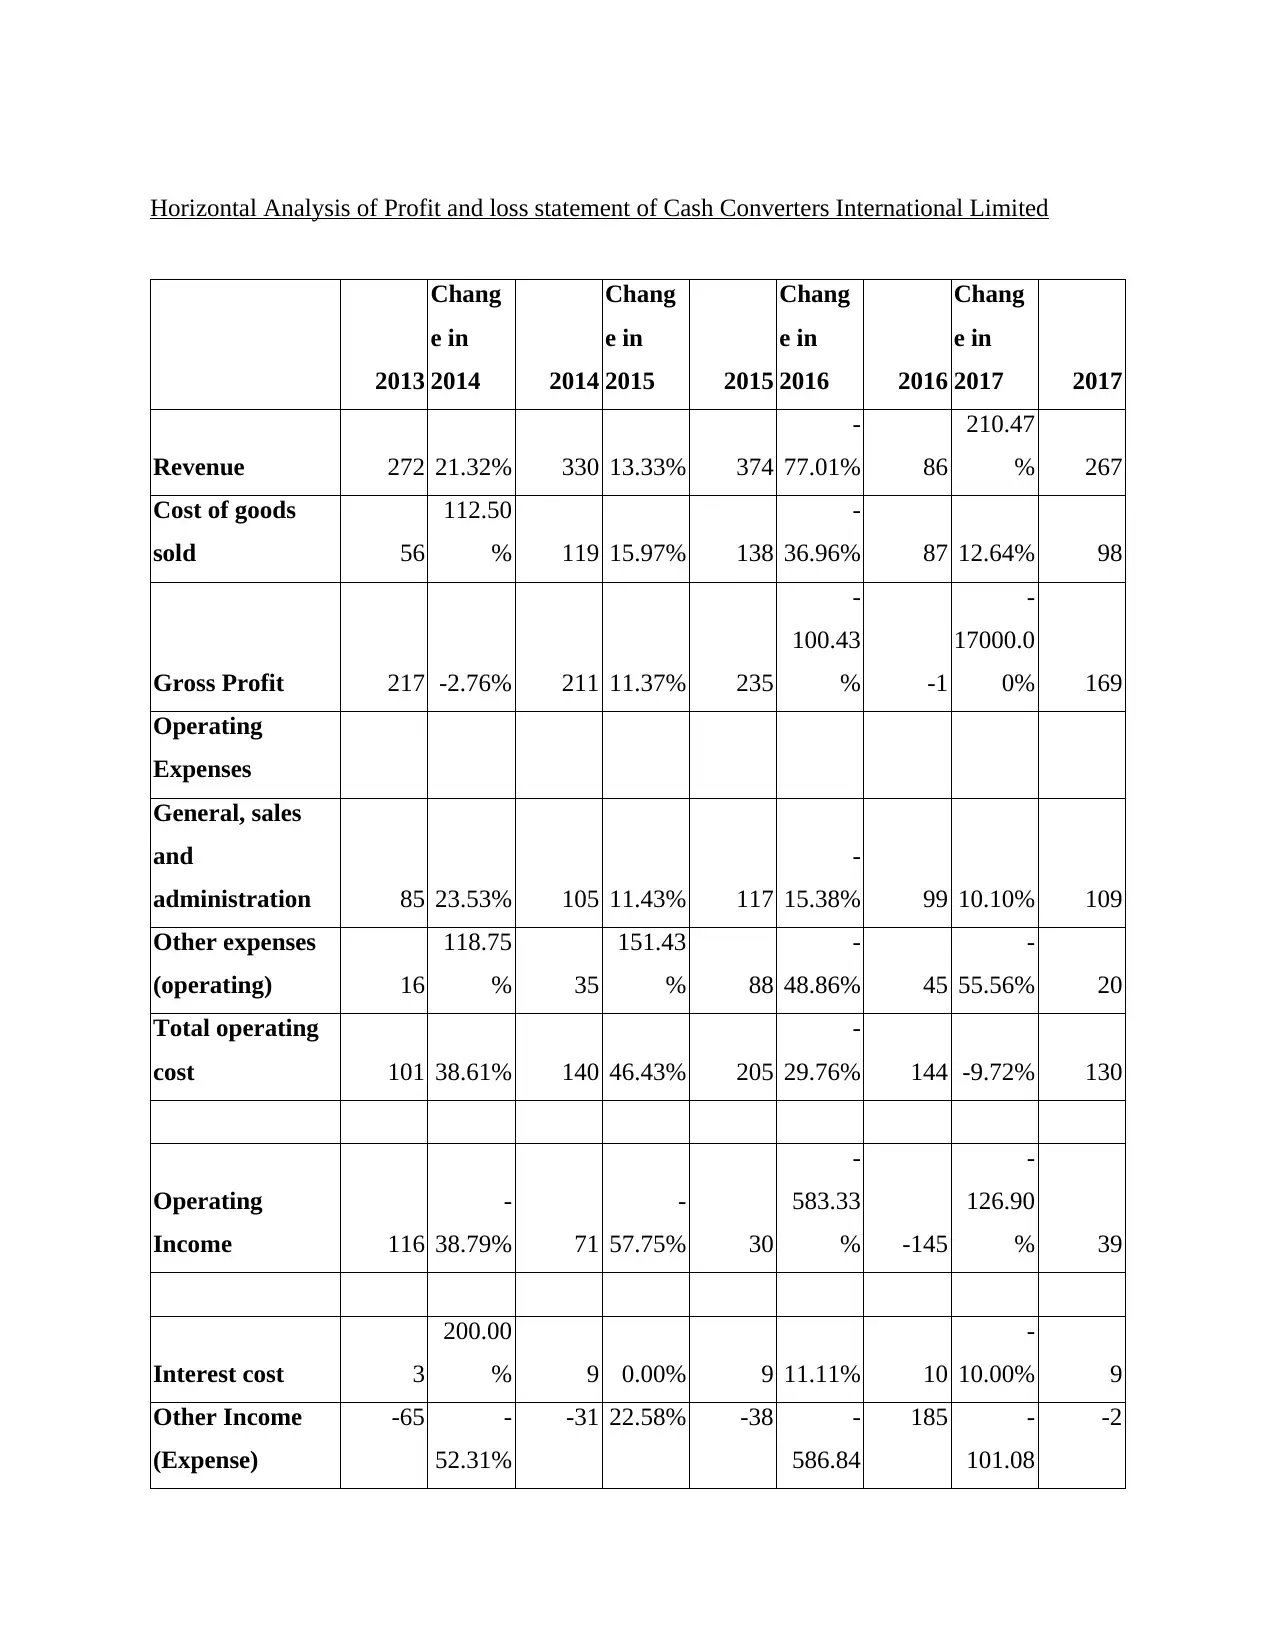
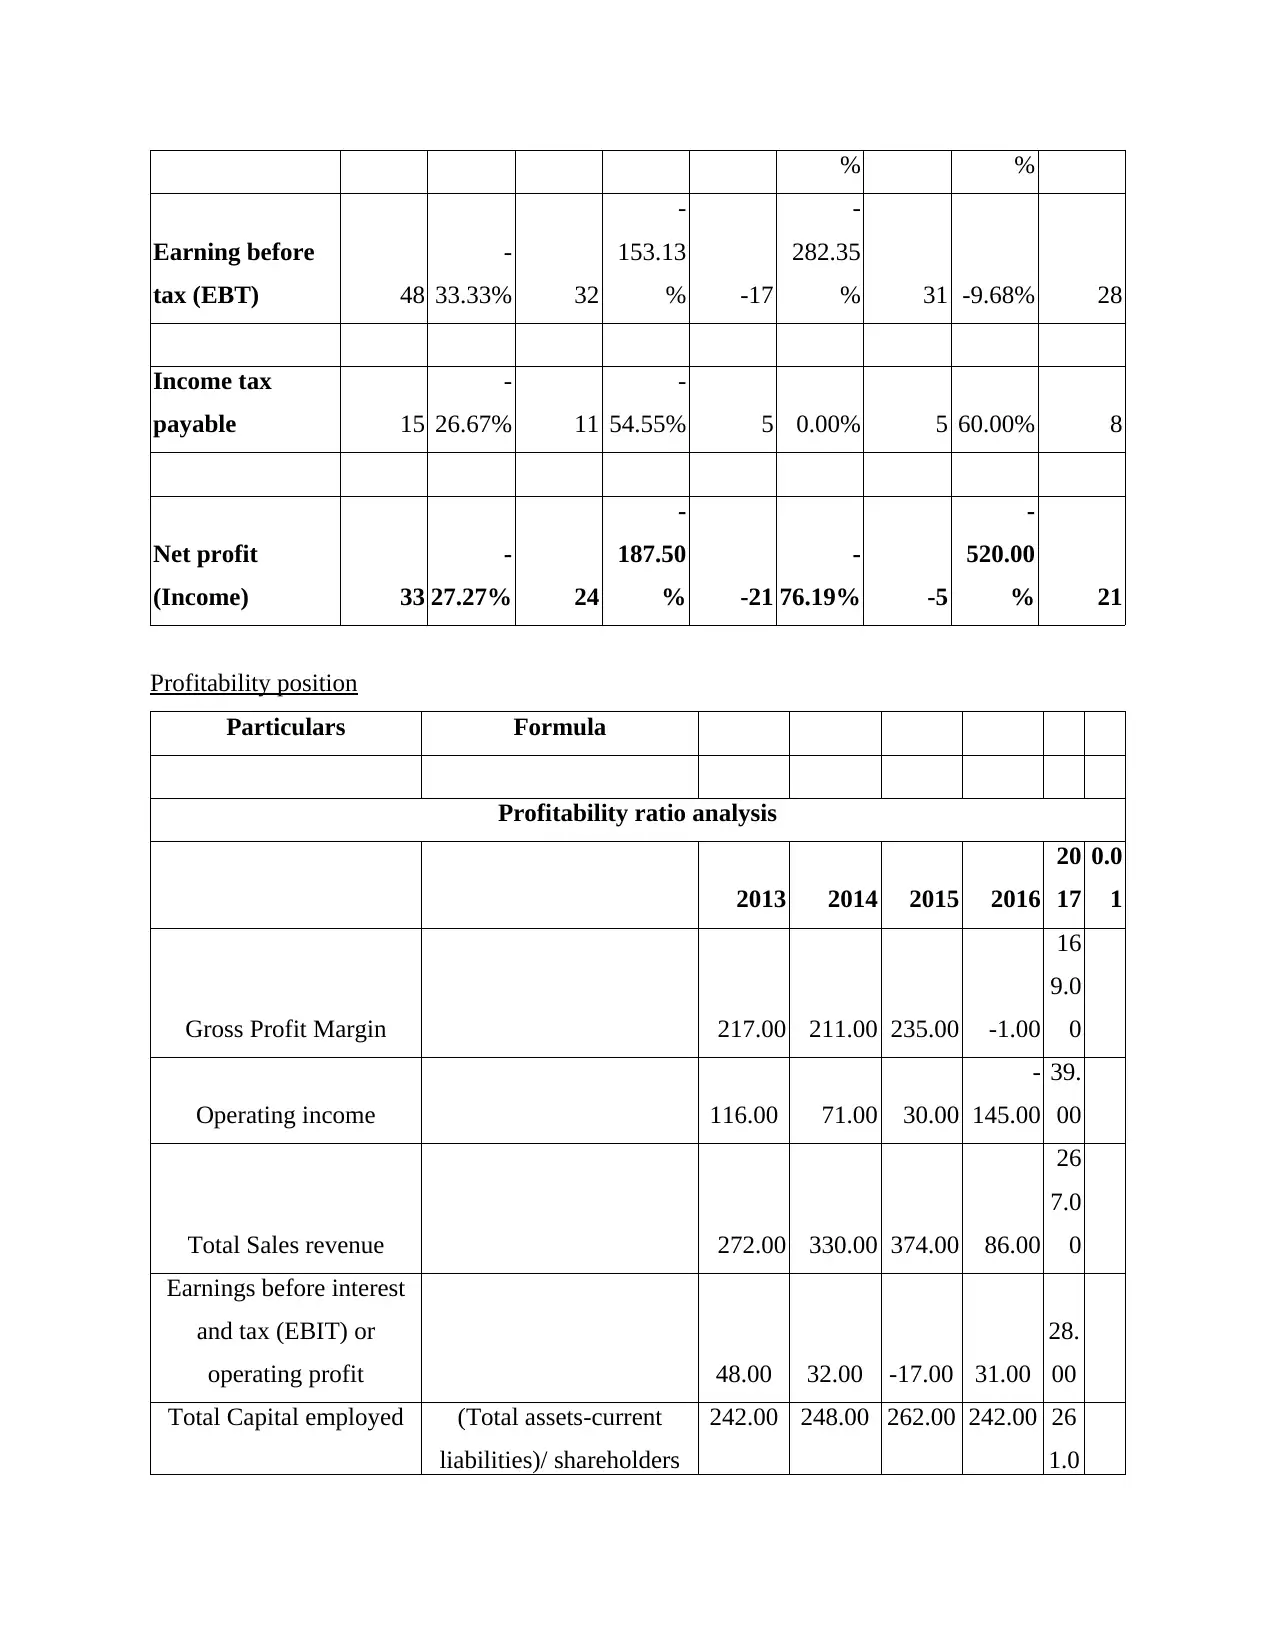
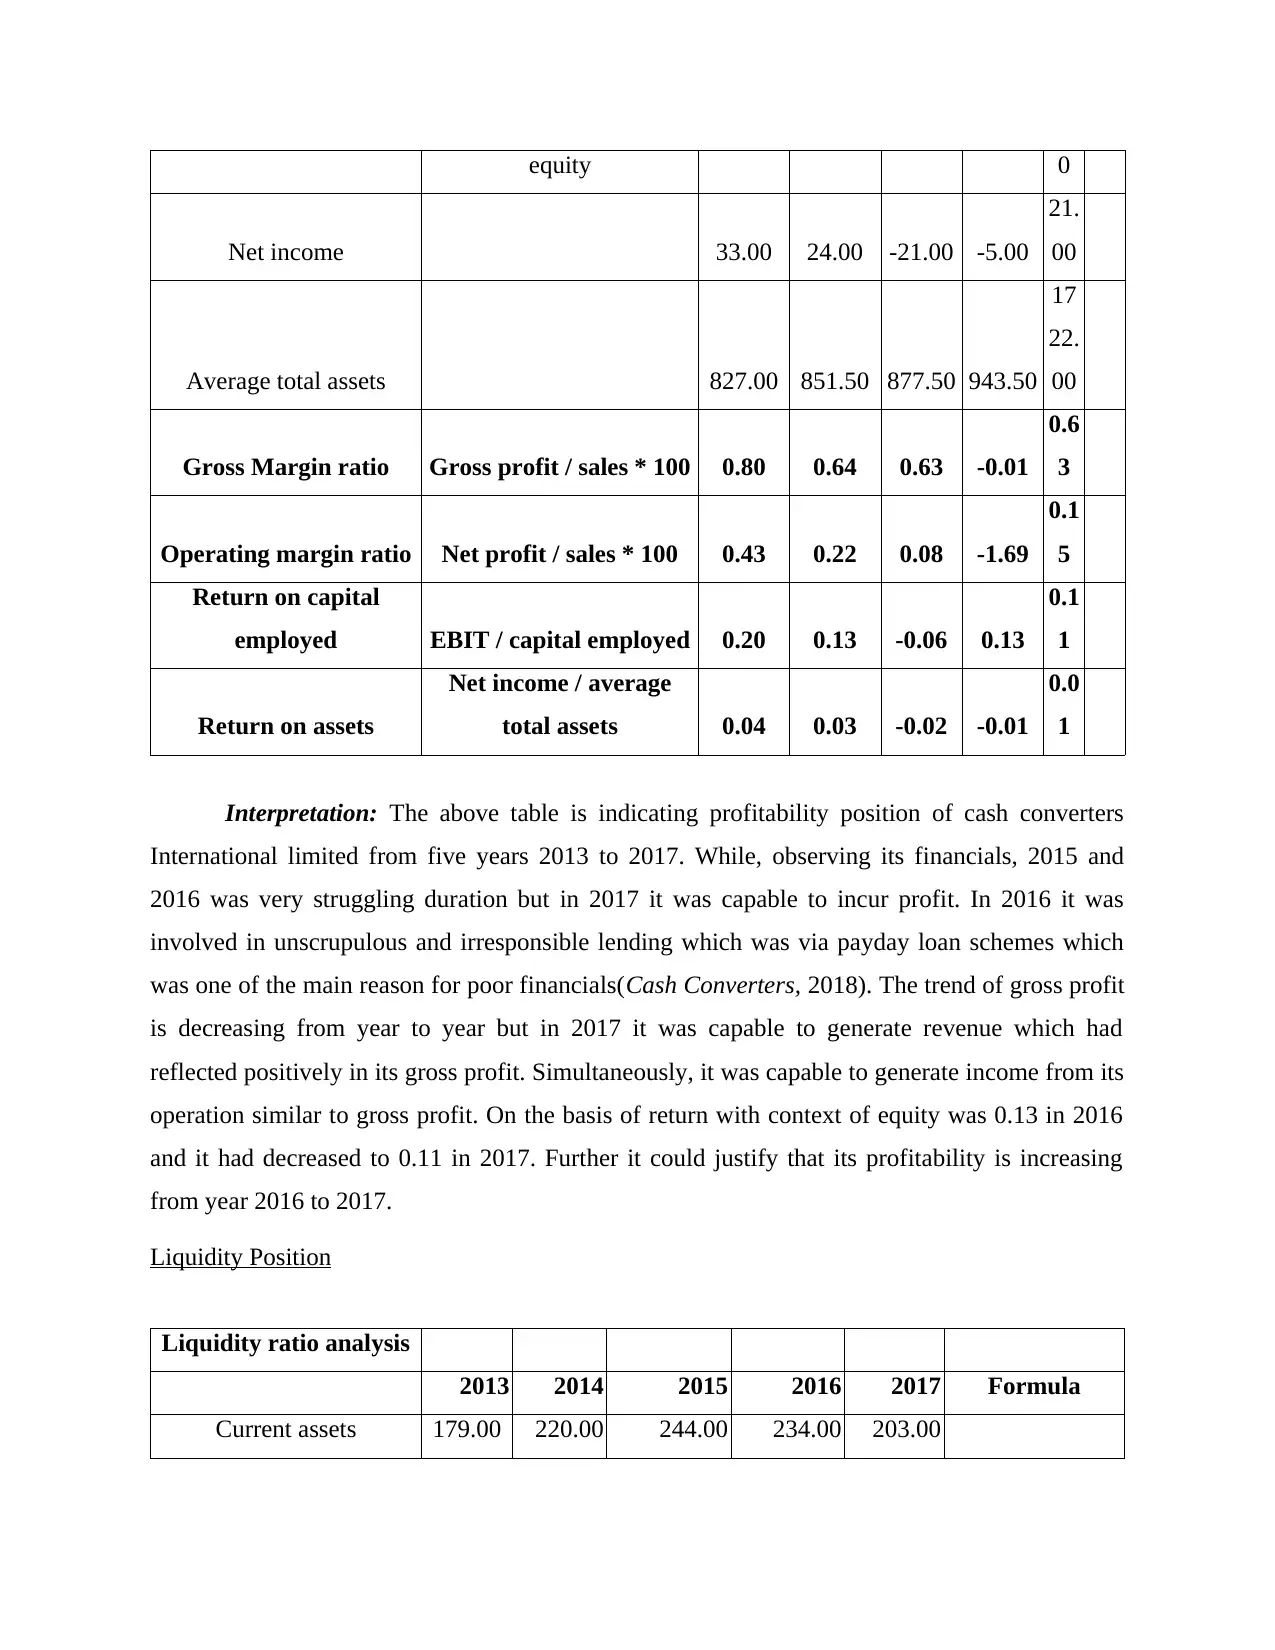
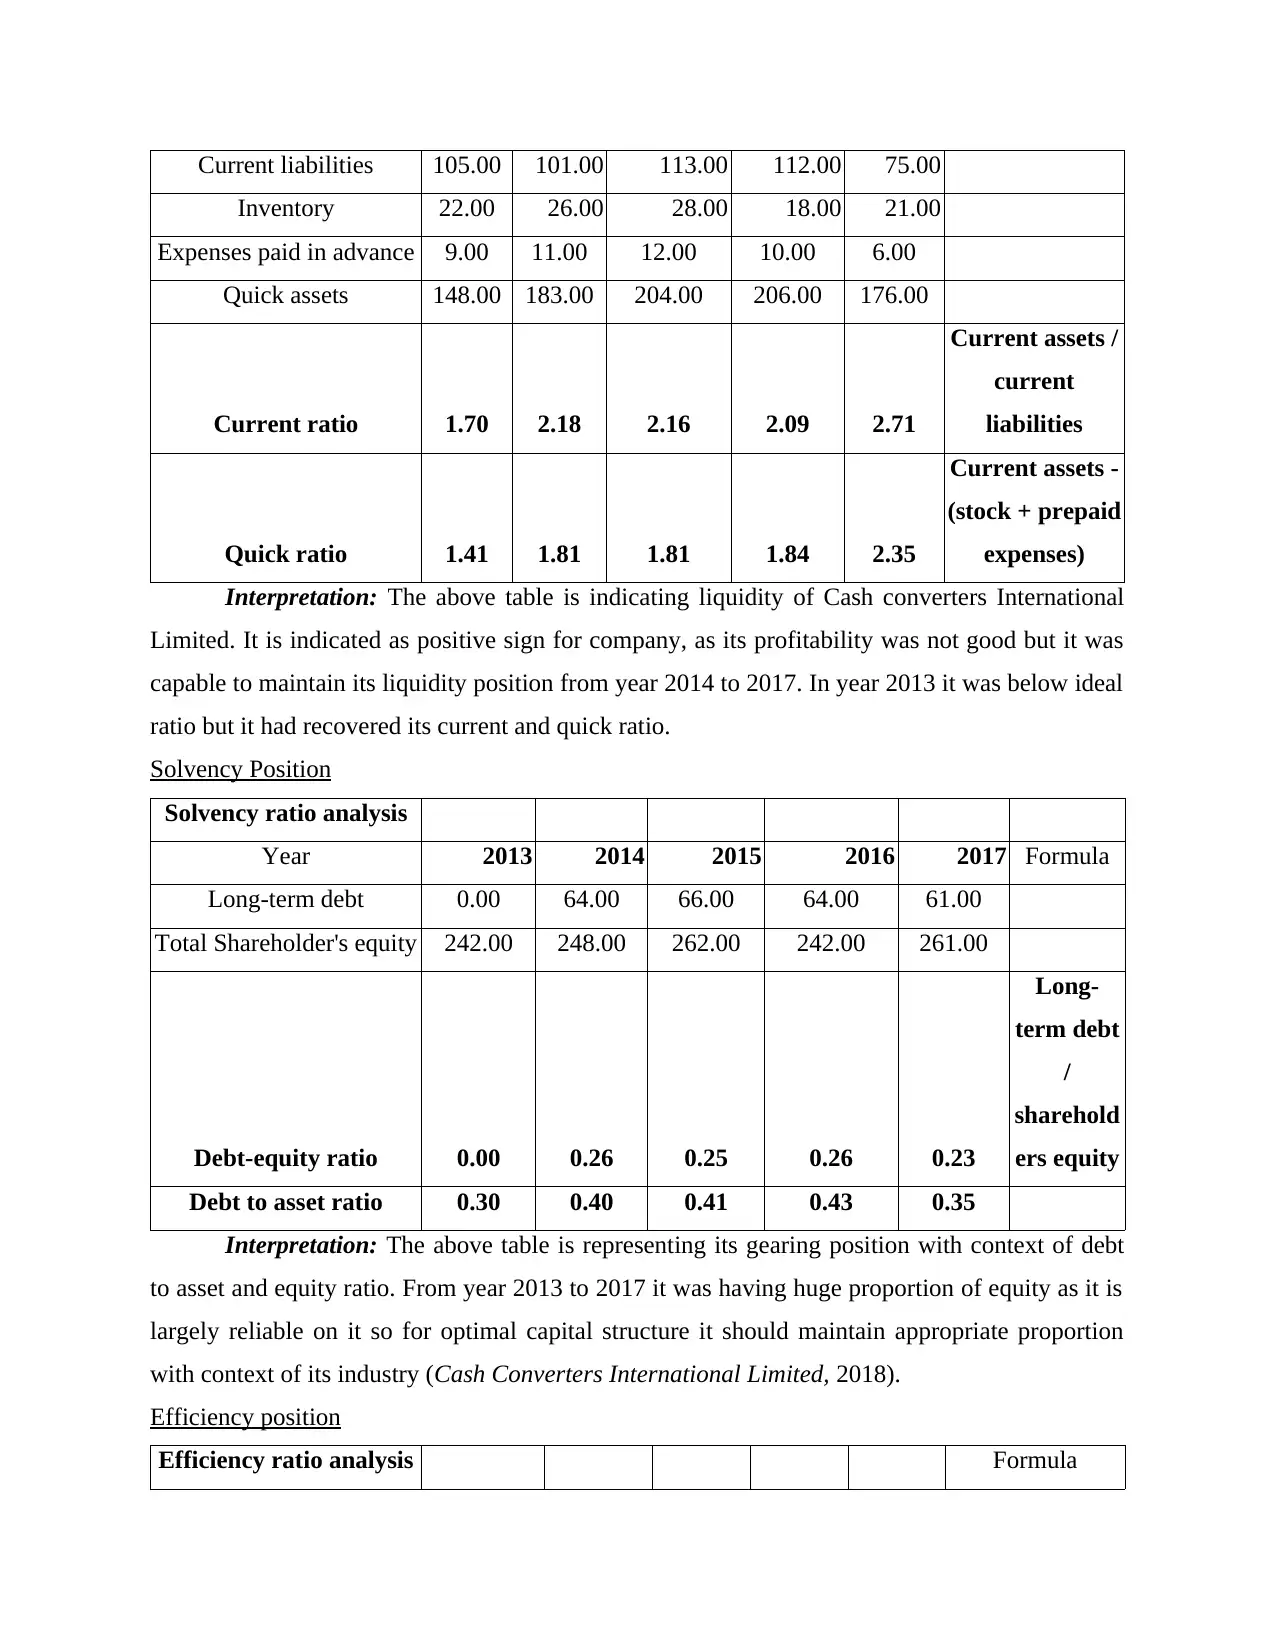
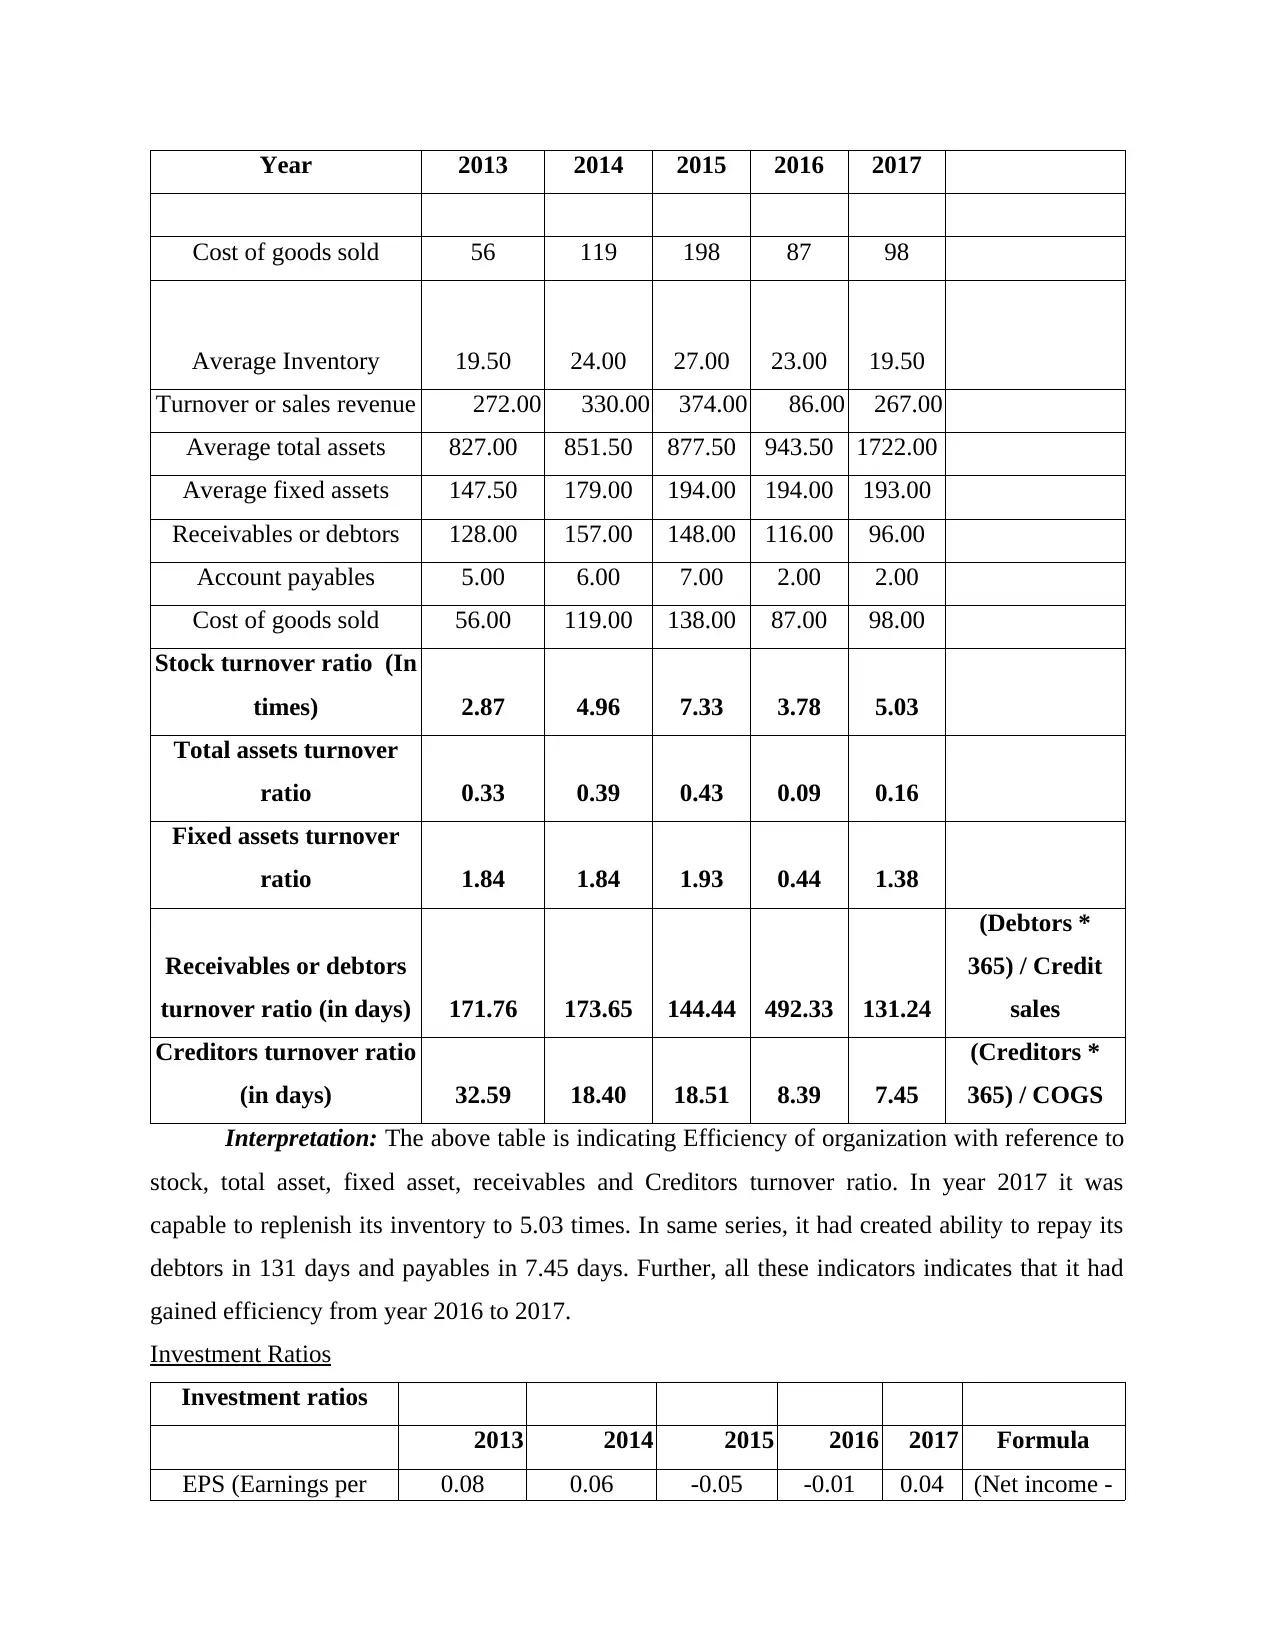
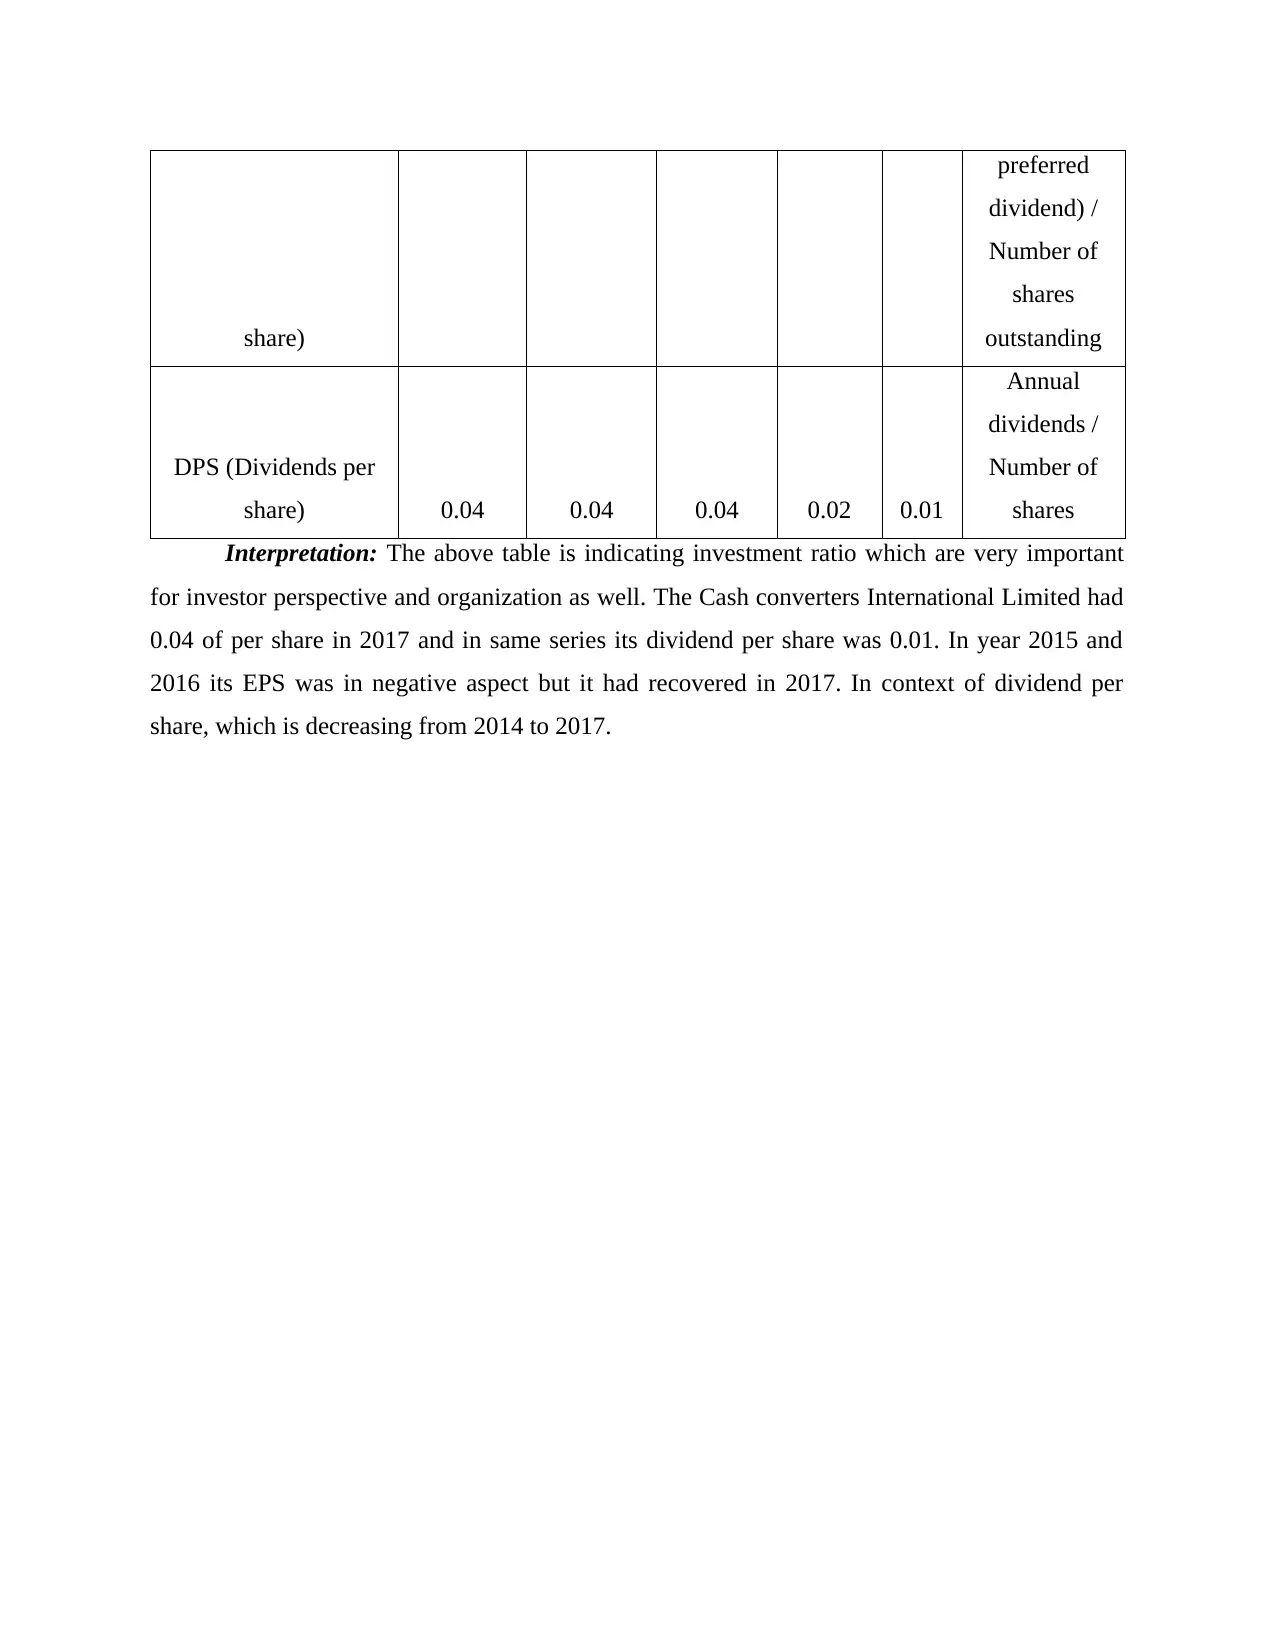
This report presents a comprehensive financial analysis of Cash Converters International Limited from 2013 to 2017. The analysis encompasses a horizontal analysis of the profit and loss statement, evaluating profitability, liquidity, solvency, efficiency, and investment ratios. The profitability analysis reveals fluctuating trends, with 2015 and 2016 being challenging years, while 2017 showed improved gross profit and operational income. Liquidity ratios indicate a positive trend, with the company maintaining a solid position from 2014 to 2017. Solvency analysis focuses on debt-equity and debt-to-asset ratios, highlighting the company's reliance on equity. Efficiency ratios, including stock turnover, asset turnover, and receivable/creditor turnover, demonstrate improved efficiency in 2017. Investment ratios, such as EPS and DPS, are also examined, showing a recovery in EPS in 2017. The report concludes with interpretations of the financial data, highlighting the company's performance trends and key financial indicators, along with references to online sources for further information.

ACCOUNTING FOR
MANAGERS
MANAGERS
Paraphrase This Document
Need a fresh take? Get an instant paraphrase of this document with our AI Paraphraser

TABLE OF CONTENTS
Horizontal Analysis of Profit and loss statement of Cash Converters International Limited.....3
Profitability position...................................................................................................................4
Liquidity Position........................................................................................................................5
Solvency Position........................................................................................................................6
Efficiency position......................................................................................................................6
Investment Ratios........................................................................................................................7
REFERENCES................................................................................................................................8

Horizontal Analysis of Profit and loss statement of Cash Converters International Limited
2013
Chang
e in
2014 2014
Chang
e in
2015 2015
Chang
e in
2016 2016
Chang
e in
2017 2017
Revenue 272 21.32% 330 13.33% 374
-
77.01% 86
210.47
% 267
Cost of goods
sold 56
112.50
% 119 15.97% 138
-
36.96% 87 12.64% 98
Gross Profit 217 -2.76% 211 11.37% 235
-
100.43
% -1
-
17000.0
0% 169
Operating
Expenses
General, sales
and
administration 85 23.53% 105 11.43% 117
-
15.38% 99 10.10% 109
Other expenses
(operating) 16
118.75
% 35
151.43
% 88
-
48.86% 45
-
55.56% 20
Total operating
cost 101 38.61% 140 46.43% 205
-
29.76% 144 -9.72% 130
Operating
Income 116
-
38.79% 71
-
57.75% 30
-
583.33
% -145
-
126.90
% 39
Interest cost 3
200.00
% 9 0.00% 9 11.11% 10
-
10.00% 9
Other Income
(Expense)
-65 -
52.31%
-31 22.58% -38 -
586.84
185 -
101.08
-2
⊘ This is a preview!⊘
Do you want full access?
Subscribe today to unlock all pages.

Trusted by 1+ million students worldwide

% %
Earning before
tax (EBT) 48
-
33.33% 32
-
153.13
% -17
-
282.35
% 31 -9.68% 28
Income tax
payable 15
-
26.67% 11
-
54.55% 5 0.00% 5 60.00% 8
Net profit
(Income) 33
-
27.27% 24
-
187.50
% -21
-
76.19% -5
-
520.00
% 21
Profitability position
Particulars Formula
Profitability ratio analysis
2013 2014 2015 2016
20
17
0.0
1
Gross Profit Margin 217.00 211.00 235.00 -1.00
16
9.0
0
Operating income 116.00 71.00 30.00
-
145.00
39.
00
Total Sales revenue 272.00 330.00 374.00 86.00
26
7.0
0
Earnings before interest
and tax (EBIT) or
operating profit 48.00 32.00 -17.00 31.00
28.
00
Total Capital employed (Total assets-current
liabilities)/ shareholders
242.00 248.00 262.00 242.00 26
1.0
Paraphrase This Document
Need a fresh take? Get an instant paraphrase of this document with our AI Paraphraser

equity 0
Net income 33.00 24.00 -21.00 -5.00
21.
00
Average total assets 827.00 851.50 877.50 943.50
17
22.
00
Gross Margin ratio Gross profit / sales * 100 0.80 0.64 0.63 -0.01
0.6
3
Operating margin ratio Net profit / sales * 100 0.43 0.22 0.08 -1.69
0.1
5
Return on capital
employed EBIT / capital employed 0.20 0.13 -0.06 0.13
0.1
1
Return on assets
Net income / average
total assets 0.04 0.03 -0.02 -0.01
0.0
1
Interpretation: The above table is indicating profitability position of cash converters
International limited from five years 2013 to 2017. While, observing its financials, 2015 and
2016 was very struggling duration but in 2017 it was capable to incur profit. In 2016 it was
involved in unscrupulous and irresponsible lending which was via payday loan schemes which
was one of the main reason for poor financials(Cash Converters, 2018). The trend of gross profit
is decreasing from year to year but in 2017 it was capable to generate revenue which had
reflected positively in its gross profit. Simultaneously, it was capable to generate income from its
operation similar to gross profit. On the basis of return with context of equity was 0.13 in 2016
and it had decreased to 0.11 in 2017. Further it could justify that its profitability is increasing
from year 2016 to 2017.
Liquidity Position
Liquidity ratio analysis
2013 2014 2015 2016 2017 Formula
Current assets 179.00 220.00 244.00 234.00 203.00

Current liabilities 105.00 101.00 113.00 112.00 75.00
Inventory 22.00 26.00 28.00 18.00 21.00
Expenses paid in advance 9.00 11.00 12.00 10.00 6.00
Quick assets 148.00 183.00 204.00 206.00 176.00
Current ratio 1.70 2.18 2.16 2.09 2.71
Current assets /
current
liabilities
Quick ratio 1.41 1.81 1.81 1.84 2.35
Current assets -
(stock + prepaid
expenses)
Interpretation: The above table is indicating liquidity of Cash converters International
Limited. It is indicated as positive sign for company, as its profitability was not good but it was
capable to maintain its liquidity position from year 2014 to 2017. In year 2013 it was below ideal
ratio but it had recovered its current and quick ratio.
Solvency Position
Solvency ratio analysis
Year 2013 2014 2015 2016 2017 Formula
Long-term debt 0.00 64.00 66.00 64.00 61.00
Total Shareholder's equity 242.00 248.00 262.00 242.00 261.00
Debt-equity ratio 0.00 0.26 0.25 0.26 0.23
Long-
term debt
/
sharehold
ers equity
Debt to asset ratio 0.30 0.40 0.41 0.43 0.35
Interpretation: The above table is representing its gearing position with context of debt
to asset and equity ratio. From year 2013 to 2017 it was having huge proportion of equity as it is
largely reliable on it so for optimal capital structure it should maintain appropriate proportion
with context of its industry (Cash Converters International Limited, 2018).
Efficiency position
Efficiency ratio analysis Formula
⊘ This is a preview!⊘
Do you want full access?
Subscribe today to unlock all pages.

Trusted by 1+ million students worldwide

Year 2013 2014 2015 2016 2017
Cost of goods sold 56 119 198 87 98
Average Inventory 19.50 24.00 27.00 23.00 19.50
Turnover or sales revenue 272.00 330.00 374.00 86.00 267.00
Average total assets 827.00 851.50 877.50 943.50 1722.00
Average fixed assets 147.50 179.00 194.00 194.00 193.00
Receivables or debtors 128.00 157.00 148.00 116.00 96.00
Account payables 5.00 6.00 7.00 2.00 2.00
Cost of goods sold 56.00 119.00 138.00 87.00 98.00
Stock turnover ratio (In
times) 2.87 4.96 7.33 3.78 5.03
Total assets turnover
ratio 0.33 0.39 0.43 0.09 0.16
Fixed assets turnover
ratio 1.84 1.84 1.93 0.44 1.38
Receivables or debtors
turnover ratio (in days) 171.76 173.65 144.44 492.33 131.24
(Debtors *
365) / Credit
sales
Creditors turnover ratio
(in days) 32.59 18.40 18.51 8.39 7.45
(Creditors *
365) / COGS
Interpretation: The above table is indicating Efficiency of organization with reference to
stock, total asset, fixed asset, receivables and Creditors turnover ratio. In year 2017 it was
capable to replenish its inventory to 5.03 times. In same series, it had created ability to repay its
debtors in 131 days and payables in 7.45 days. Further, all these indicators indicates that it had
gained efficiency from year 2016 to 2017.
Investment Ratios
Investment ratios
2013 2014 2015 2016 2017 Formula
EPS (Earnings per 0.08 0.06 -0.05 -0.01 0.04 (Net income -
Paraphrase This Document
Need a fresh take? Get an instant paraphrase of this document with our AI Paraphraser

share)
preferred
dividend) /
Number of
shares
outstanding
DPS (Dividends per
share) 0.04 0.04 0.04 0.02 0.01
Annual
dividends /
Number of
shares
Interpretation: The above table is indicating investment ratio which are very important
for investor perspective and organization as well. The Cash converters International Limited had
0.04 of per share in 2017 and in same series its dividend per share was 0.01. In year 2015 and
2016 its EPS was in negative aspect but it had recovered in 2017. In context of dividend per
share, which is decreasing from 2014 to 2017.
1 out of 8
Related Documents
Your All-in-One AI-Powered Toolkit for Academic Success.
+13062052269
info@desklib.com
Available 24*7 on WhatsApp / Email
Unlock your academic potential
Copyright © 2020–2025 A2Z Services. All Rights Reserved. Developed and managed by ZUCOL.


