Accounting Fundamentals: Financial Statements, Ratios, and Analysis
VerifiedAdded on 2023/06/18
|17
|2407
|188
AI Summary
This article covers the basics of accounting fundamentals, including financial statements, balance sheets, and income statements. It also includes a detailed analysis of financial ratios for Chocco plc, a chocolate and confectionery manufacturer. The article provides insights into the company's profitability, liquidity, and efficiency, along with suggestions for future development. The subject is Accounting, and the course code is not mentioned. The article is relevant for students studying accounting in any college or university.
Contribute Materials
Your contribution can guide someone’s learning journey. Share your
documents today.

ACCOUNTING
FUNDAMENTALS
FUNDAMENTALS
Secure Best Marks with AI Grader
Need help grading? Try our AI Grader for instant feedback on your assignments.
TABLE OF CONTENTS
INTRODUCTION...........................................................................................................................3
MAIN BODY...................................................................................................................................3
QUESTION- 1.................................................................................................................................3
a) Financial statements of Kedison PLC.....................................................................................3
b) Reason for balancing of the statement of financial position...................................................6
QUESTION- 2.................................................................................................................................6
REFERENCES..............................................................................................................................17
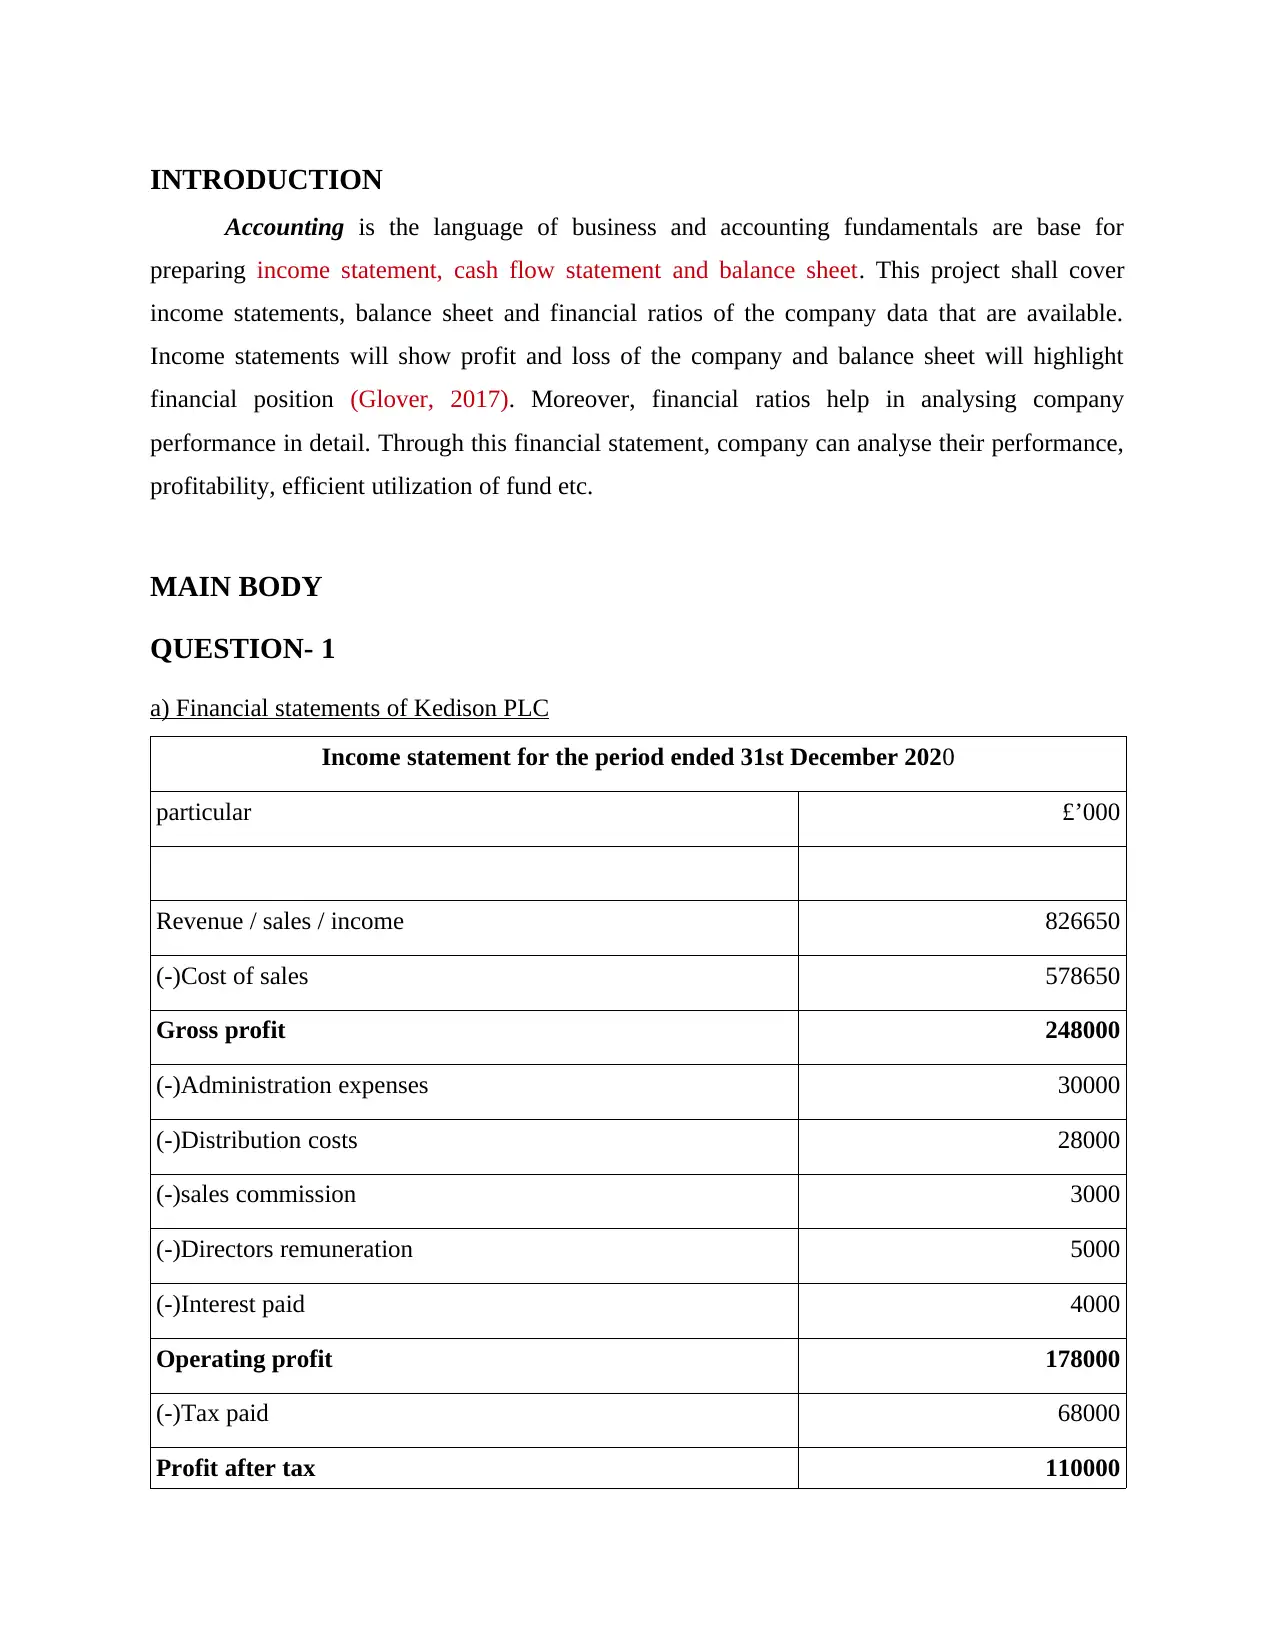
INTRODUCTION
Accounting is the language of business and accounting fundamentals are base for
preparing income statement, cash flow statement and balance sheet. This project shall cover
income statements, balance sheet and financial ratios of the company data that are available.
Income statements will show profit and loss of the company and balance sheet will highlight
financial position (Glover, 2017). Moreover, financial ratios help in analysing company
performance in detail. Through this financial statement, company can analyse their performance,
profitability, efficient utilization of fund etc.
MAIN BODY
QUESTION- 1
a) Financial statements of Kedison PLC
Income statement for the period ended 31st December 2020
particular £’000
Revenue / sales / income 826650
(-)Cost of sales 578650
Gross profit 248000
(-)Administration expenses 30000
(-)Distribution costs 28000
(-)sales commission 3000
(-)Directors remuneration 5000
(-)Interest paid 4000
Operating profit 178000
(-)Tax paid 68000
Profit after tax 110000
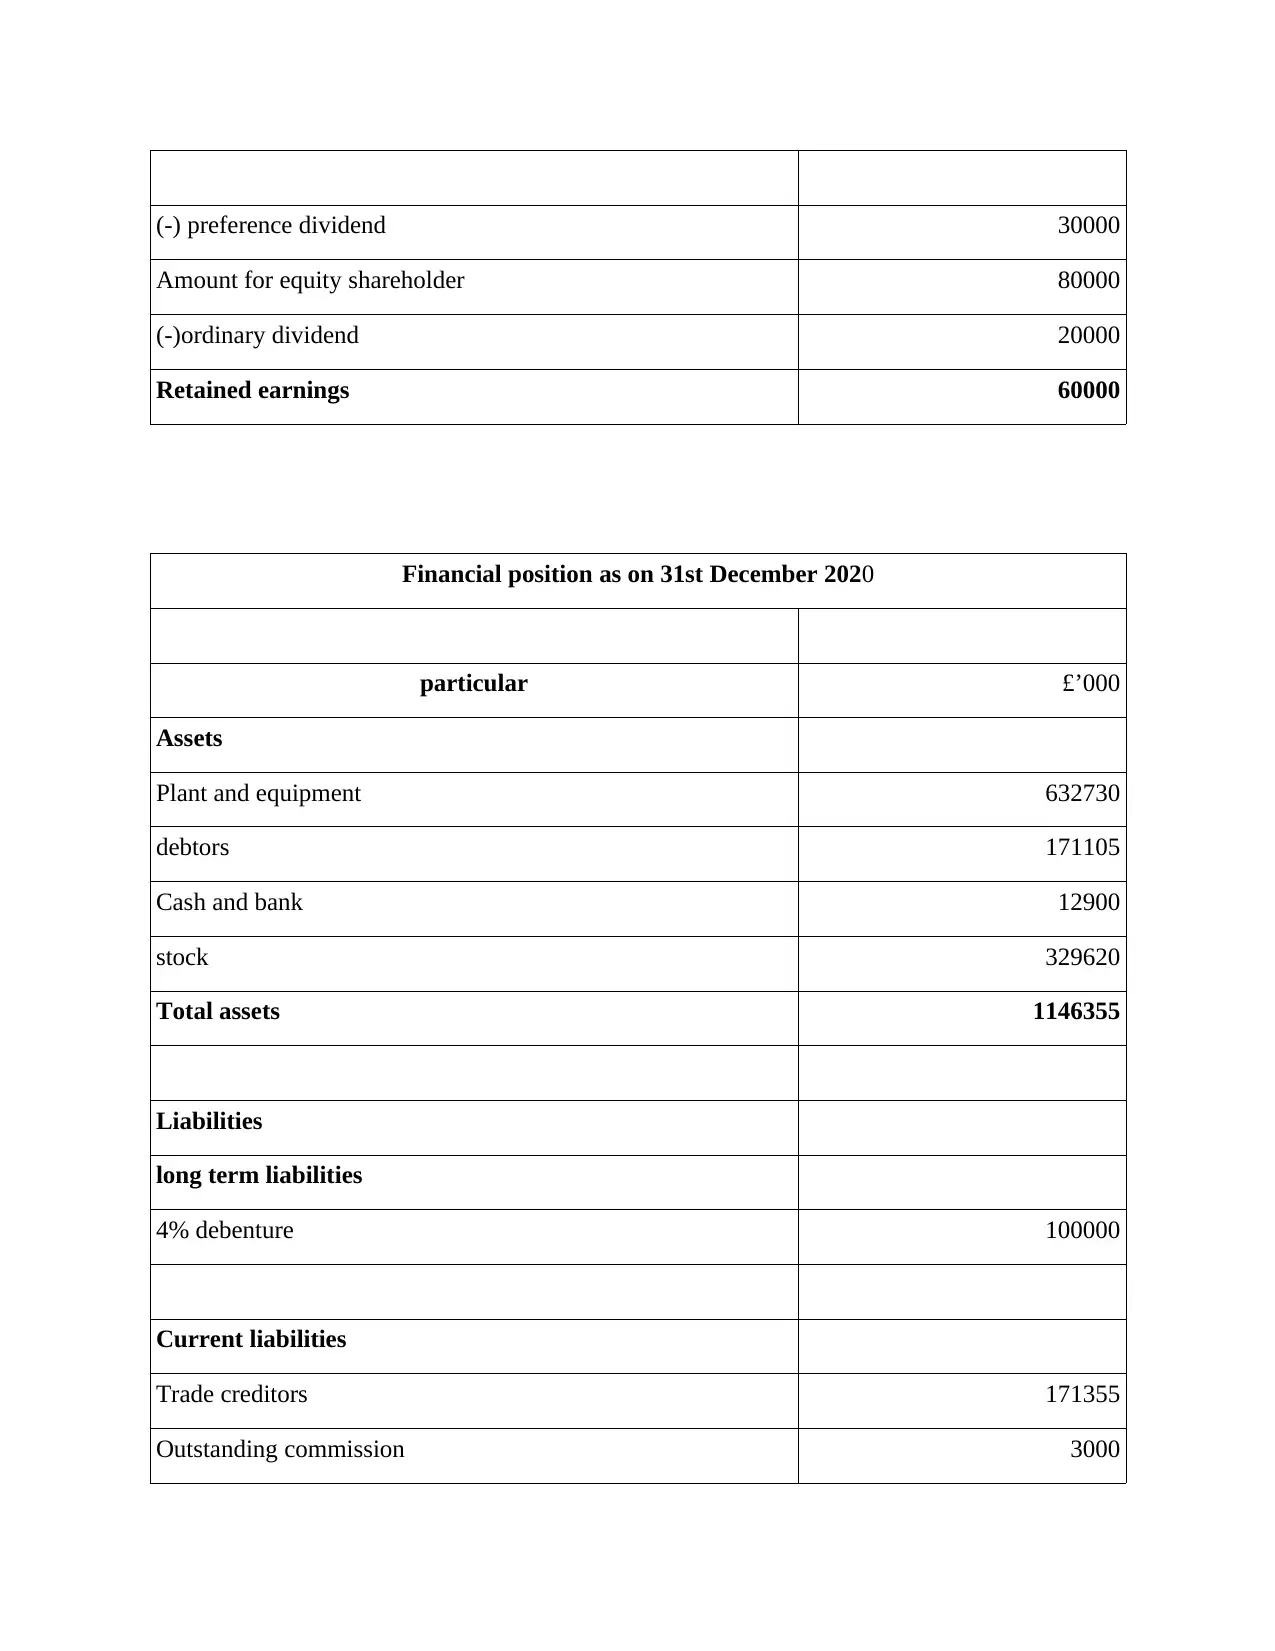
(-) preference dividend 30000
Amount for equity shareholder 80000
(-)ordinary dividend 20000
Retained earnings 60000
Financial position as on 31st December 2020
particular £’000
Assets
Plant and equipment 632730
debtors 171105
Cash and bank 12900
stock 329620
Total assets 1146355
Liabilities
long term liabilities
4% debenture 100000
Current liabilities
Trade creditors 171355
Outstanding commission 3000
Secure Best Marks with AI Grader
Need help grading? Try our AI Grader for instant feedback on your assignments.
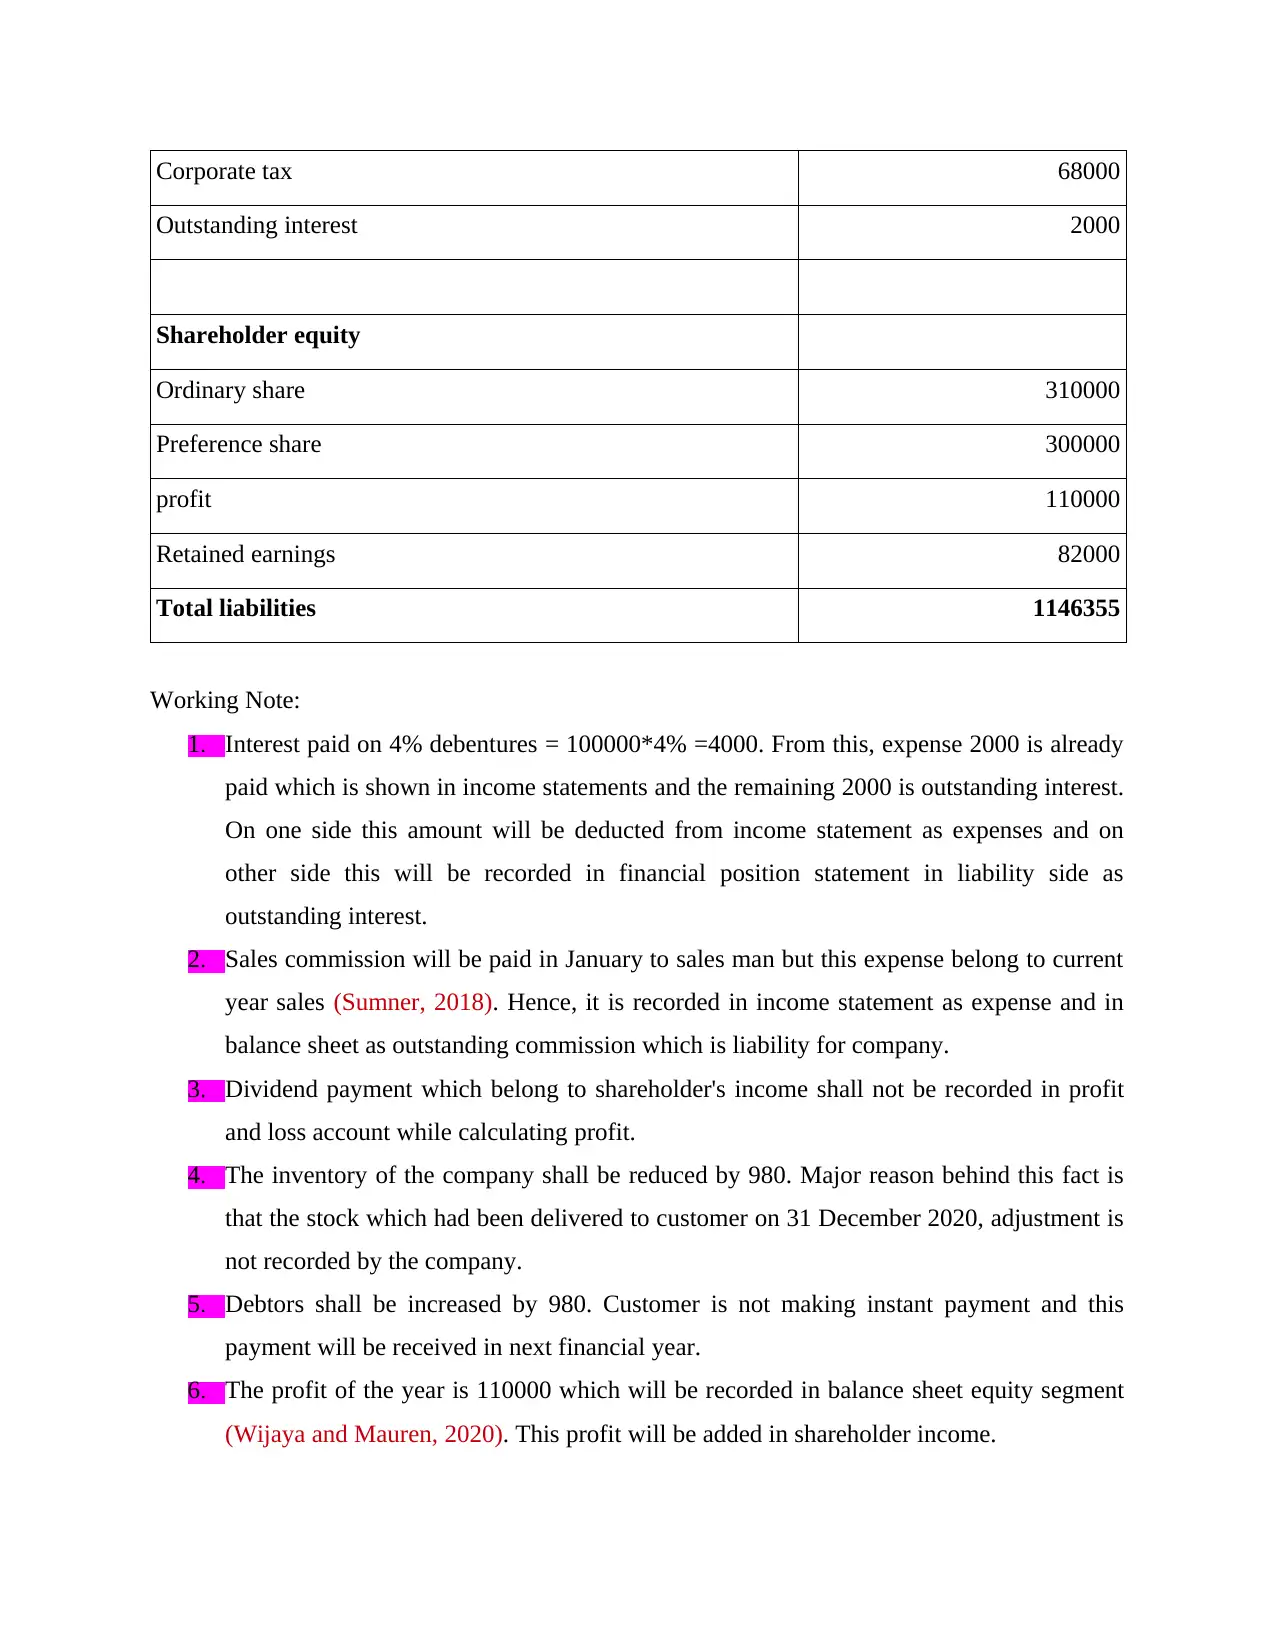
Corporate tax 68000
Outstanding interest 2000
Shareholder equity
Ordinary share 310000
Preference share 300000
profit 110000
Retained earnings 82000
Total liabilities 1146355
Working Note:
1. Interest paid on 4% debentures = 100000*4% =4000. From this, expense 2000 is already
paid which is shown in income statements and the remaining 2000 is outstanding interest.
On one side this amount will be deducted from income statement as expenses and on
other side this will be recorded in financial position statement in liability side as
outstanding interest.
2. Sales commission will be paid in January to sales man but this expense belong to current
year sales (Sumner, 2018). Hence, it is recorded in income statement as expense and in
balance sheet as outstanding commission which is liability for company.
3. Dividend payment which belong to shareholder's income shall not be recorded in profit
and loss account while calculating profit.
4. The inventory of the company shall be reduced by 980. Major reason behind this fact is
that the stock which had been delivered to customer on 31 December 2020, adjustment is
not recorded by the company.
5. Debtors shall be increased by 980. Customer is not making instant payment and this
payment will be received in next financial year.
6. The profit of the year is 110000 which will be recorded in balance sheet equity segment
(Wijaya and Mauren, 2020). This profit will be added in shareholder income.
7. Retain earnings shall be used for dividend payment which are deducted from current year
retain earnings that is 132000-50000= 82000. This shall be paid 30000 to preference
shareholder and 20000 will to equity shareholder as dividend. So remaining 82000 shall
be recorded in balance sheet equity segment.
8. Corporate tax shall be paid, which is deducted from profit before tax (EBT) and on the
other side this shall be shown in balance sheet liabilities segment.
b) Reason for balancing of the statement of financial position
Accounting equation is known as base for double entry system in which assets is equivalent to
liabilities and shareholder equity. Balance sheet is based on this equation where one is assets side
and other is liabilities side to prove this equation, it needs to be balanced (Witczak and Zimny,
2021). Double entry system ensure that each entry has double aspect one is on debit side and
other is on credit side. This equation of accounting ensure that both the side of balance sheet are
equal and in addition to it also shows that how company is procuring and deploying the fund.
The accounting equation is also called as error detection tool because whenever debit accounts is
not equal to credit accounts means there is an error.
QUESTION- 2
Financial Ratio analysis of Chocco plc, A chocolate and confectionery manufacture
Financial Ratios
s.
no particular formulas 2020 2019
1
Return on capital
employed
Earnings before interest and tax / capital
employed 11.71% 10.23%
Earnings before interest
and tax 846 720
Capital employed Total assets- current liabilities 7225 7041
0.09
0.095
0.1
0.105
0.11
0.115
0.12
RETURN ON CAPITAL EMPLOYED
2020
2019
YEAR
PERCENTAGE
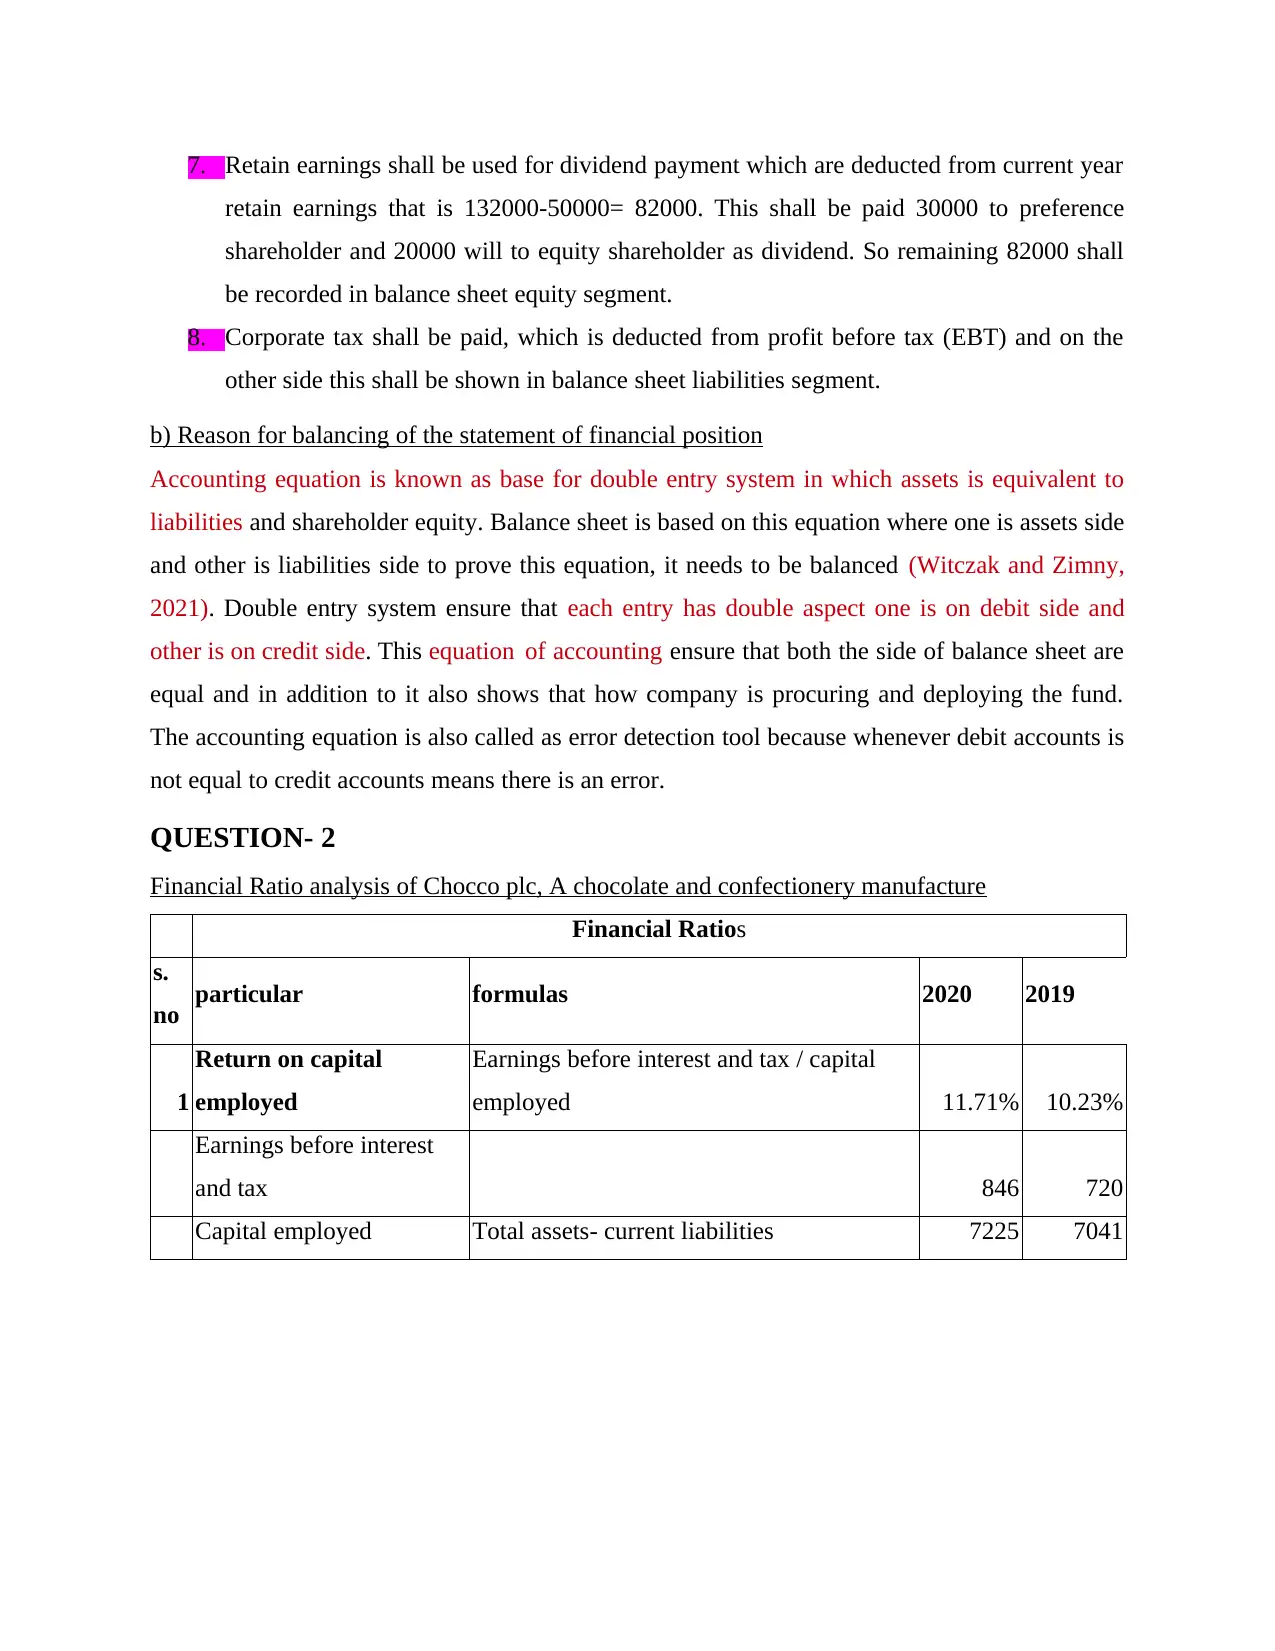
Interpretation:
Return on capital employed ratio is used to measure profitability of the company means how
efficiently company is utilizing their fund to generate profit. As above calculation, it has shown
that earning of the company increased by 1.48% means company is attractively using fund in
order to increase profit (Huo and et.al., 2018). It can be improved more by selling off
unprofitable assets or by paying off debt, inventory management etc.
2 Return on equity Net income / shareholder's equity 13.96% 12.57%
Net income 431 366
Shareholder's equity 3088 2912
0.095
0.1
0.105
0.11
0.115
0.12
RETURN ON CAPITAL EMPLOYED
2020
2019
YEAR
PERCENTAGE
Interpretation:
Return on capital employed ratio is used to measure profitability of the company means how
efficiently company is utilizing their fund to generate profit. As above calculation, it has shown
that earning of the company increased by 1.48% means company is attractively using fund in
order to increase profit (Huo and et.al., 2018). It can be improved more by selling off
unprofitable assets or by paying off debt, inventory management etc.
2 Return on equity Net income / shareholder's equity 13.96% 12.57%
Net income 431 366
Shareholder's equity 3088 2912
Paraphrase This Document
Need a fresh take? Get an instant paraphrase of this document with our AI Paraphraser
0.052
0.054
0.056
0.058
0.06
0.062
0.064
RETURN ON EQUITY
2020
2019
YEAR
PERCENTAGE
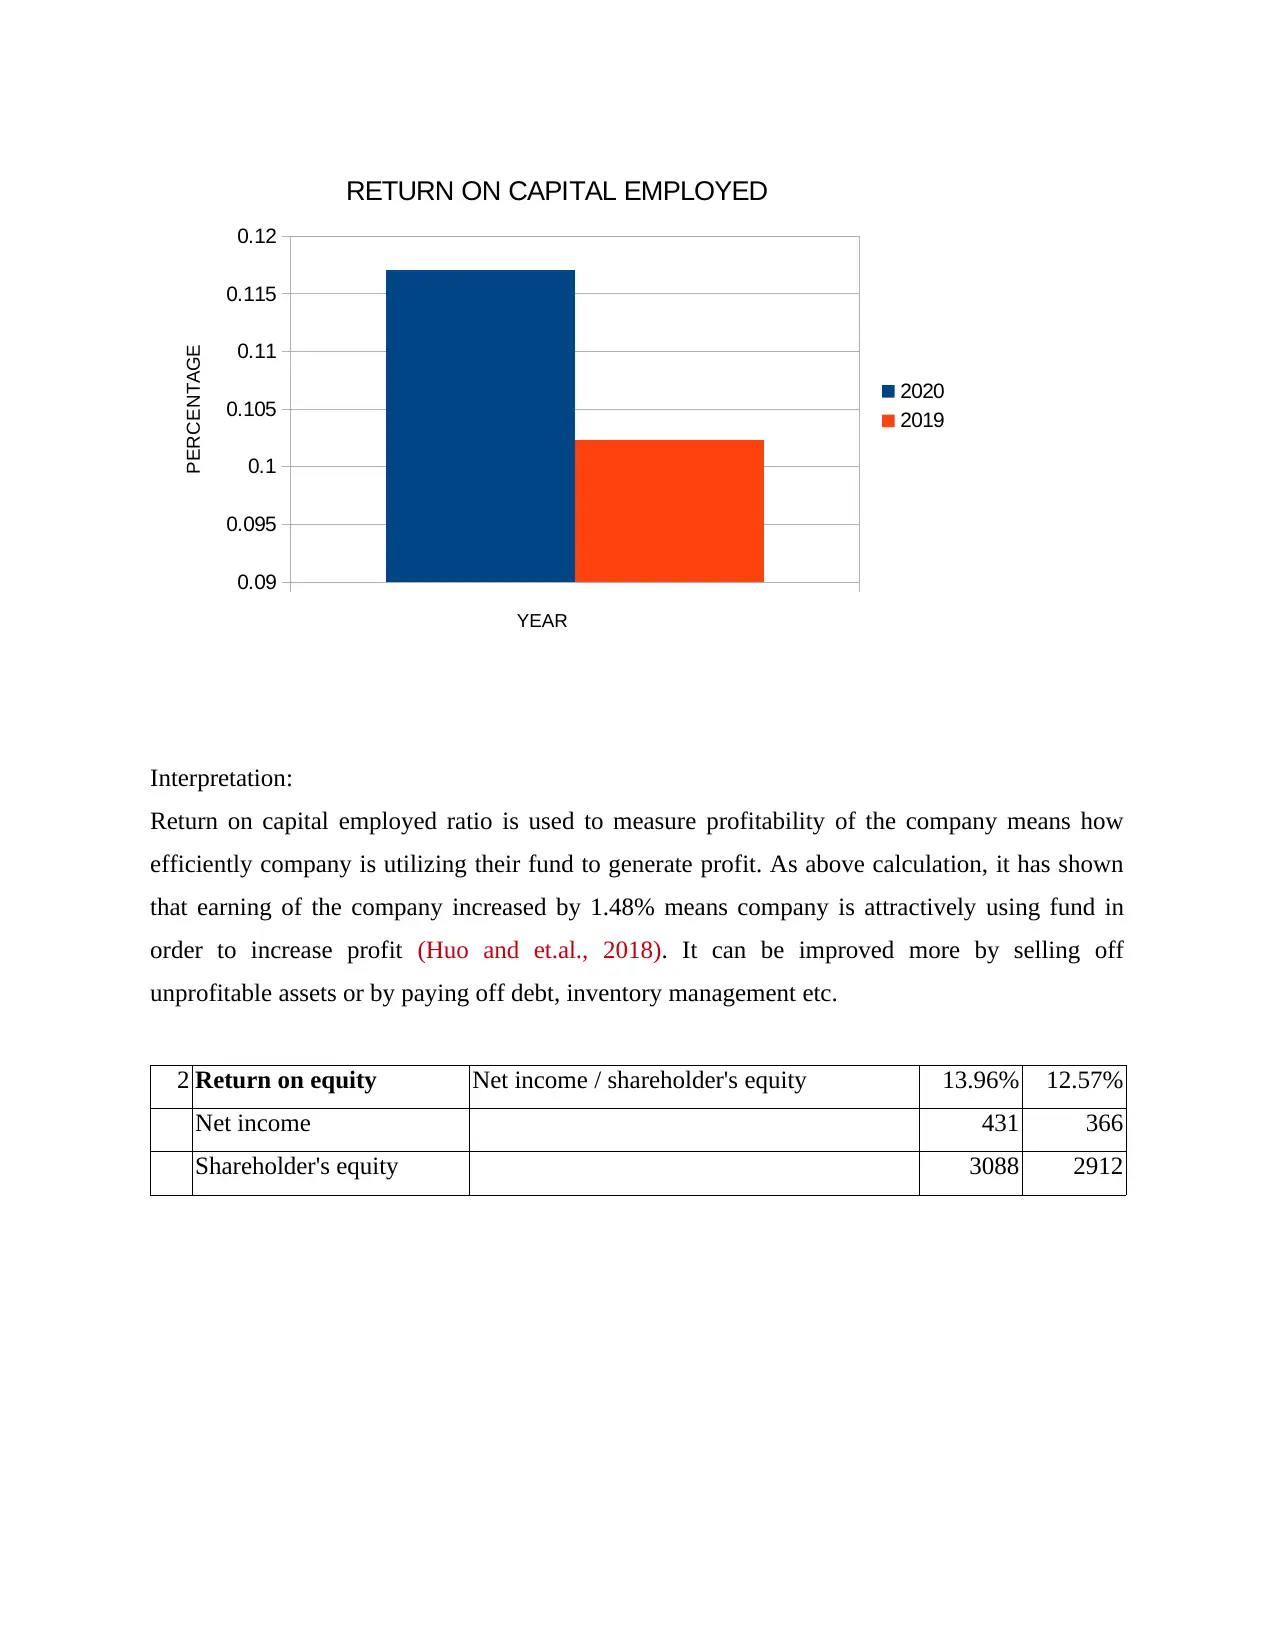
Interpretation:
Return on equity ratio is used to measure profitability of company in respect to equity. This ratio
ensures that how well equity fund is utilizing to get more profit. From the above calculation, it
has shown that company is efficiently utilizing their capital and this ratio is increased by 1.39%
from 2019 to 2020 which is good for the company (Felber, Campos and Sanchis, 2019 ). This
ratio can be improved by reducing cost or by raise the price of the product, investing idle cash,
use financial leverage to increase profitability.
3 Earnings per share Net profit / No. Of equity shares 0.72 0.61
Net profit 431 366
No. Of outstanding share 600 600
0.054
0.056
0.058
0.06
0.062
0.064
RETURN ON EQUITY
2020
2019
YEAR
PERCENTAGE
Interpretation:
Return on equity ratio is used to measure profitability of company in respect to equity. This ratio
ensures that how well equity fund is utilizing to get more profit. From the above calculation, it
has shown that company is efficiently utilizing their capital and this ratio is increased by 1.39%
from 2019 to 2020 which is good for the company (Felber, Campos and Sanchis, 2019 ). This
ratio can be improved by reducing cost or by raise the price of the product, investing idle cash,
use financial leverage to increase profitability.
3 Earnings per share Net profit / No. Of equity shares 0.72 0.61
Net profit 431 366
No. Of outstanding share 600 600
0.54
0.56
0.58
0.6
0.62
0.64
0.66
0.68
0.7
0.72
EARNING PER SHARE
2020
2019
YEAR
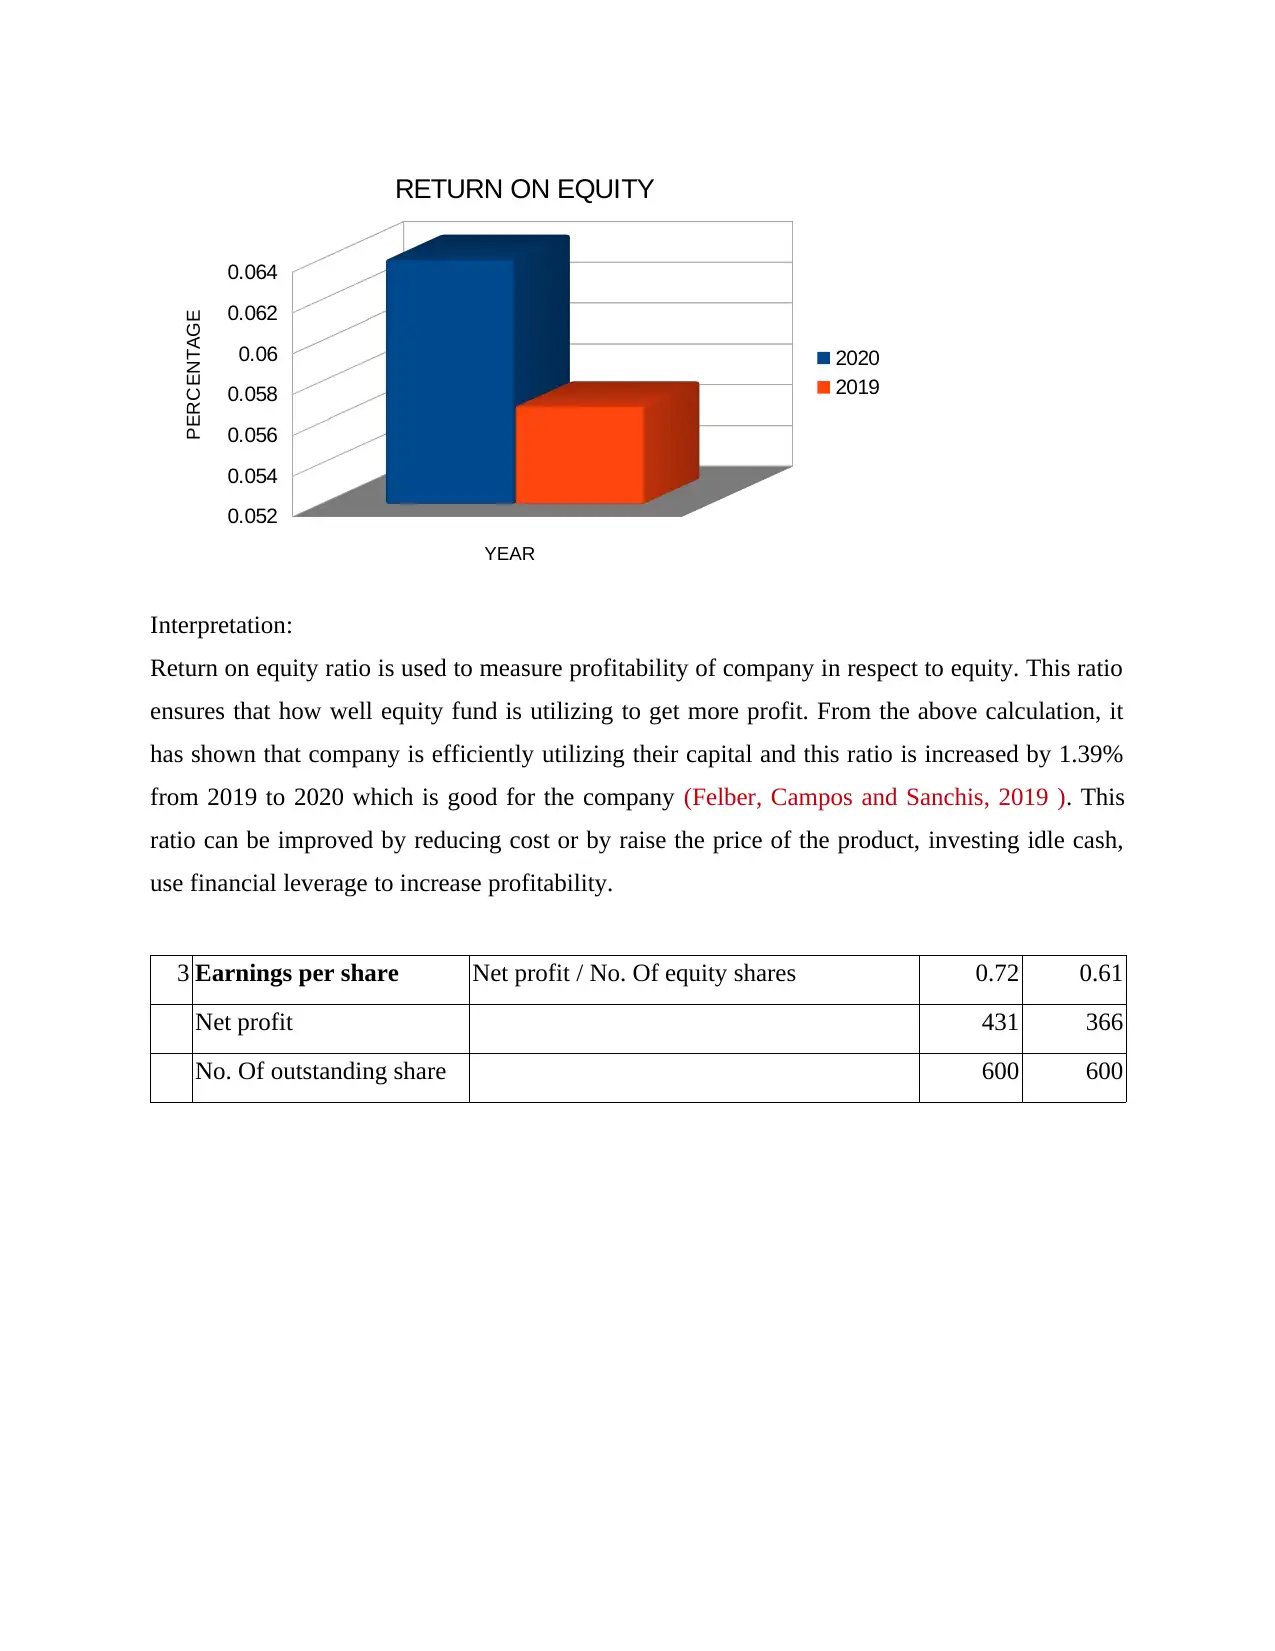
Interpretation:
Earnings per share ratio shows how much money company is earning on per share. This ratio is
more beneficial from investor point of view. Here based on above computation, it is shown that
EPS is increased by 0.11 from 2019 to 2020. Company can do batter and has potential to grow
by increasing profit and reducing expenses, share repurchase etc.
4 Net profit margin Net profit * 100 / net sales 6.40% 5.68%
Net profit 431 366
Net sales 6738 6441
0.56
0.58
0.6
0.62
0.64
0.66
0.68
0.7
0.72
EARNING PER SHARE
2020
2019
YEAR
Interpretation:
Earnings per share ratio shows how much money company is earning on per share. This ratio is
more beneficial from investor point of view. Here based on above computation, it is shown that
EPS is increased by 0.11 from 2019 to 2020. Company can do batter and has potential to grow
by increasing profit and reducing expenses, share repurchase etc.
4 Net profit margin Net profit * 100 / net sales 6.40% 5.68%
Net profit 431 366
Net sales 6738 6441
0.052
0.054
0.056
0.058
0.06
0.062
0.064
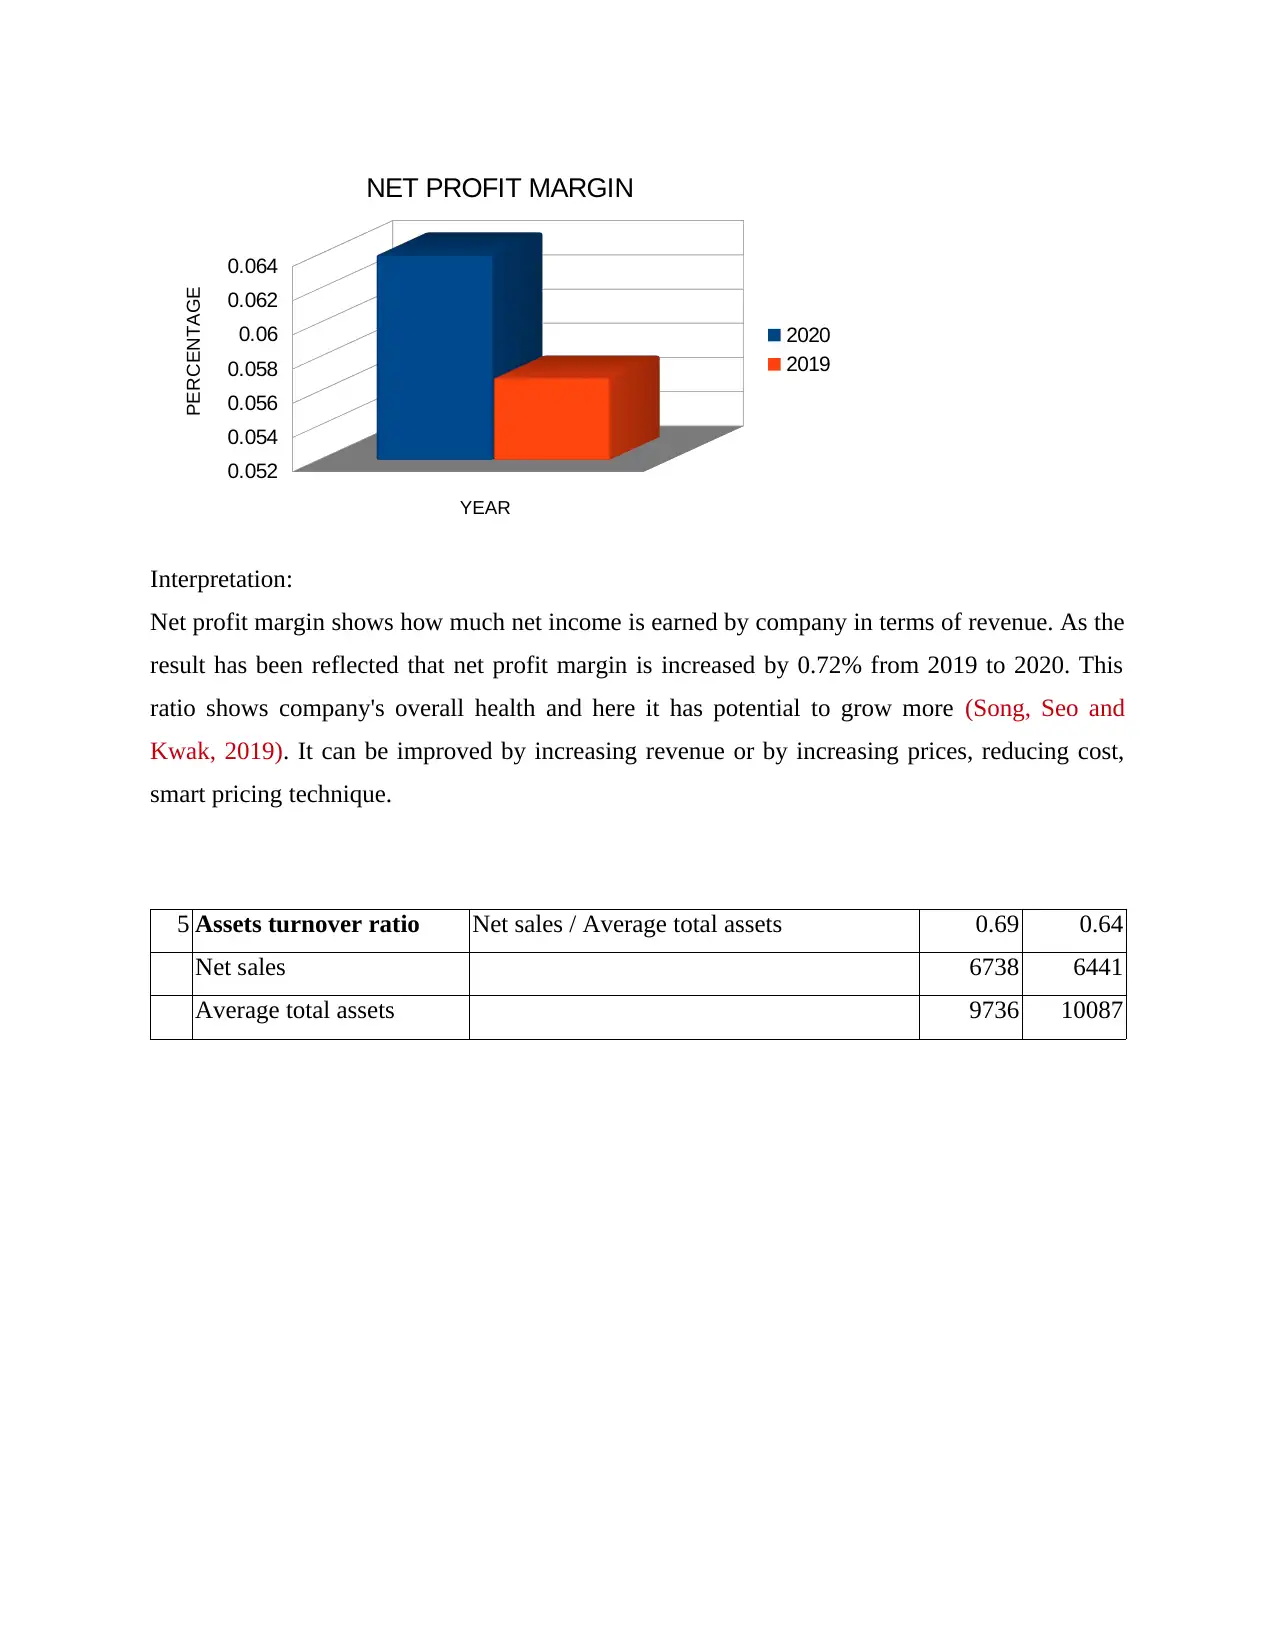
NET PROFIT MARGIN
2020
2019
YEAR
PERCENTAGE
Interpretation:
Net profit margin shows how much net income is earned by company in terms of revenue. As the
result has been reflected that net profit margin is increased by 0.72% from 2019 to 2020. This
ratio shows company's overall health and here it has potential to grow more (Song, Seo and
Kwak, 2019). It can be improved by increasing revenue or by increasing prices, reducing cost,
smart pricing technique.
5 Assets turnover ratio Net sales / Average total assets 0.69 0.64
Net sales 6738 6441
Average total assets 9736 10087
0.054
0.056
0.058
0.06
0.062
0.064
NET PROFIT MARGIN
2020
2019
YEAR
PERCENTAGE
Interpretation:
Net profit margin shows how much net income is earned by company in terms of revenue. As the
result has been reflected that net profit margin is increased by 0.72% from 2019 to 2020. This
ratio shows company's overall health and here it has potential to grow more (Song, Seo and
Kwak, 2019). It can be improved by increasing revenue or by increasing prices, reducing cost,
smart pricing technique.
5 Assets turnover ratio Net sales / Average total assets 0.69 0.64
Net sales 6738 6441
Average total assets 9736 10087
Secure Best Marks with AI Grader
Need help grading? Try our AI Grader for instant feedback on your assignments.
0.61
0.62
0.63
0.64
0.65
0.66
0.67
0.68
0.69
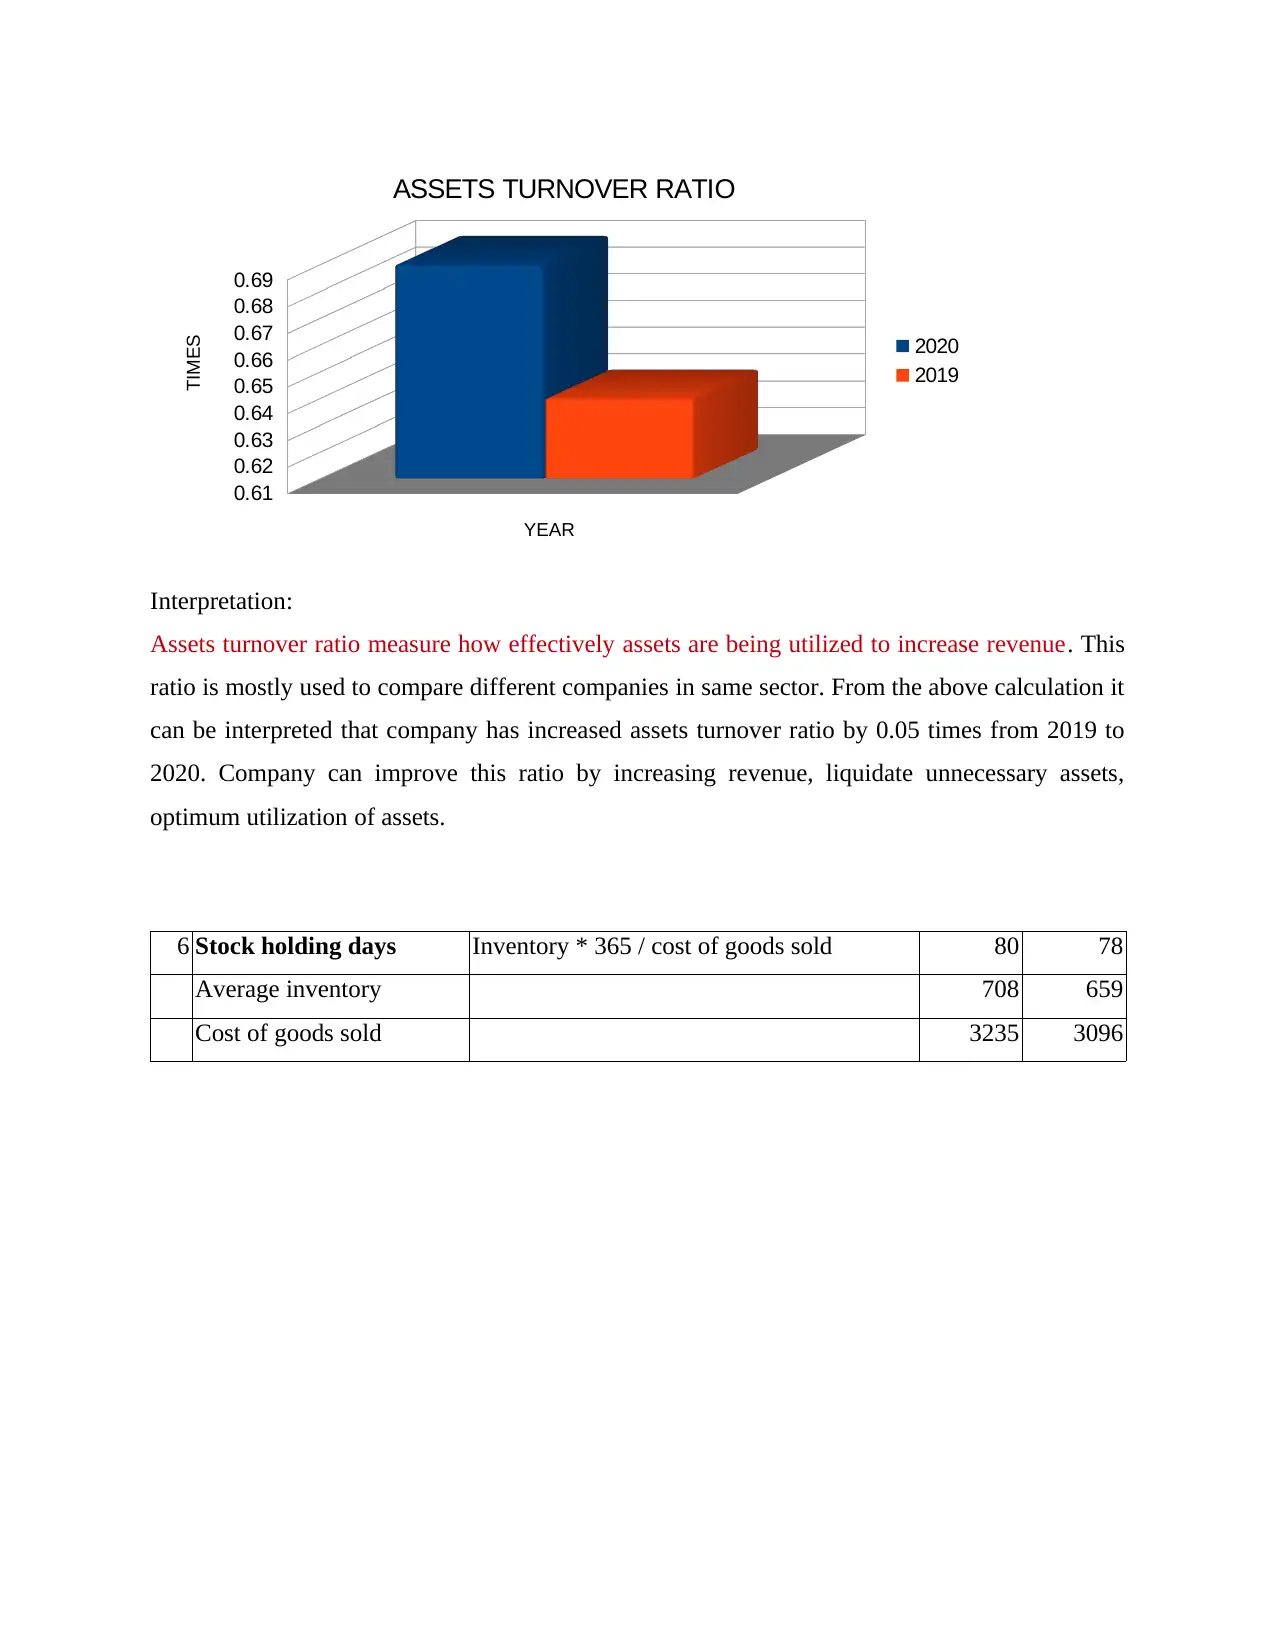
ASSETS TURNOVER RATIO
2020
2019
YEAR
TIMES
Interpretation:
Assets turnover ratio measure how effectively assets are being utilized to increase revenue. This
ratio is mostly used to compare different companies in same sector. From the above calculation it
can be interpreted that company has increased assets turnover ratio by 0.05 times from 2019 to
2020. Company can improve this ratio by increasing revenue, liquidate unnecessary assets,
optimum utilization of assets.
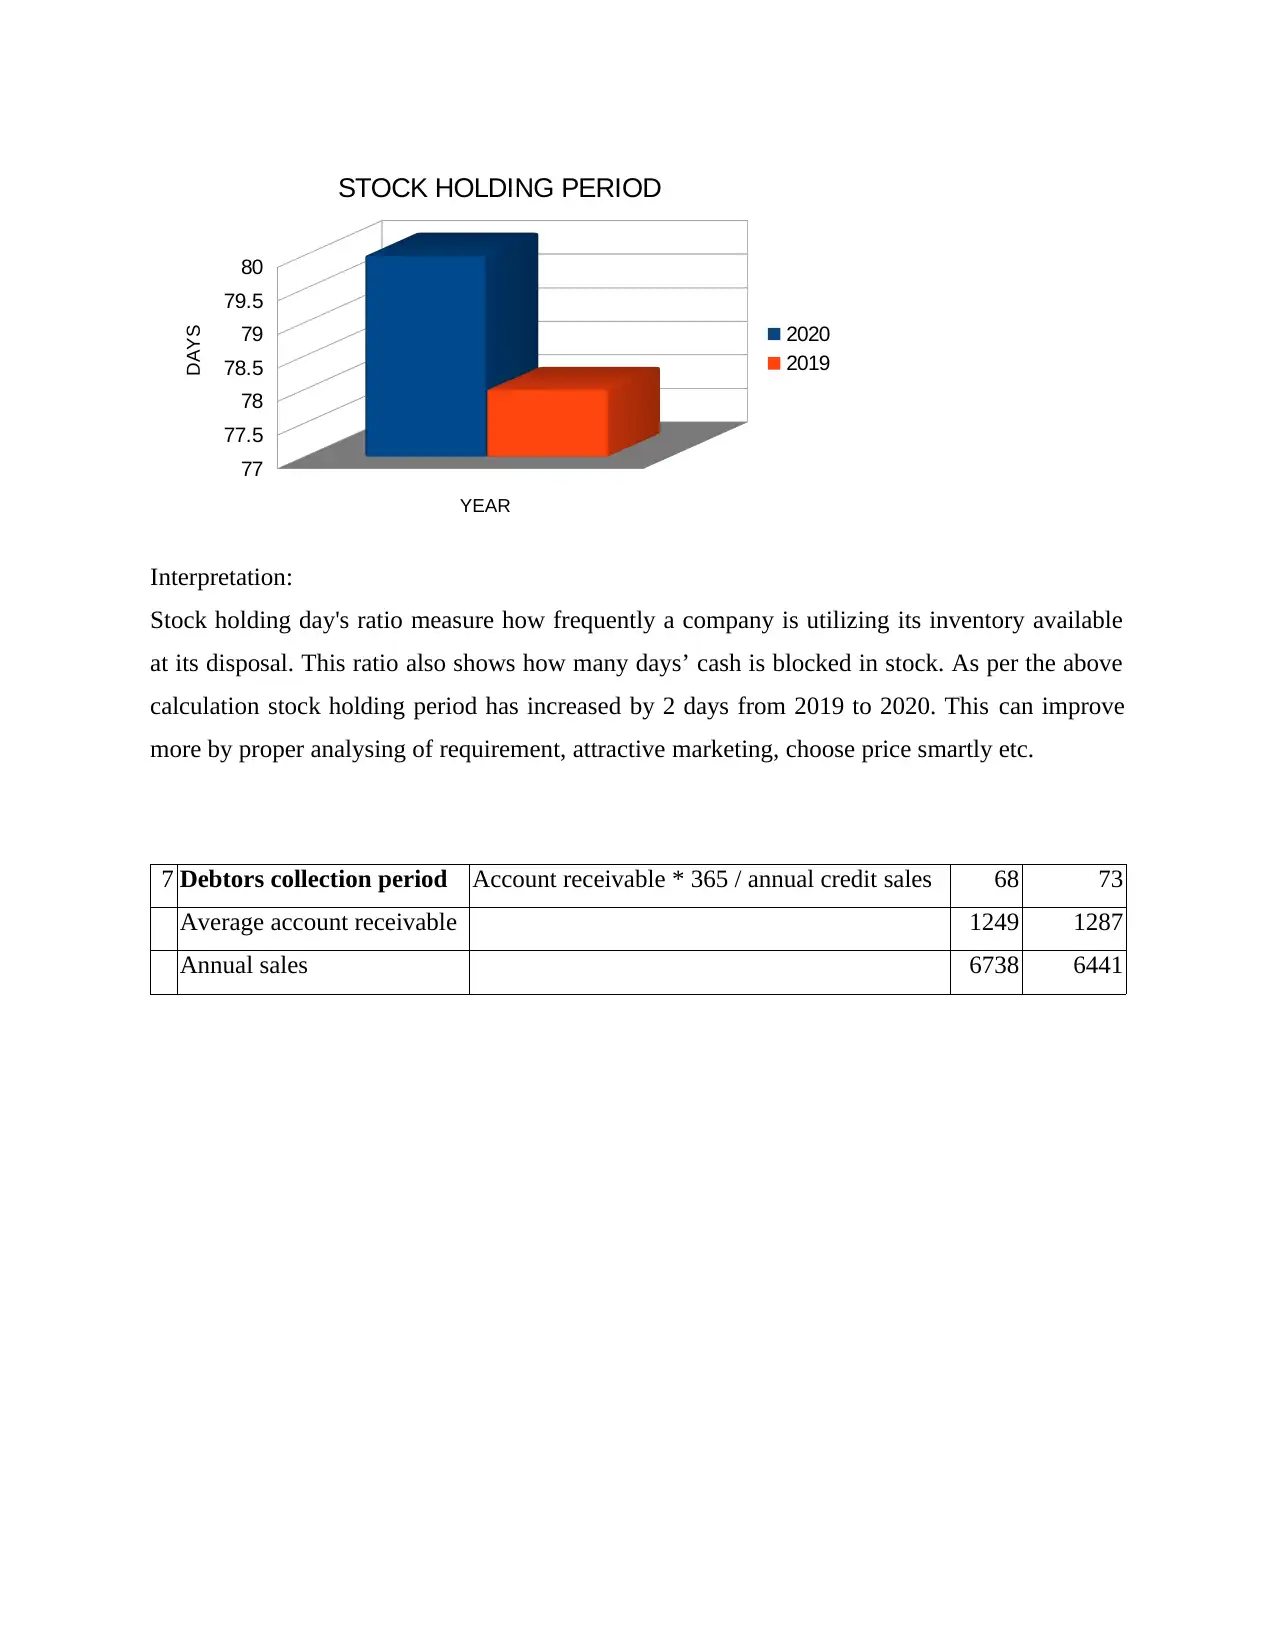
6 Stock holding days Inventory * 365 / cost of goods sold 80 78
Average inventory 708 659
Cost of goods sold 3235 3096
0.62
0.63
0.64
0.65
0.66
0.67
0.68
0.69
ASSETS TURNOVER RATIO
2020
2019
YEAR
TIMES
Interpretation:
Assets turnover ratio measure how effectively assets are being utilized to increase revenue. This
ratio is mostly used to compare different companies in same sector. From the above calculation it
can be interpreted that company has increased assets turnover ratio by 0.05 times from 2019 to
2020. Company can improve this ratio by increasing revenue, liquidate unnecessary assets,
optimum utilization of assets.
6 Stock holding days Inventory * 365 / cost of goods sold 80 78
Average inventory 708 659
Cost of goods sold 3235 3096
77
77.5
78
78.5
79
79.5
80
STOCK HOLDING PERIOD
2020
2019
YEAR
DAYS
Interpretation:
Stock holding day's ratio measure how frequently a company is utilizing its inventory available
at its disposal. This ratio also shows how many days’ cash is blocked in stock. As per the above
calculation stock holding period has increased by 2 days from 2019 to 2020. This can improve
more by proper analysing of requirement, attractive marketing, choose price smartly etc.
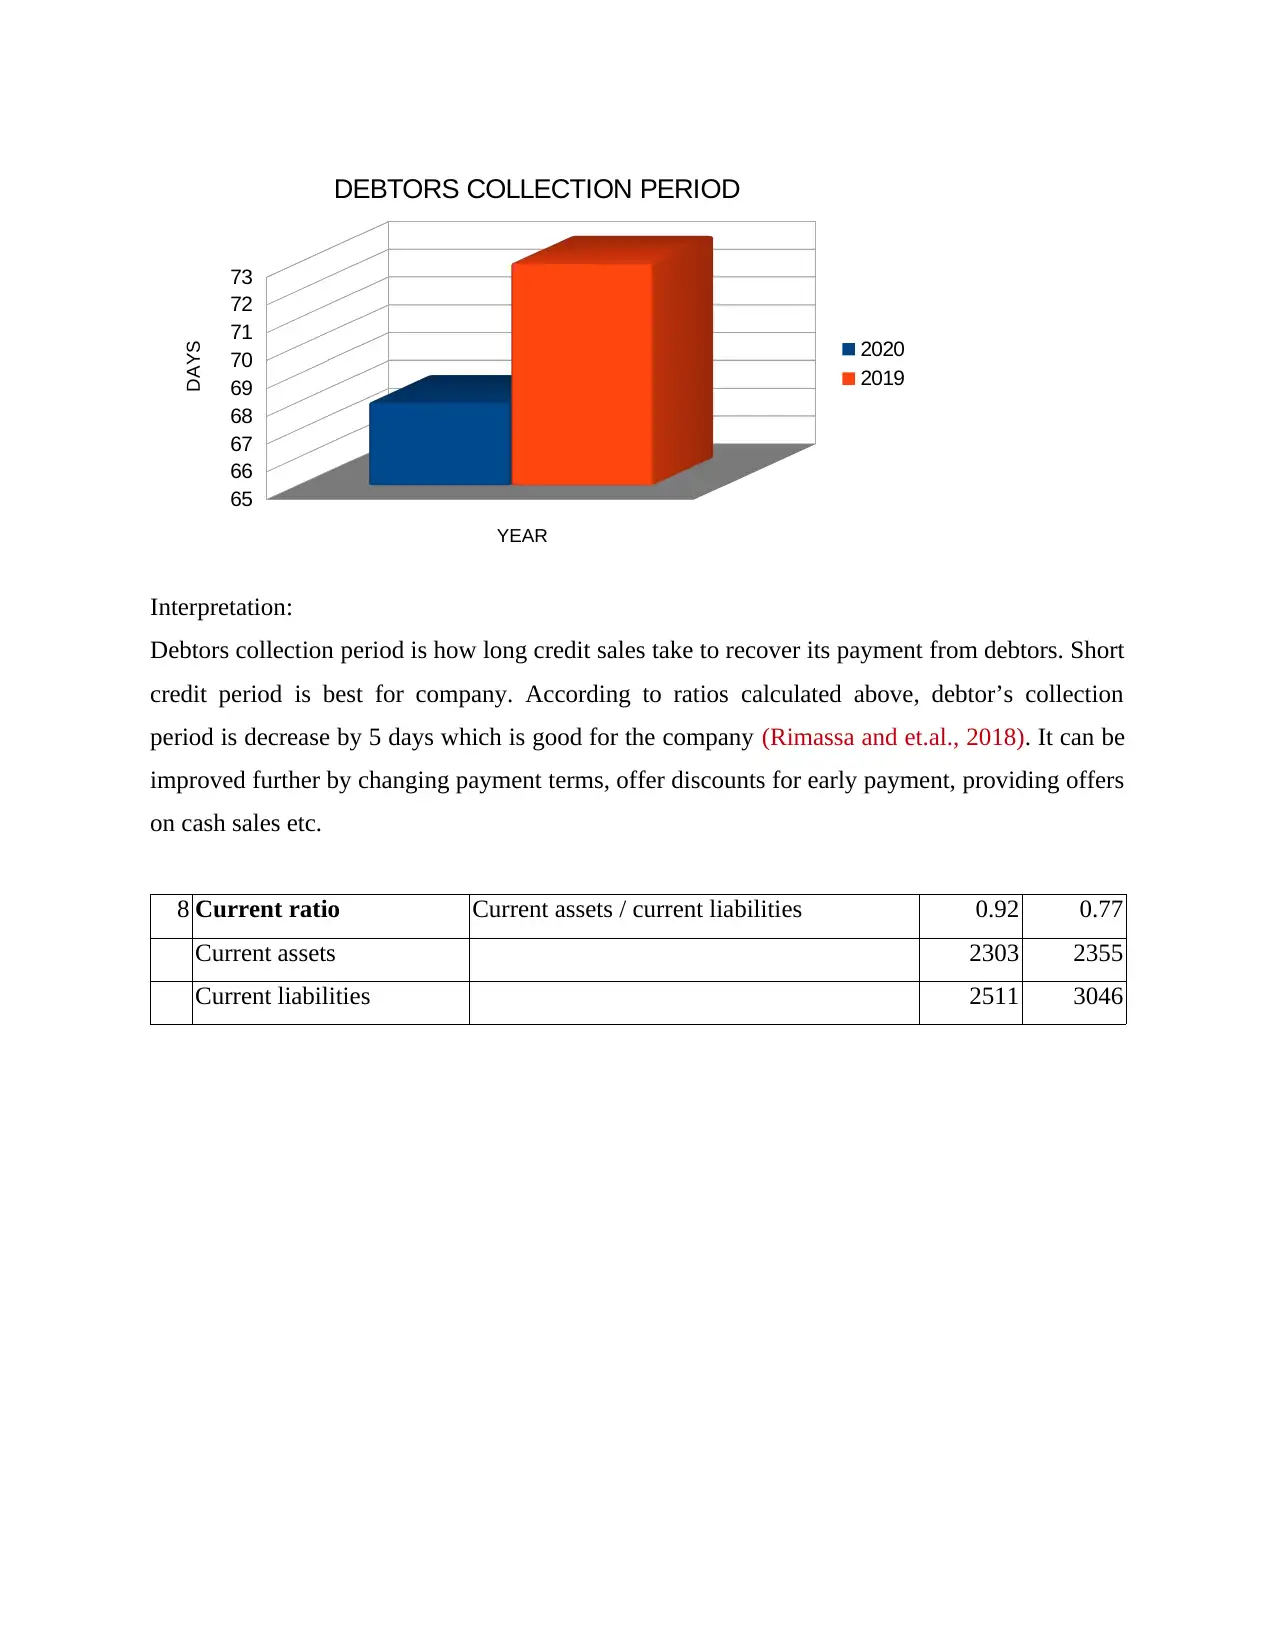
7 Debtors collection period Account receivable * 365 / annual credit sales 68 73
Average account receivable 1249 1287
Annual sales 6738 6441
77.5
78
78.5
79
79.5
80
STOCK HOLDING PERIOD
2020
2019
YEAR
DAYS
Interpretation:
Stock holding day's ratio measure how frequently a company is utilizing its inventory available
at its disposal. This ratio also shows how many days’ cash is blocked in stock. As per the above
calculation stock holding period has increased by 2 days from 2019 to 2020. This can improve
more by proper analysing of requirement, attractive marketing, choose price smartly etc.
7 Debtors collection period Account receivable * 365 / annual credit sales 68 73
Average account receivable 1249 1287
Annual sales 6738 6441
65
66
67
68
69
70
71
72
73
DEBTORS COLLECTION PERIOD
2020
2019
YEAR
DAYS
Interpretation:
Debtors collection period is how long credit sales take to recover its payment from debtors. Short
credit period is best for company. According to ratios calculated above, debtor’s collection
period is decrease by 5 days which is good for the company (Rimassa and et.al., 2018). It can be
improved further by changing payment terms, offer discounts for early payment, providing offers
on cash sales etc.
8 Current ratio Current assets / current liabilities 0.92 0.77
Current assets 2303 2355
Current liabilities 2511 3046
Paraphrase This Document
Need a fresh take? Get an instant paraphrase of this document with our AI Paraphraser

0.65
0.7
0.75
0.8
0.85
0.9
0.95
CURRENT RATIO
2020
2019
YEAR
TIMES
Interpretation:
Current ratio shows company liquidity which means, company has potential or enough current
assets to pay its short term liabilities. Current ratio should be greater than or equal to one. The
pictorial representation made above indicates that current ratio is improved by 0.15 from 2019 to
2020. This ratio can be further improved by paying short term obligation, reducing unproductive
assets, increasing short term assets, use cash in short term investment etc.
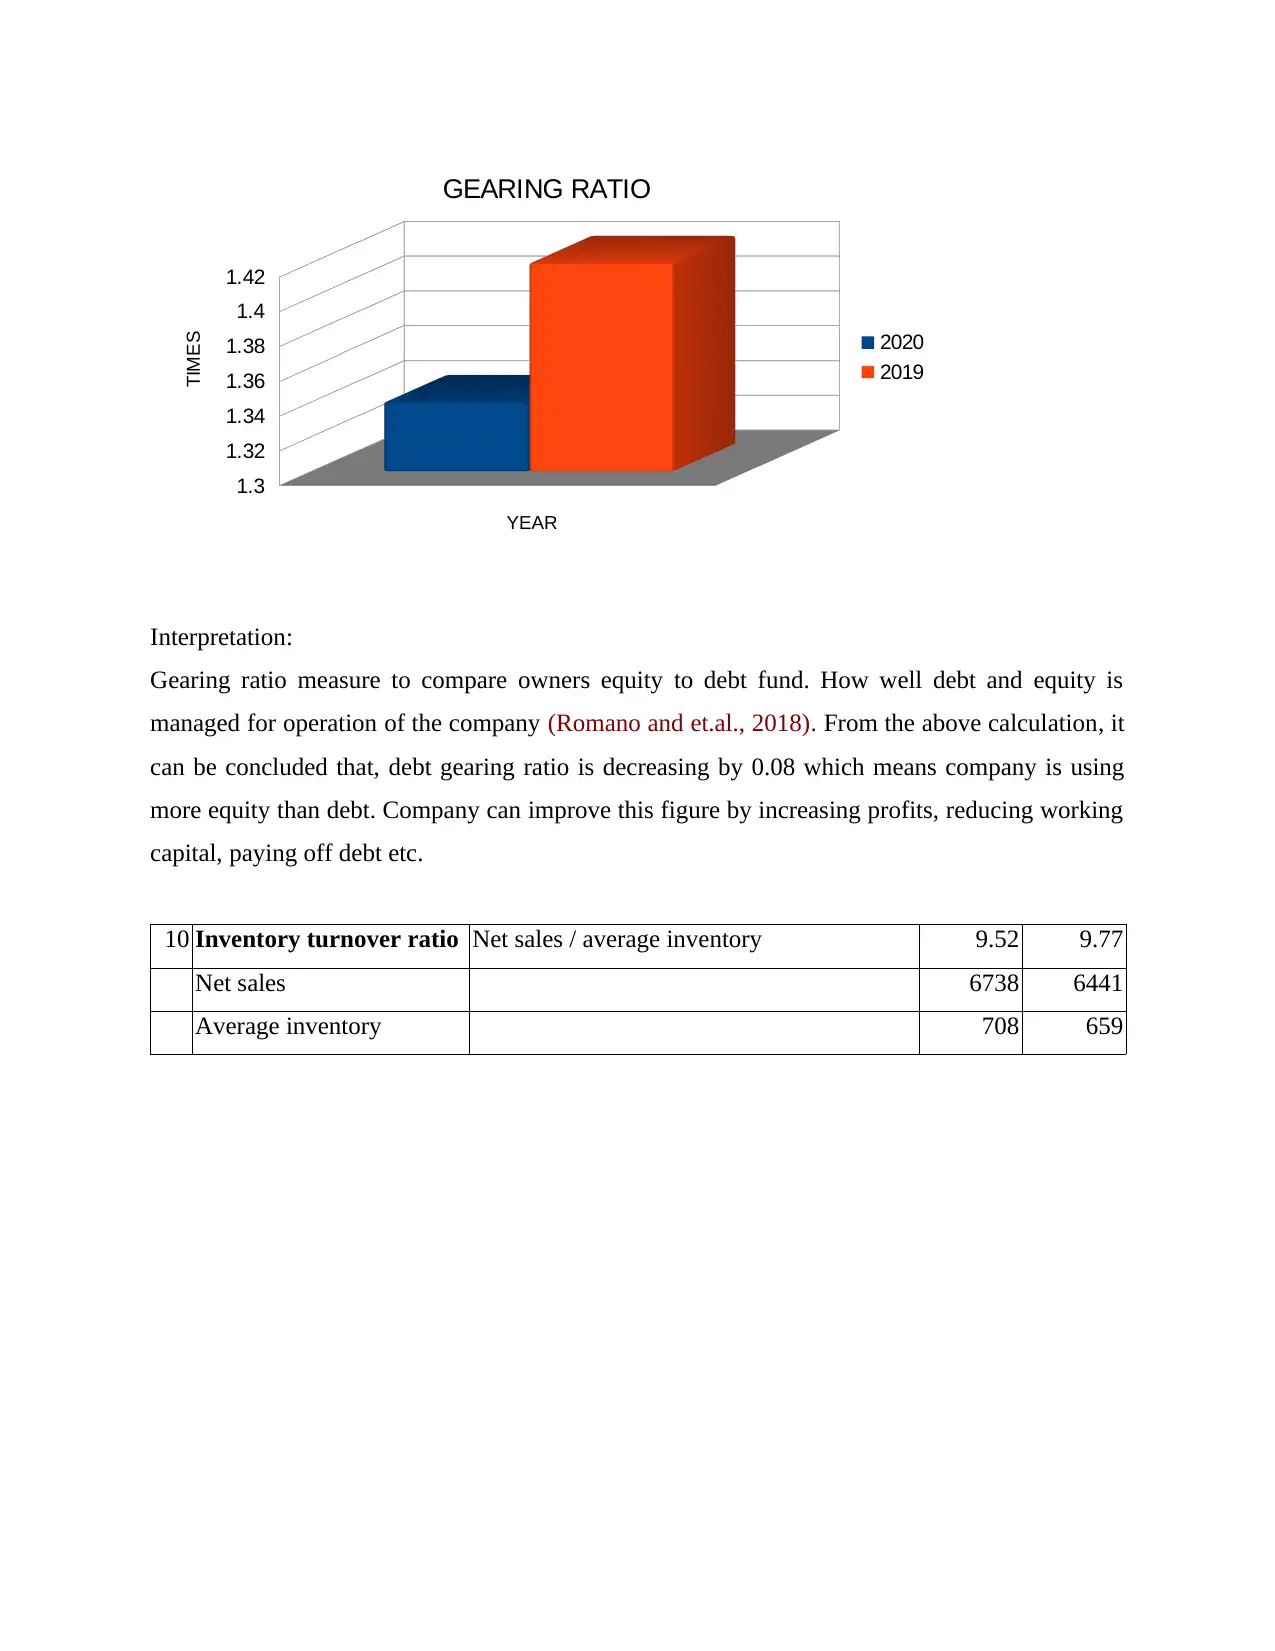
9 Gearing ratio Long term Debt / shareholder equity 1.34 1.42
Debt 4137 4129
equity 3088 2912
0.7
0.75
0.8
0.85
0.9
0.95
CURRENT RATIO
2020
2019
YEAR
TIMES
Interpretation:
Current ratio shows company liquidity which means, company has potential or enough current
assets to pay its short term liabilities. Current ratio should be greater than or equal to one. The
pictorial representation made above indicates that current ratio is improved by 0.15 from 2019 to
2020. This ratio can be further improved by paying short term obligation, reducing unproductive
assets, increasing short term assets, use cash in short term investment etc.
9 Gearing ratio Long term Debt / shareholder equity 1.34 1.42
Debt 4137 4129
equity 3088 2912
1.3
1.32
1.34
1.36
1.38
1.4
1.42
GEARING RATIO
2020
2019
YEAR
TIMES
Interpretation:
Gearing ratio measure to compare owners equity to debt fund. How well debt and equity is
managed for operation of the company (Romano and et.al., 2018). From the above calculation, it
can be concluded that, debt gearing ratio is decreasing by 0.08 which means company is using
more equity than debt. Company can improve this figure by increasing profits, reducing working
capital, paying off debt etc.
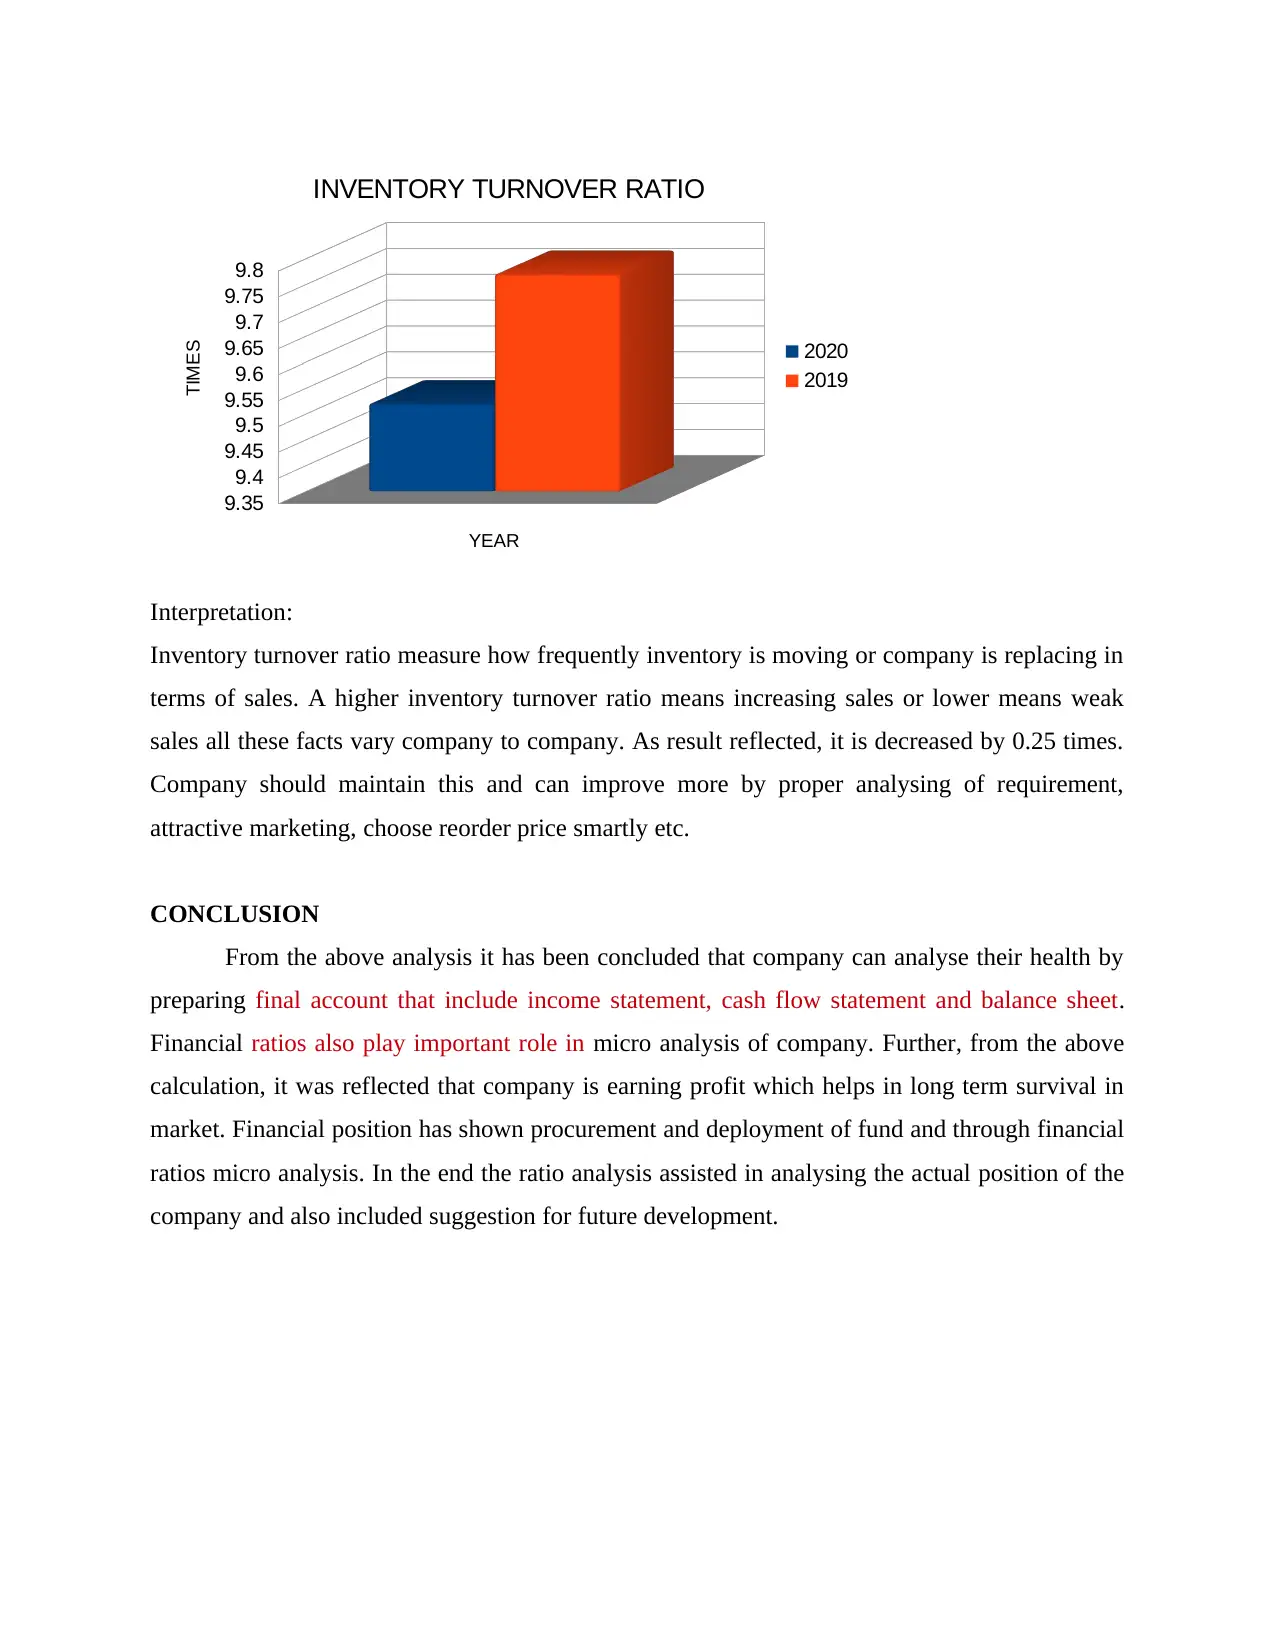
10 Inventory turnover ratio Net sales / average inventory 9.52 9.77
Net sales 6738 6441
Average inventory 708 659
1.32
1.34
1.36
1.38
1.4
1.42
GEARING RATIO
2020
2019
YEAR
TIMES
Interpretation:
Gearing ratio measure to compare owners equity to debt fund. How well debt and equity is
managed for operation of the company (Romano and et.al., 2018). From the above calculation, it
can be concluded that, debt gearing ratio is decreasing by 0.08 which means company is using
more equity than debt. Company can improve this figure by increasing profits, reducing working
capital, paying off debt etc.
10 Inventory turnover ratio Net sales / average inventory 9.52 9.77
Net sales 6738 6441
Average inventory 708 659
9.35
9.4
9.45
9.5
9.55
9.6
9.65
9.7
9.75
9.8
INVENTORY TURNOVER RATIO
2020
2019
YEAR
TIMES
Interpretation:
Inventory turnover ratio measure how frequently inventory is moving or company is replacing in
terms of sales. A higher inventory turnover ratio means increasing sales or lower means weak
sales all these facts vary company to company. As result reflected, it is decreased by 0.25 times.
Company should maintain this and can improve more by proper analysing of requirement,
attractive marketing, choose reorder price smartly etc.
CONCLUSION
From the above analysis it has been concluded that company can analyse their health by
preparing final account that include income statement, cash flow statement and balance sheet.
Financial ratios also play important role in micro analysis of company. Further, from the above
calculation, it was reflected that company is earning profit which helps in long term survival in
market. Financial position has shown procurement and deployment of fund and through financial
ratios micro analysis. In the end the ratio analysis assisted in analysing the actual position of the
company and also included suggestion for future development.
Secure Best Marks with AI Grader
Need help grading? Try our AI Grader for instant feedback on your assignments.
REFERENCES
Books and Journals
Felber, C., Campos, V. and Sanchis, J.R., 2019. The common good balance sheet, an adequate
tool to capture non-financials?. Sustainability. 11(14). p.3791.
Glover, D.R., 2017. Satellite radio communications fundamentals and link budgets. Handbook of
Satellite Applications, JN Pelton, S. Madry, and S. Camacho-Lara, ed. pp.293-324.
Huo, T. and et.al., 2018. China's energy consumption in the building sector: A Statistical
Yearbook-Energy Balance Sheet based splitting method. Journal of cleaner production.
185. pp.665-679.
Rimassa, L. and et.al., 2018. Tivantinib for second-line treatment of MET-high, advanced
hepatocellular carcinoma (METIV-HCC): a final analysis of a phase 3, randomised,
placebo-controlled study. The Lancet Oncology. 19(5). pp.682-693.
Romano, A. and et.al., 2018. Newly diagnosed hepatocellular carcinoma in patients with
advanced hepatitis C treated with DAAs: a prospective population study. Journal of
hepatology. 69(2). pp.345-352.
Song, D.W., Seo, Y.J. and Kwak, D.W., 2019. Learning from Hanjin Shipping’s failure: A
holistic interpretation on its causes and reasons. Transport Policy. 82. pp.77-87.
Sumner, D.A., 2018. New california milk marketing regulations will not change economic
fundamentals. Choices. 33(4). pp.1-6.
Wijaya, H. and Mauren, H.C., 2020. Factors Influencing Income Smoothing Practices With Firm
Size Moderation. Jurnal Akuntansi. 24(2). pp.250-265.
Witczak, R. and Zimny, A., 2021. The economic nature of deferred income and the accuracy of
the assessment of financial condition ratios. Zeszyty Teoretyczne Rachunkowości. (45
(1)). pp.155-172.
1 out of 17
Related Documents


Your All-in-One AI-Powered Toolkit for Academic Success.
+13062052269
info@desklib.com
Available 24*7 on WhatsApp / Email
![[object Object]](/_next/static/media/star-bottom.7253800d.svg)
Unlock your academic potential
© 2024 | Zucol Services PVT LTD | All rights reserved.