Accounting Information System: In-House vs. Outsourcing Report
VerifiedAdded on 2023/01/19
|6
|1015
|27
Report
AI Summary
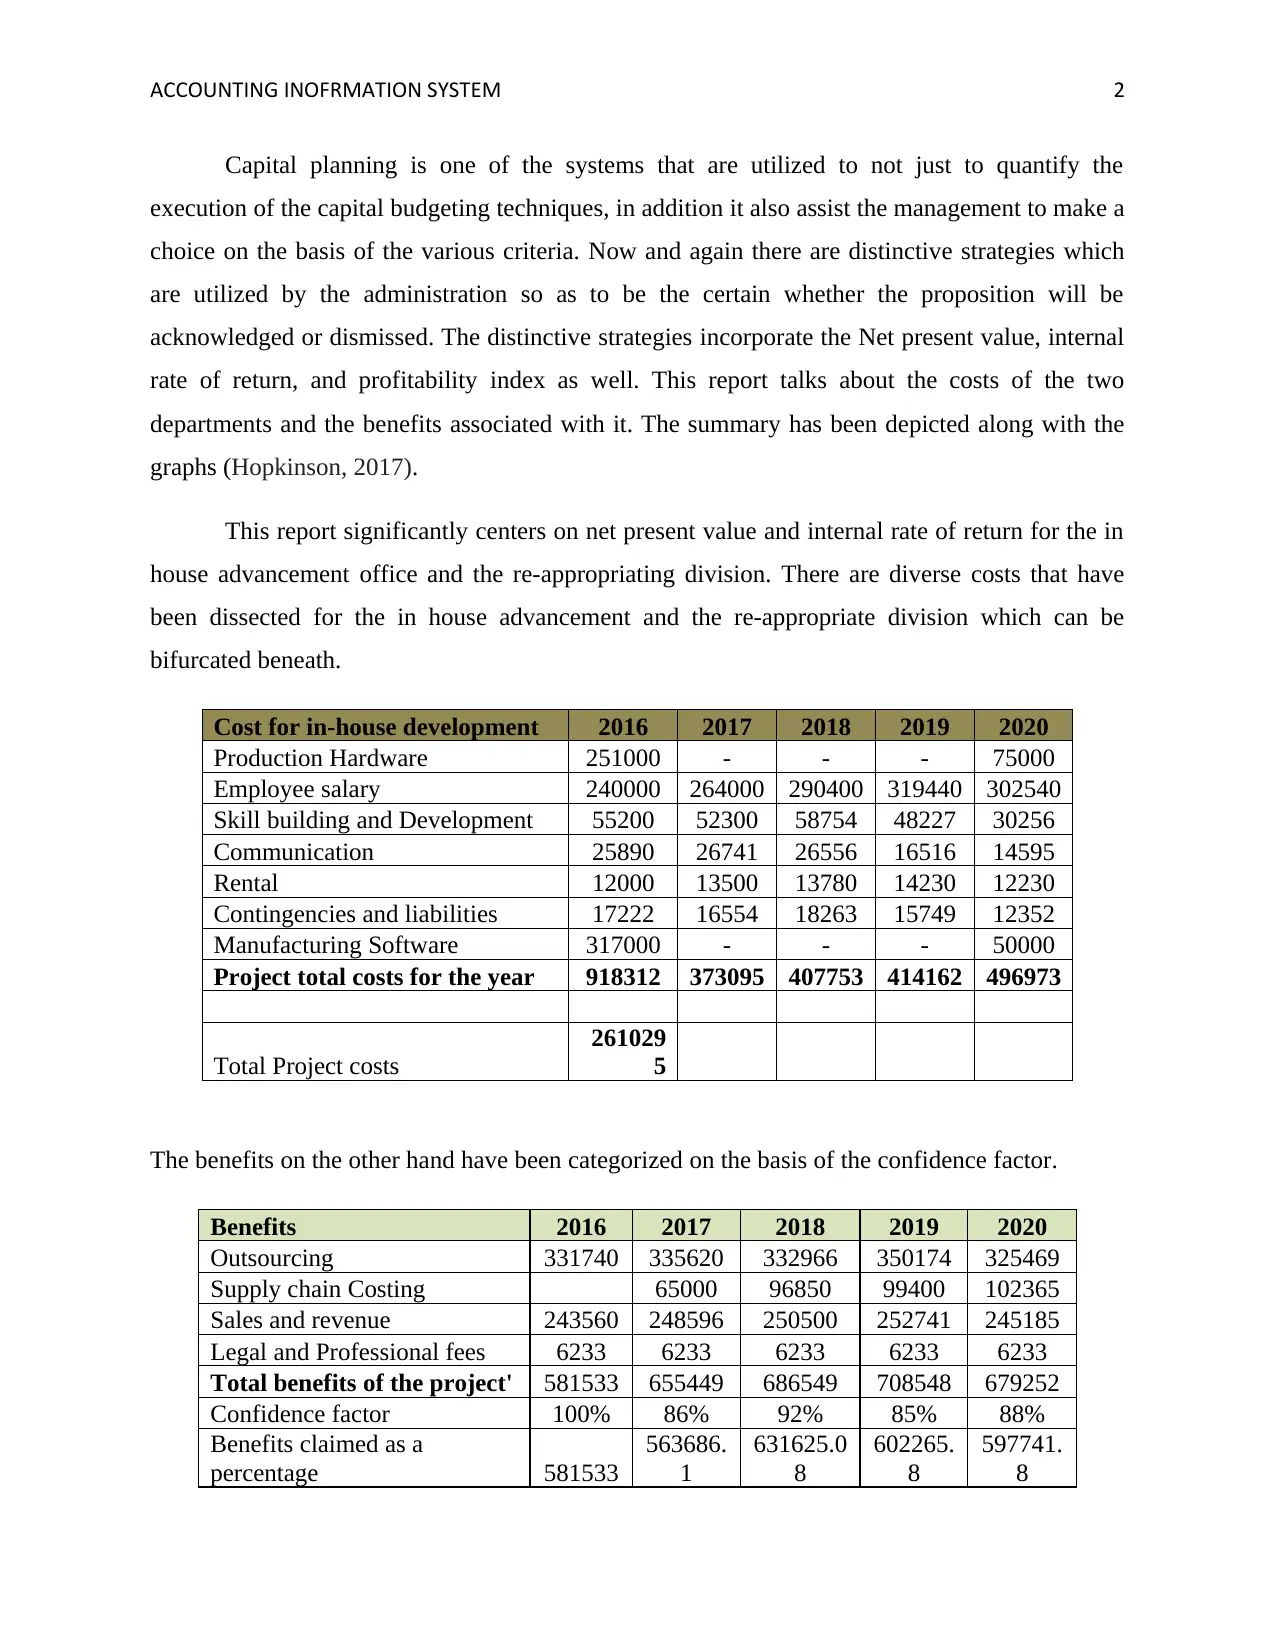
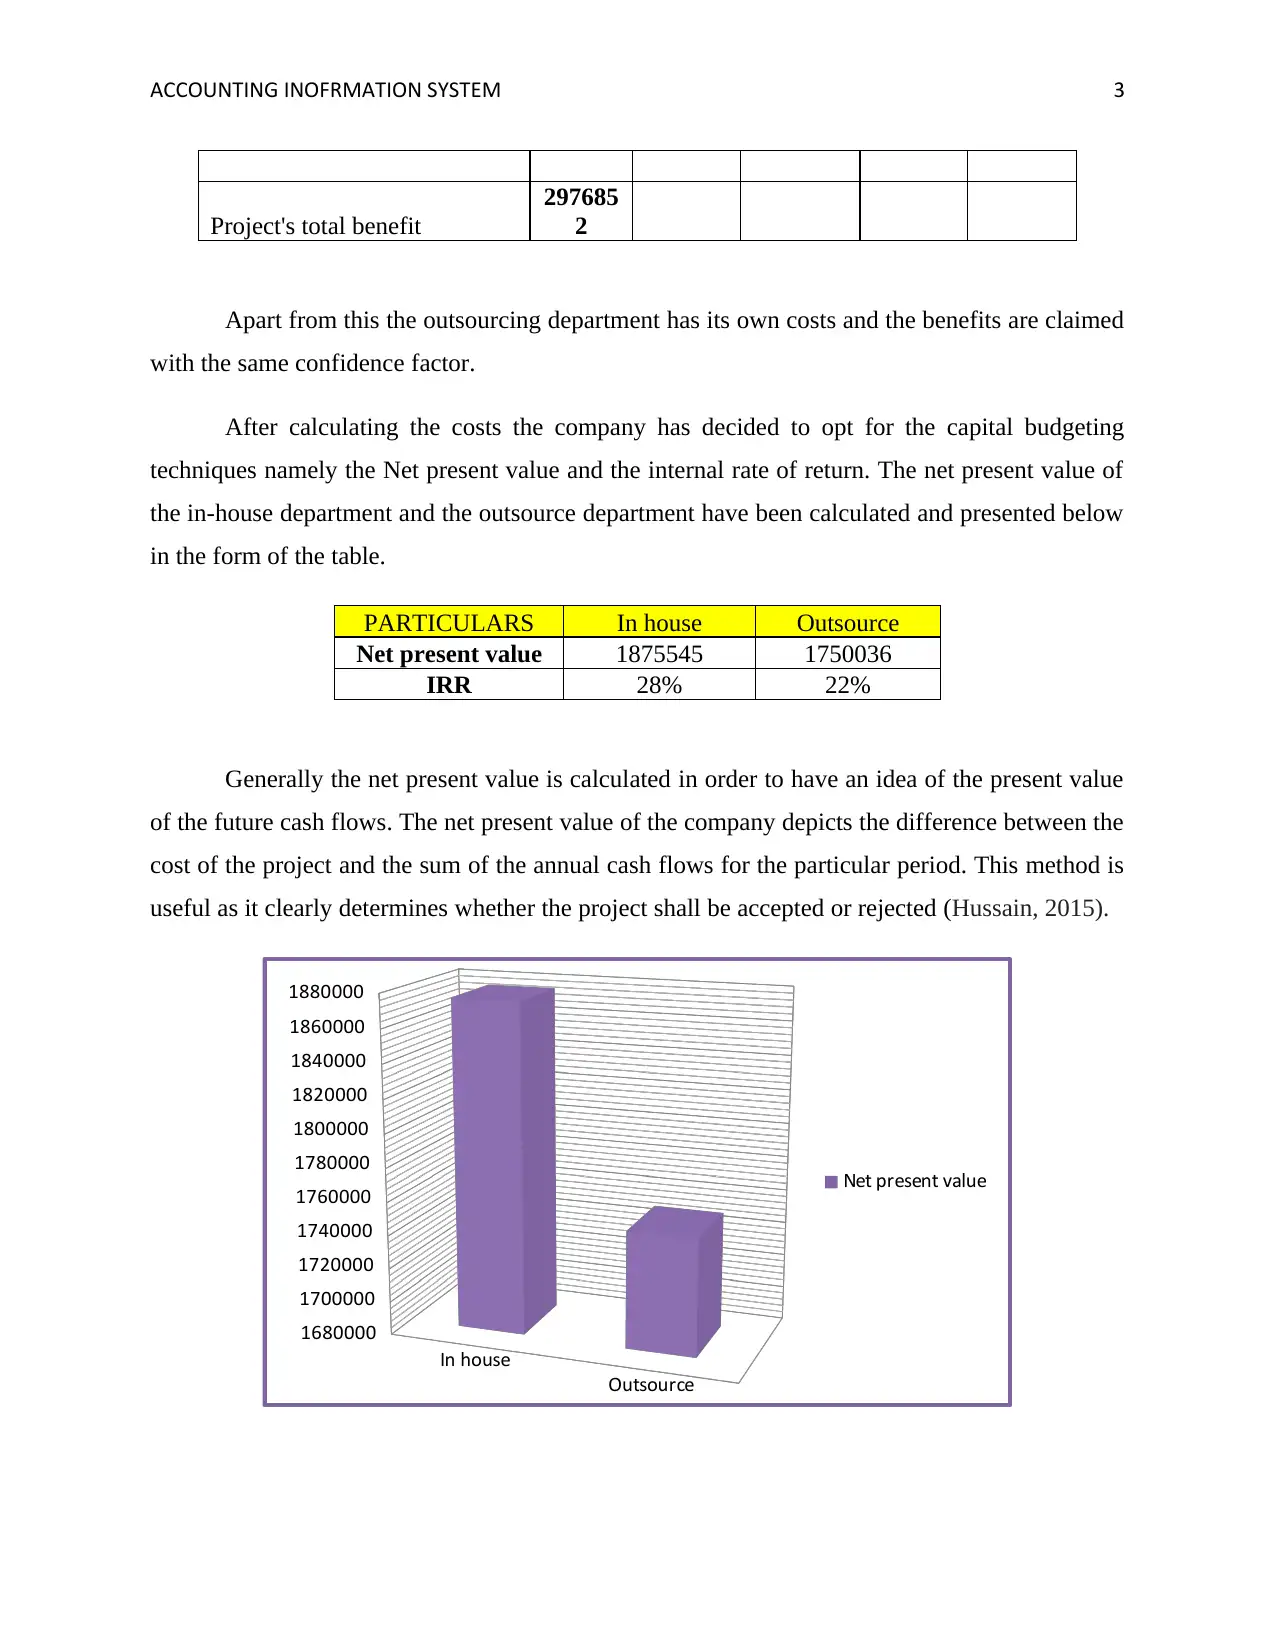
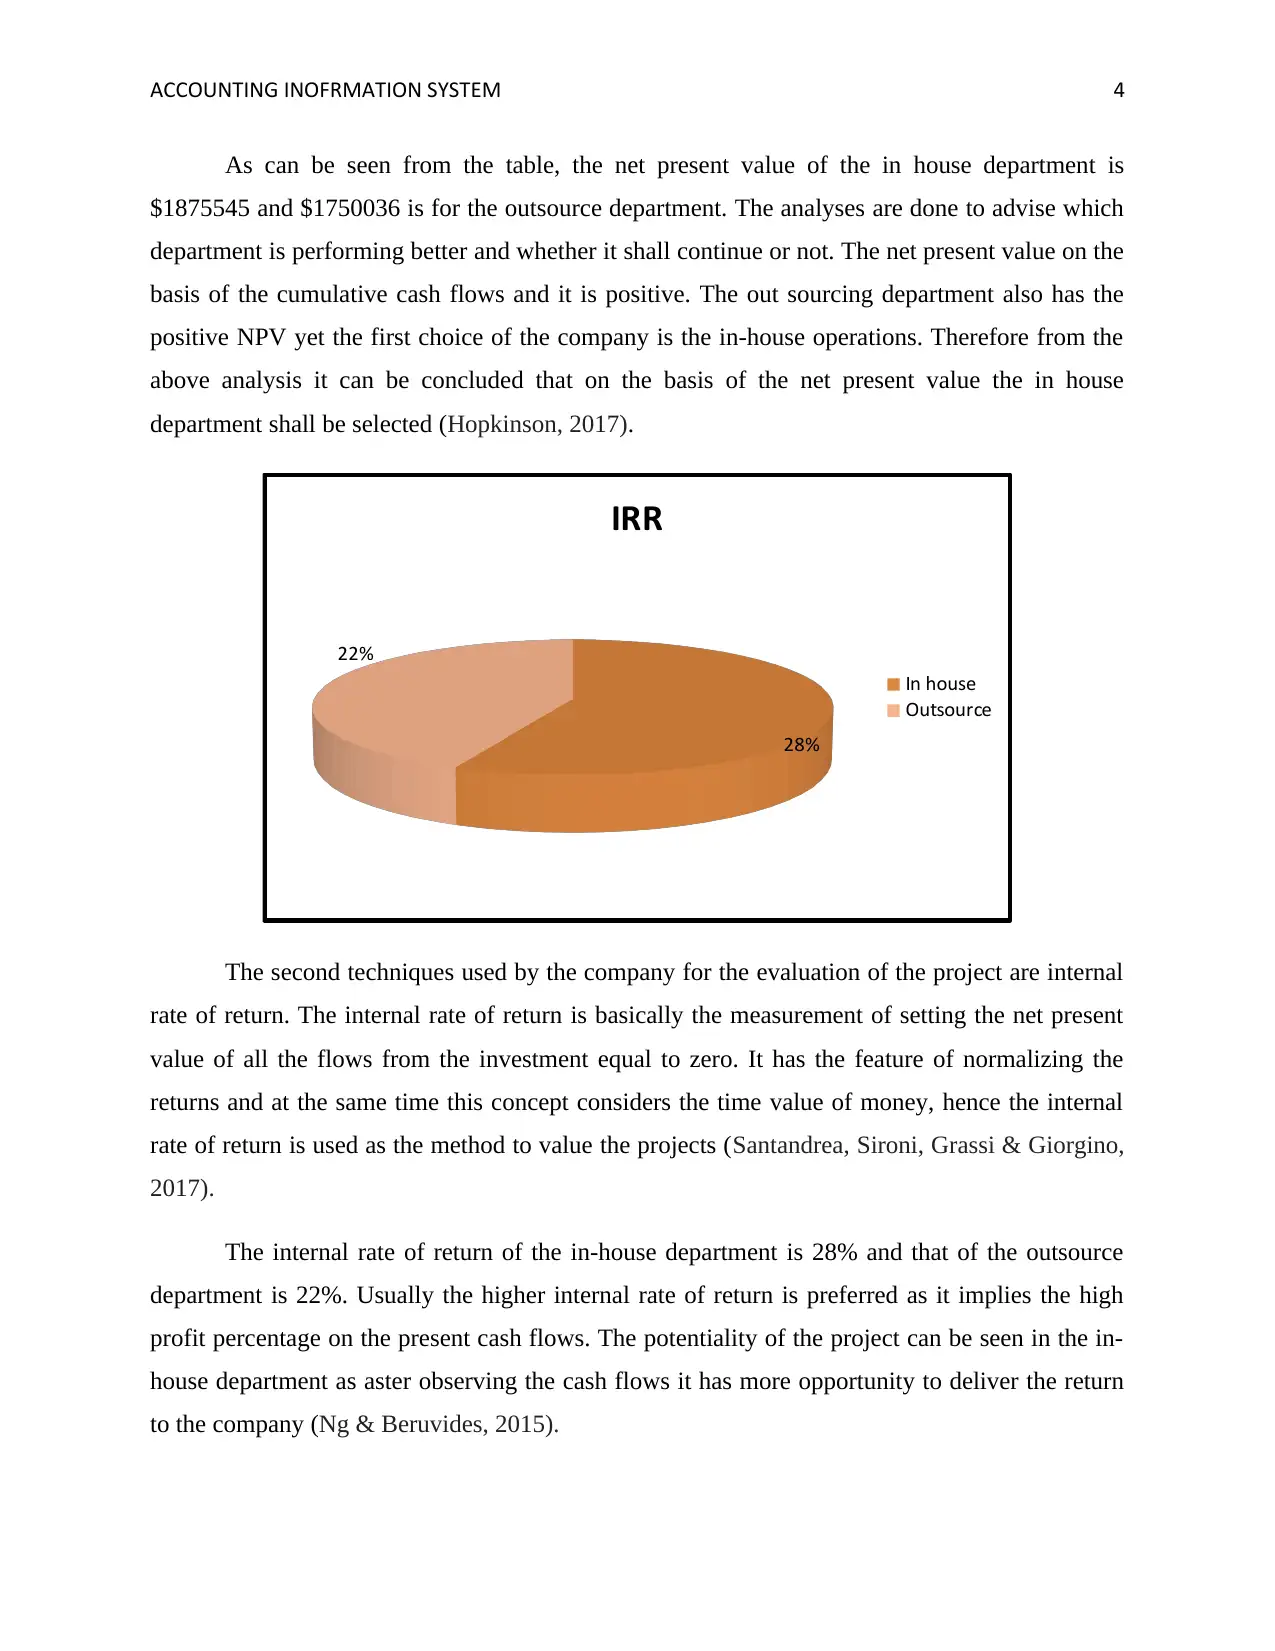
This report examines an Accounting Information System, focusing on capital planning and cost-benefit analysis for in-house development versus outsourcing. It utilizes Net Present Value (NPV) and Internal Rate of Return (IRR) to evaluate project profitability. The analysis includes detailed cost breakdowns for both in-house and outsourcing departments, incorporating factors like production, employee salaries, and software. The report calculates and compares the NPV and IRR for both options, ultimately recommending the in-house department based on its superior financial performance. The report also considers the benefits of each department, factoring in a confidence percentage for the claimed benefits. Through this comprehensive analysis, the report aims to guide management in making informed decisions regarding project selection and resource allocation, emphasizing the importance of financial metrics in the evaluation process.


1 out of 6
Related Documents


Your All-in-One AI-Powered Toolkit for Academic Success.
+13062052269
info@desklib.com
Available 24*7 on WhatsApp / Email
![[object Object]](/_next/static/media/star-bottom.7253800d.svg)
Copyright © 2020–2025 A2Z Services. All Rights Reserved. Developed and managed by ZUCOL.