Accounting Spreadsheet Solutions: Financial Analysis & Reporting
VerifiedAdded on 2023/06/13
|15
|3456
|477
Homework Assignment
AI Summary
This assignment provides various accounting spreadsheet solutions covering topics such as financial reporting, inventory management using FIFO and LIFO methods, bank reconciliation, and bad debt estimation. It includes examples of normal and formula views for different financial statements, illustrating how spreadsheets can be used for accounting functions. The assignment also discusses the advantages and disadvantages of using spreadsheets in accounting, highlighting their role in performing calculations and managing financial data. Journal entries, bank reconciliation statements, and comparative analyses of inventory costing methods are also presented, offering a comprehensive overview of spreadsheet applications in accounting and financial analysis.
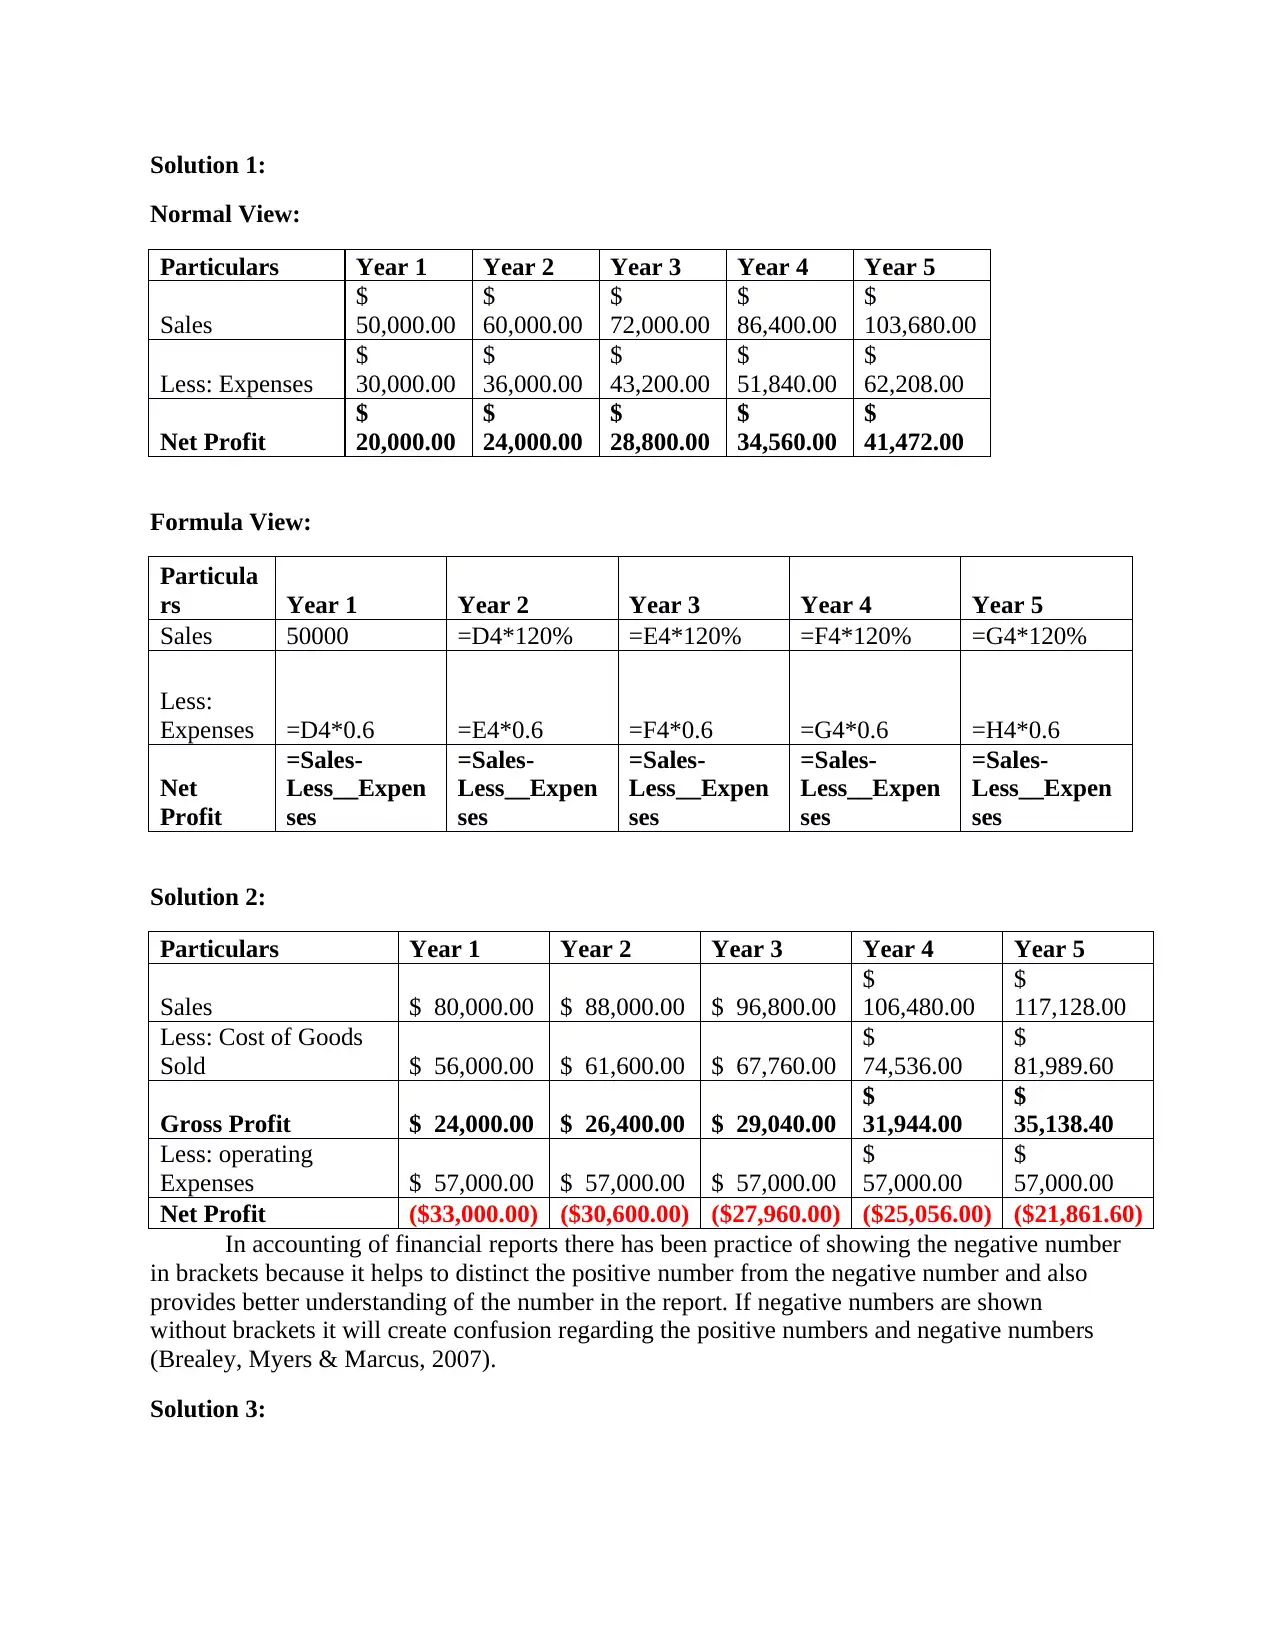
Solution 1:
Normal View:
Particulars Year 1 Year 2 Year 3 Year 4 Year 5
Sales
$
50,000.00
$
60,000.00
$
72,000.00
$
86,400.00
$
103,680.00
Less: Expenses
$
30,000.00
$
36,000.00
$
43,200.00
$
51,840.00
$
62,208.00
Net Profit
$
20,000.00
$
24,000.00
$
28,800.00
$
34,560.00
$
41,472.00
Formula View:
Particula
rs Year 1 Year 2 Year 3 Year 4 Year 5
Sales 50000 =D4*120% =E4*120% =F4*120% =G4*120%
Less:
Expenses =D4*0.6 =E4*0.6 =F4*0.6 =G4*0.6 =H4*0.6
Net
Profit
=Sales-
Less__Expen
ses
=Sales-
Less__Expen
ses
=Sales-
Less__Expen
ses
=Sales-
Less__Expen
ses
=Sales-
Less__Expen
ses
Solution 2:
Particulars Year 1 Year 2 Year 3 Year 4 Year 5
Sales $ 80,000.00 $ 88,000.00 $ 96,800.00
$
106,480.00
$
117,128.00
Less: Cost of Goods
Sold $ 56,000.00 $ 61,600.00 $ 67,760.00
$
74,536.00
$
81,989.60
Gross Profit $ 24,000.00 $ 26,400.00 $ 29,040.00
$
31,944.00
$
35,138.40
Less: operating
Expenses $ 57,000.00 $ 57,000.00 $ 57,000.00
$
57,000.00
$
57,000.00
Net Profit ($33,000.00) ($30,600.00) ($27,960.00) ($25,056.00) ($21,861.60)
In accounting of financial reports there has been practice of showing the negative number
in brackets because it helps to distinct the positive number from the negative number and also
provides better understanding of the number in the report. If negative numbers are shown
without brackets it will create confusion regarding the positive numbers and negative numbers
(Brealey, Myers & Marcus, 2007).
Solution 3:
Paraphrase This Document
Need a fresh take? Get an instant paraphrase of this document with our AI Paraphraser
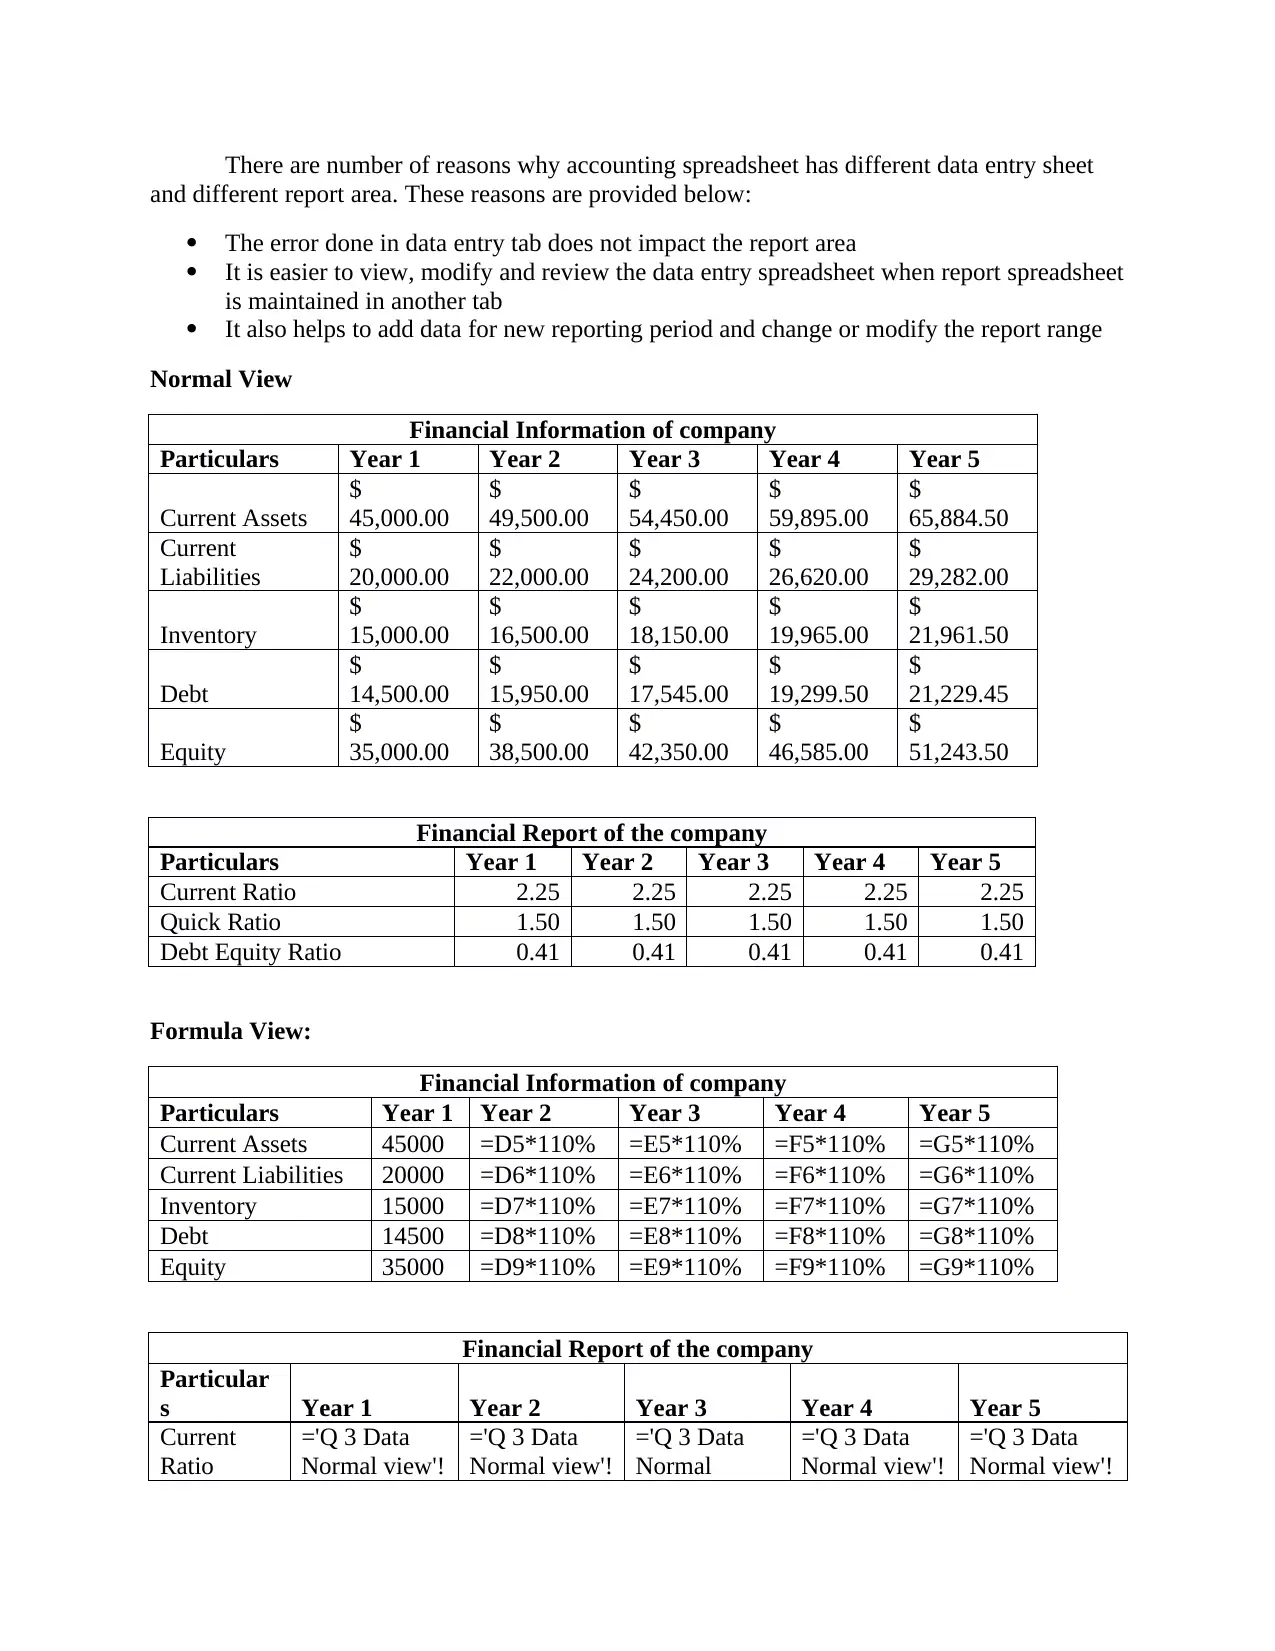
There are number of reasons why accounting spreadsheet has different data entry sheet
and different report area. These reasons are provided below:
The error done in data entry tab does not impact the report area
It is easier to view, modify and review the data entry spreadsheet when report spreadsheet
is maintained in another tab
It also helps to add data for new reporting period and change or modify the report range
Normal View
Financial Information of company
Particulars Year 1 Year 2 Year 3 Year 4 Year 5
Current Assets
$
45,000.00
$
49,500.00
$
54,450.00
$
59,895.00
$
65,884.50
Current
Liabilities
$
20,000.00
$
22,000.00
$
24,200.00
$
26,620.00
$
29,282.00
Inventory
$
15,000.00
$
16,500.00
$
18,150.00
$
19,965.00
$
21,961.50
Debt
$
14,500.00
$
15,950.00
$
17,545.00
$
19,299.50
$
21,229.45
Equity
$
35,000.00
$
38,500.00
$
42,350.00
$
46,585.00
$
51,243.50
Financial Report of the company
Particulars Year 1 Year 2 Year 3 Year 4 Year 5
Current Ratio 2.25 2.25 2.25 2.25 2.25
Quick Ratio 1.50 1.50 1.50 1.50 1.50
Debt Equity Ratio 0.41 0.41 0.41 0.41 0.41
Formula View:
Financial Information of company
Particulars Year 1 Year 2 Year 3 Year 4 Year 5
Current Assets 45000 =D5*110% =E5*110% =F5*110% =G5*110%
Current Liabilities 20000 =D6*110% =E6*110% =F6*110% =G6*110%
Inventory 15000 =D7*110% =E7*110% =F7*110% =G7*110%
Debt 14500 =D8*110% =E8*110% =F8*110% =G8*110%
Equity 35000 =D9*110% =E9*110% =F9*110% =G9*110%
Financial Report of the company
Particular
s Year 1 Year 2 Year 3 Year 4 Year 5
Current
Ratio
='Q 3 Data
Normal view'!
='Q 3 Data
Normal view'!
='Q 3 Data
Normal
='Q 3 Data
Normal view'!
='Q 3 Data
Normal view'!
D5/'Q 3 Data
Normal view'!
D6
E5/'Q 3 Data
Normal view'!
E6
view'!F5/'Q 3
Data Normal
view'!F6
G5/'Q 3 Data
Normal view'!
G6
H5/'Q 3 Data
Normal view'!
H6
Quick
Ratio
=('Q 3 Data
Normal view'!
D5-'Q 3 Data
Normal view'!
D7)/'Q 3 Data
Normal view'!
D6
=('Q 3 Data
Normal view'!
E5-'Q 3 Data
Normal view'!
E7)/'Q 3 Data
Normal view'!
E6
=('Q 3 Data
Normal
view'!F5-'Q 3
Data Normal
view'!F7)/'Q
3 Data
Normal
view'!F6
=('Q 3 Data
Normal view'!
G5-'Q 3 Data
Normal view'!
G7)/'Q 3 Data
Normal view'!
G6
=('Q 3 Data
Normal view'!
H5-'Q 3 Data
Normal view'!
H7)/'Q 3 Data
Normal view'!
H6
Debt
Equity
Ratio
='Q 3 Data
Normal view'!
D8/'Q 3 Data
Normal view'!
D9
='Q 3 Data
Normal view'!
E8/'Q 3 Data
Normal view'!
E9
='Q 3 Data
Normal
view'!F8/'Q 3
Data Normal
view'!F9
='Q 3 Data
Normal view'!
G8/'Q 3 Data
Normal view'!
G9
='Q 3 Data
Normal view'!
H8/'Q 3 Data
Normal view'!
H9
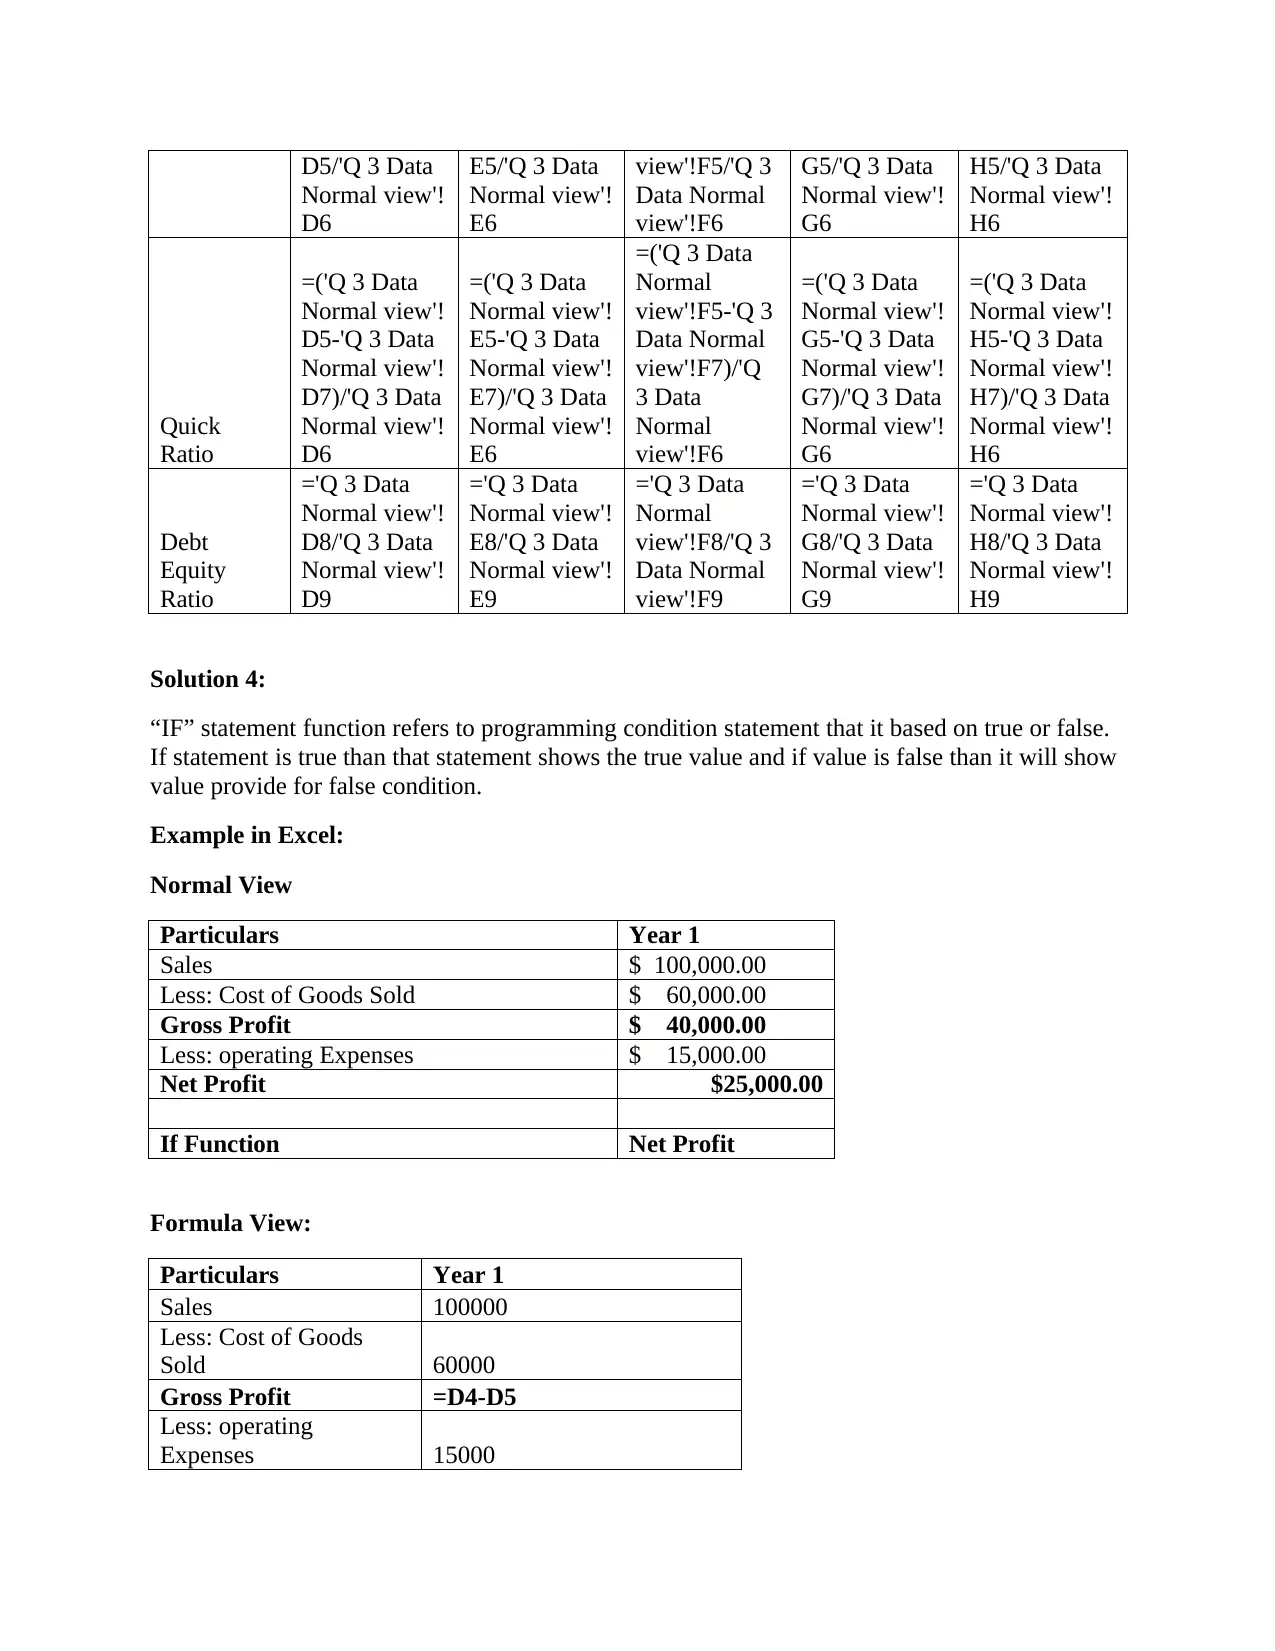
Solution 4:
“IF” statement function refers to programming condition statement that it based on true or false.
If statement is true than that statement shows the true value and if value is false than it will show
value provide for false condition.
Example in Excel:
Normal View
Particulars Year 1
Sales $ 100,000.00
Less: Cost of Goods Sold $ 60,000.00
Gross Profit $ 40,000.00
Less: operating Expenses $ 15,000.00
Net Profit $25,000.00
If Function Net Profit
Formula View:
Particulars Year 1
Sales 100000
Less: Cost of Goods
Sold 60000
Gross Profit =D4-D5
Less: operating
Expenses 15000
Normal view'!
D6
E5/'Q 3 Data
Normal view'!
E6
view'!F5/'Q 3
Data Normal
view'!F6
G5/'Q 3 Data
Normal view'!
G6
H5/'Q 3 Data
Normal view'!
H6
Quick
Ratio
=('Q 3 Data
Normal view'!
D5-'Q 3 Data
Normal view'!
D7)/'Q 3 Data
Normal view'!
D6
=('Q 3 Data
Normal view'!
E5-'Q 3 Data
Normal view'!
E7)/'Q 3 Data
Normal view'!
E6
=('Q 3 Data
Normal
view'!F5-'Q 3
Data Normal
view'!F7)/'Q
3 Data
Normal
view'!F6
=('Q 3 Data
Normal view'!
G5-'Q 3 Data
Normal view'!
G7)/'Q 3 Data
Normal view'!
G6
=('Q 3 Data
Normal view'!
H5-'Q 3 Data
Normal view'!
H7)/'Q 3 Data
Normal view'!
H6
Debt
Equity
Ratio
='Q 3 Data
Normal view'!
D8/'Q 3 Data
Normal view'!
D9
='Q 3 Data
Normal view'!
E8/'Q 3 Data
Normal view'!
E9
='Q 3 Data
Normal
view'!F8/'Q 3
Data Normal
view'!F9
='Q 3 Data
Normal view'!
G8/'Q 3 Data
Normal view'!
G9
='Q 3 Data
Normal view'!
H8/'Q 3 Data
Normal view'!
H9
Solution 4:
“IF” statement function refers to programming condition statement that it based on true or false.
If statement is true than that statement shows the true value and if value is false than it will show
value provide for false condition.
Example in Excel:
Normal View
Particulars Year 1
Sales $ 100,000.00
Less: Cost of Goods Sold $ 60,000.00
Gross Profit $ 40,000.00
Less: operating Expenses $ 15,000.00
Net Profit $25,000.00
If Function Net Profit
Formula View:
Particulars Year 1
Sales 100000
Less: Cost of Goods
Sold 60000
Gross Profit =D4-D5
Less: operating
Expenses 15000
⊘ This is a preview!⊘
Do you want full access?
Subscribe today to unlock all pages.
Trusted by 1+ million students worldwide
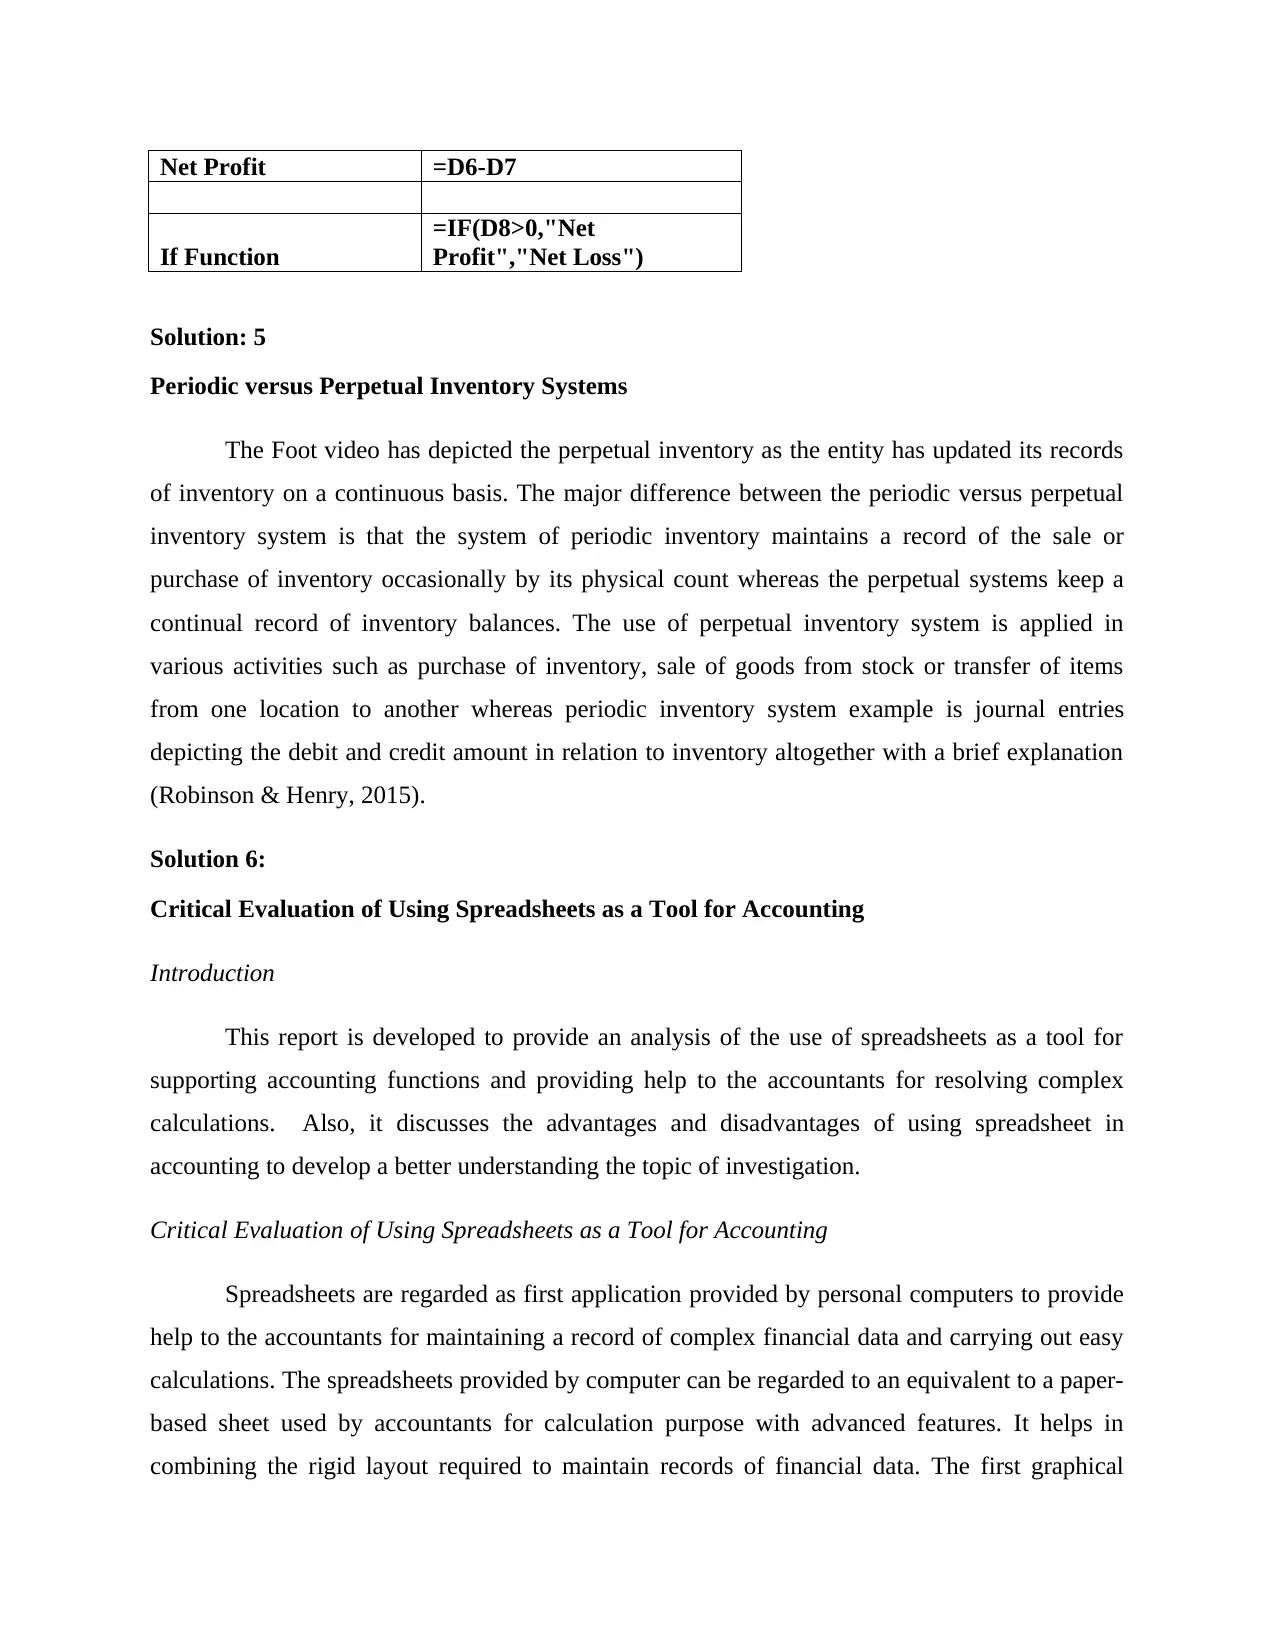
Net Profit =D6-D7
If Function
=IF(D8>0,"Net
Profit","Net Loss")
Solution: 5
Periodic versus Perpetual Inventory Systems
The Foot video has depicted the perpetual inventory as the entity has updated its records
of inventory on a continuous basis. The major difference between the periodic versus perpetual
inventory system is that the system of periodic inventory maintains a record of the sale or
purchase of inventory occasionally by its physical count whereas the perpetual systems keep a
continual record of inventory balances. The use of perpetual inventory system is applied in
various activities such as purchase of inventory, sale of goods from stock or transfer of items
from one location to another whereas periodic inventory system example is journal entries
depicting the debit and credit amount in relation to inventory altogether with a brief explanation
(Robinson & Henry, 2015).
Solution 6:
Critical Evaluation of Using Spreadsheets as a Tool for Accounting
Introduction
This report is developed to provide an analysis of the use of spreadsheets as a tool for
supporting accounting functions and providing help to the accountants for resolving complex
calculations. Also, it discusses the advantages and disadvantages of using spreadsheet in
accounting to develop a better understanding the topic of investigation.
Critical Evaluation of Using Spreadsheets as a Tool for Accounting
Spreadsheets are regarded as first application provided by personal computers to provide
help to the accountants for maintaining a record of complex financial data and carrying out easy
calculations. The spreadsheets provided by computer can be regarded to an equivalent to a paper-
based sheet used by accountants for calculation purpose with advanced features. It helps in
combining the rigid layout required to maintain records of financial data. The first graphical
Paraphrase This Document
Need a fresh take? Get an instant paraphrase of this document with our AI Paraphraser
interface, known as modern spreadsheet was developed by Microsoft. The electronic spreadsheet
provided by the computers facilitated accountants to a large extent by providing them a platform
to perform calculations quickly and easily (Wahlen et al., 2017). The accountants at present are
incorporating the use of computer based spreadsheets largely to increase the productivity of
businesses by managing the complex financial data adequately leading to faster decision-making
(McWatters and Zimmerman, 2015). The advantages and disadvantages of spreadsheets use as a
tool for accounting can be discussed as follows:
Advantages
It enables in performing easy calculations by displaying numbers and formulas. The
different type of function provided by spreadsheets are auto sum, multiplication, dividing,
subtracting and other large variety of operations that can be used for better control of accounting
data and analysis. Also, the grid representing of the cells in the spreadsheet can be made in hide
or visible mode as per the requirement and format of the spreadsheet. It also eliminated the
requirements of using complex calculators to perform the accounting operations and thereby
reduces the administrative costs. These can also be used to automate the database by better
manipulation and interpretation of financial information provided in the spreadsheet (Carlberg,
2007).
Disadvantages
The major drawback of spreadsheets is that it causes deskilling as accountants need no
longer to use their mental capabilities for analyzing the accounting data that can be easily
performed with the use of electronic spreadsheet. Also, it negatively impacts the coordination
and interaction among the colleagues as they can individually perform the data analysis through
its use without requiring any external assistance. It also led to duplication of data and its
structure increase the need of storage. However, the integration of graphic and other word
processing features into the spreadsheet ahs improved its analysis function as it is much easier to
understand the information presented with the use of figures (Blackwood, 2014).
Solution 7:
Report
Ending Inventory on October 31
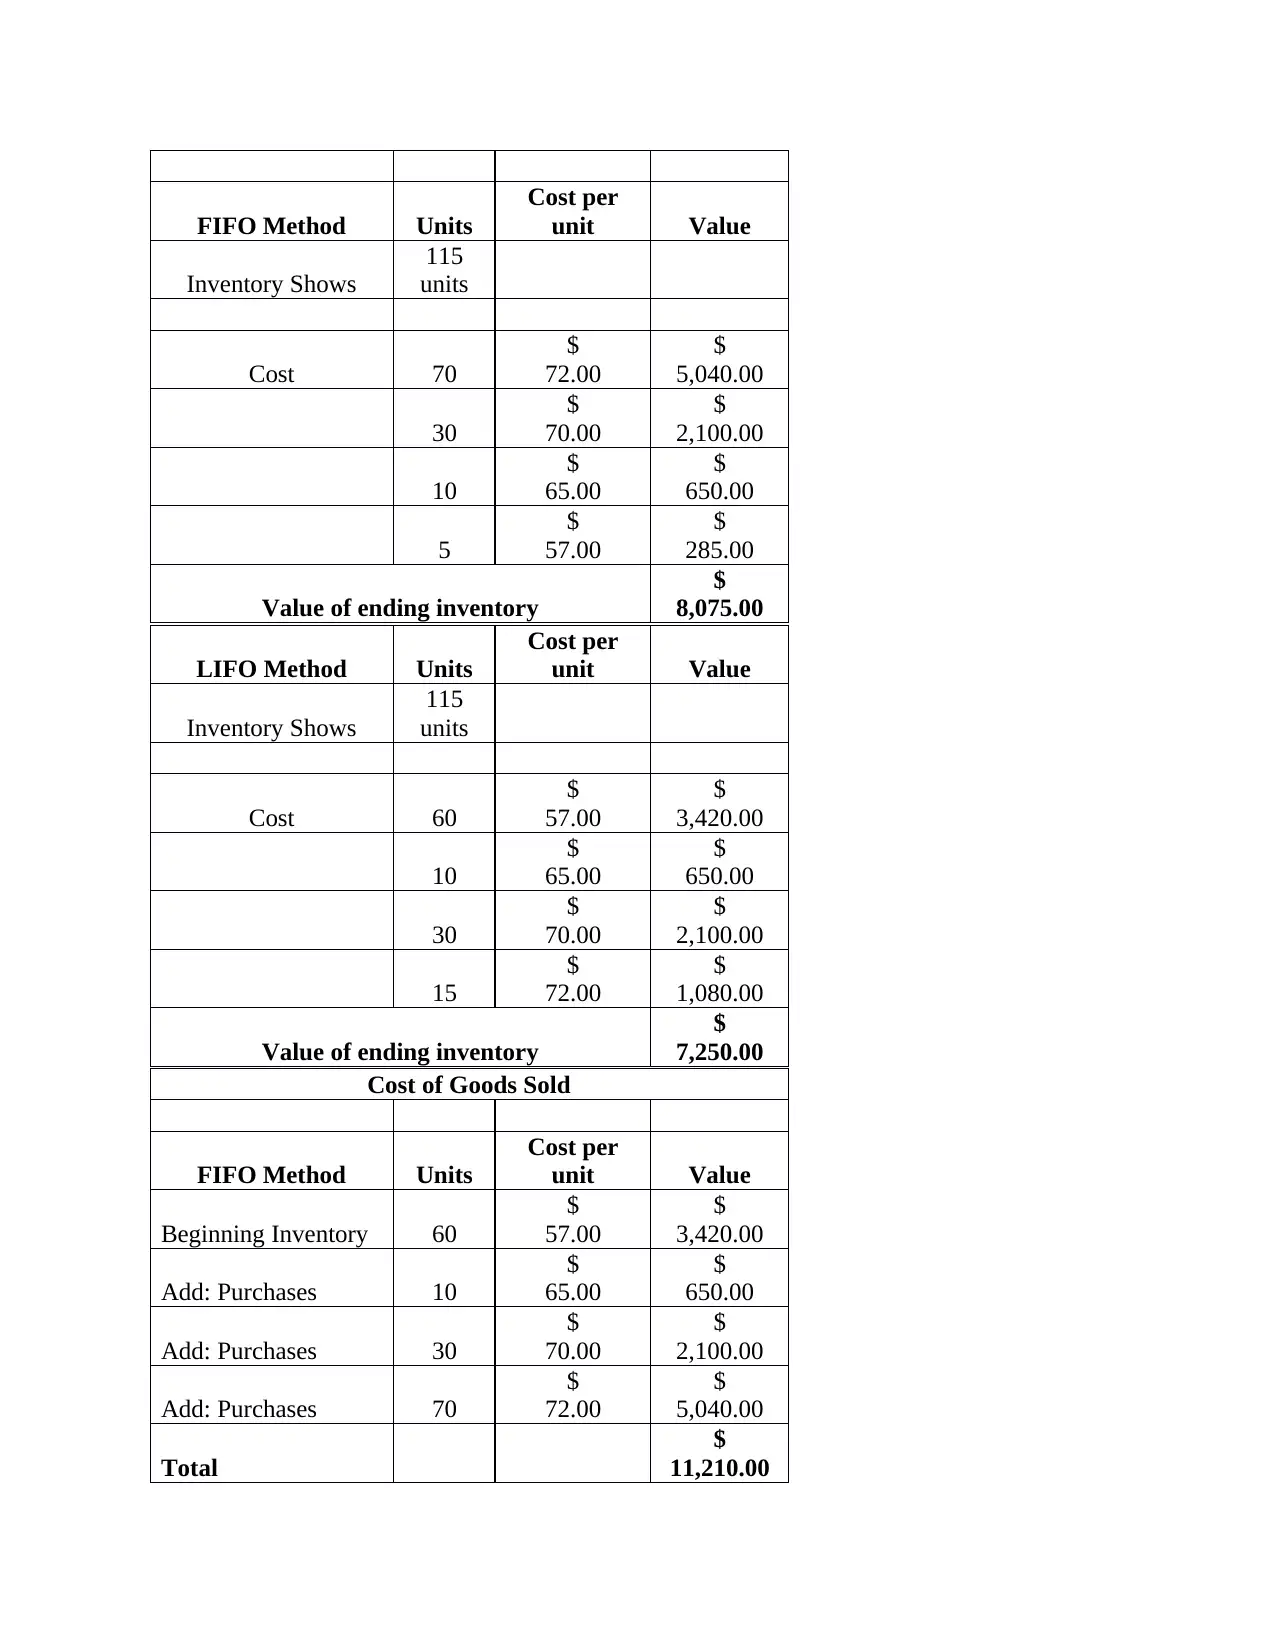
FIFO Method Units
Cost per
unit Value
Inventory Shows
115
units
Cost 70
$
72.00
$
5,040.00
30
$
70.00
$
2,100.00
10
$
65.00
$
650.00
5
$
57.00
$
285.00
Value of ending inventory
$
8,075.00
LIFO Method Units
Cost per
unit Value
Inventory Shows
115
units
Cost 60
$
57.00
$
3,420.00
10
$
65.00
$
650.00
30
$
70.00
$
2,100.00
15
$
72.00
$
1,080.00
Value of ending inventory
$
7,250.00
Cost of Goods Sold
FIFO Method Units
Cost per
unit Value
Beginning Inventory 60
$
57.00
$
3,420.00
Add: Purchases 10
$
65.00
$
650.00
Add: Purchases 30
$
70.00
$
2,100.00
Add: Purchases 70
$
72.00
$
5,040.00
Total
$
11,210.00
Cost per
unit Value
Inventory Shows
115
units
Cost 70
$
72.00
$
5,040.00
30
$
70.00
$
2,100.00
10
$
65.00
$
650.00
5
$
57.00
$
285.00
Value of ending inventory
$
8,075.00
LIFO Method Units
Cost per
unit Value
Inventory Shows
115
units
Cost 60
$
57.00
$
3,420.00
10
$
65.00
$
650.00
30
$
70.00
$
2,100.00
15
$
72.00
$
1,080.00
Value of ending inventory
$
7,250.00
Cost of Goods Sold
FIFO Method Units
Cost per
unit Value
Beginning Inventory 60
$
57.00
$
3,420.00
Add: Purchases 10
$
65.00
$
650.00
Add: Purchases 30
$
70.00
$
2,100.00
Add: Purchases 70
$
72.00
$
5,040.00
Total
$
11,210.00
⊘ This is a preview!⊘
Do you want full access?
Subscribe today to unlock all pages.
Trusted by 1+ million students worldwide
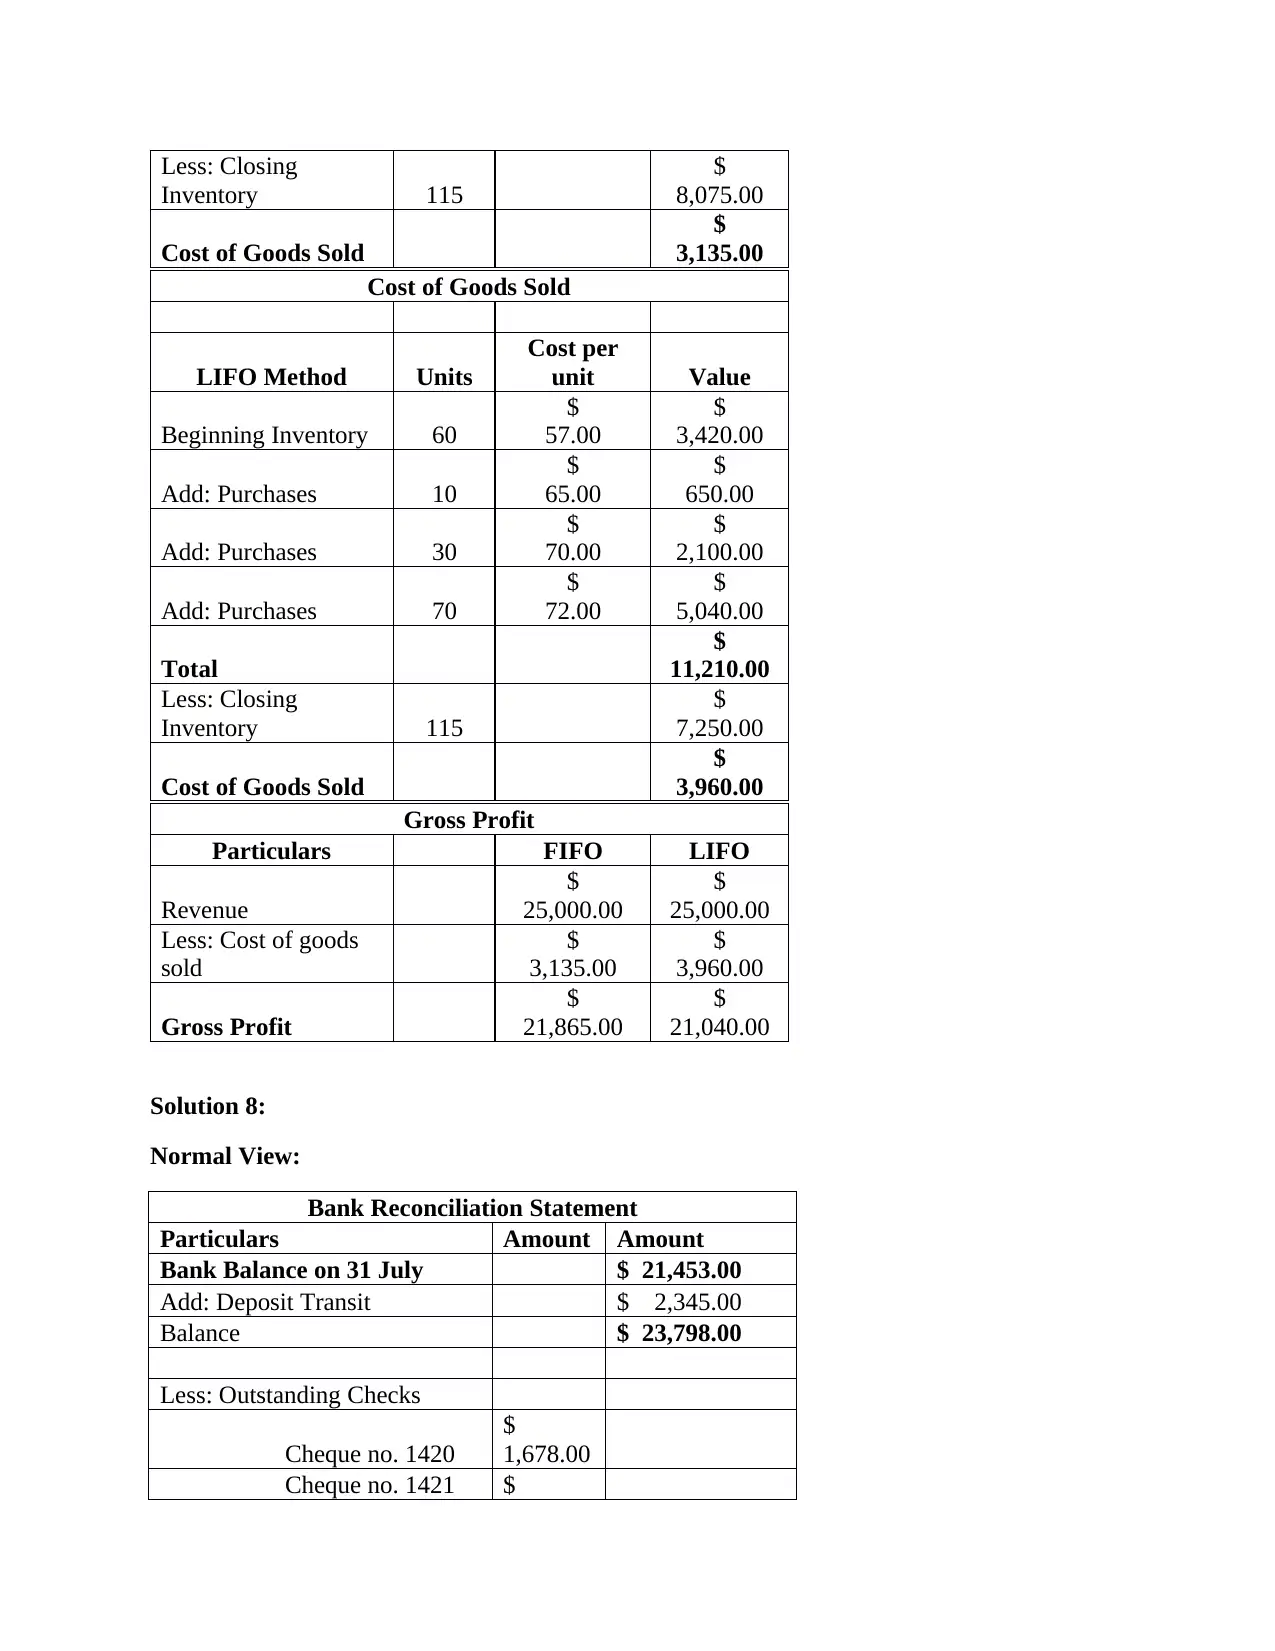
Less: Closing
Inventory 115
$
8,075.00
Cost of Goods Sold
$
3,135.00
Cost of Goods Sold
LIFO Method Units
Cost per
unit Value
Beginning Inventory 60
$
57.00
$
3,420.00
Add: Purchases 10
$
65.00
$
650.00
Add: Purchases 30
$
70.00
$
2,100.00
Add: Purchases 70
$
72.00
$
5,040.00
Total
$
11,210.00
Less: Closing
Inventory 115
$
7,250.00
Cost of Goods Sold
$
3,960.00
Gross Profit
Particulars FIFO LIFO
Revenue
$
25,000.00
$
25,000.00
Less: Cost of goods
sold
$
3,135.00
$
3,960.00
Gross Profit
$
21,865.00
$
21,040.00
Solution 8:
Normal View:
Bank Reconciliation Statement
Particulars Amount Amount
Bank Balance on 31 July $ 21,453.00
Add: Deposit Transit $ 2,345.00
Balance $ 23,798.00
Less: Outstanding Checks
Cheque no. 1420
$
1,678.00
Cheque no. 1421 $
Inventory 115
$
8,075.00
Cost of Goods Sold
$
3,135.00
Cost of Goods Sold
LIFO Method Units
Cost per
unit Value
Beginning Inventory 60
$
57.00
$
3,420.00
Add: Purchases 10
$
65.00
$
650.00
Add: Purchases 30
$
70.00
$
2,100.00
Add: Purchases 70
$
72.00
$
5,040.00
Total
$
11,210.00
Less: Closing
Inventory 115
$
7,250.00
Cost of Goods Sold
$
3,960.00
Gross Profit
Particulars FIFO LIFO
Revenue
$
25,000.00
$
25,000.00
Less: Cost of goods
sold
$
3,135.00
$
3,960.00
Gross Profit
$
21,865.00
$
21,040.00
Solution 8:
Normal View:
Bank Reconciliation Statement
Particulars Amount Amount
Bank Balance on 31 July $ 21,453.00
Add: Deposit Transit $ 2,345.00
Balance $ 23,798.00
Less: Outstanding Checks
Cheque no. 1420
$
1,678.00
Cheque no. 1421 $
Paraphrase This Document
Need a fresh take? Get an instant paraphrase of this document with our AI Paraphraser
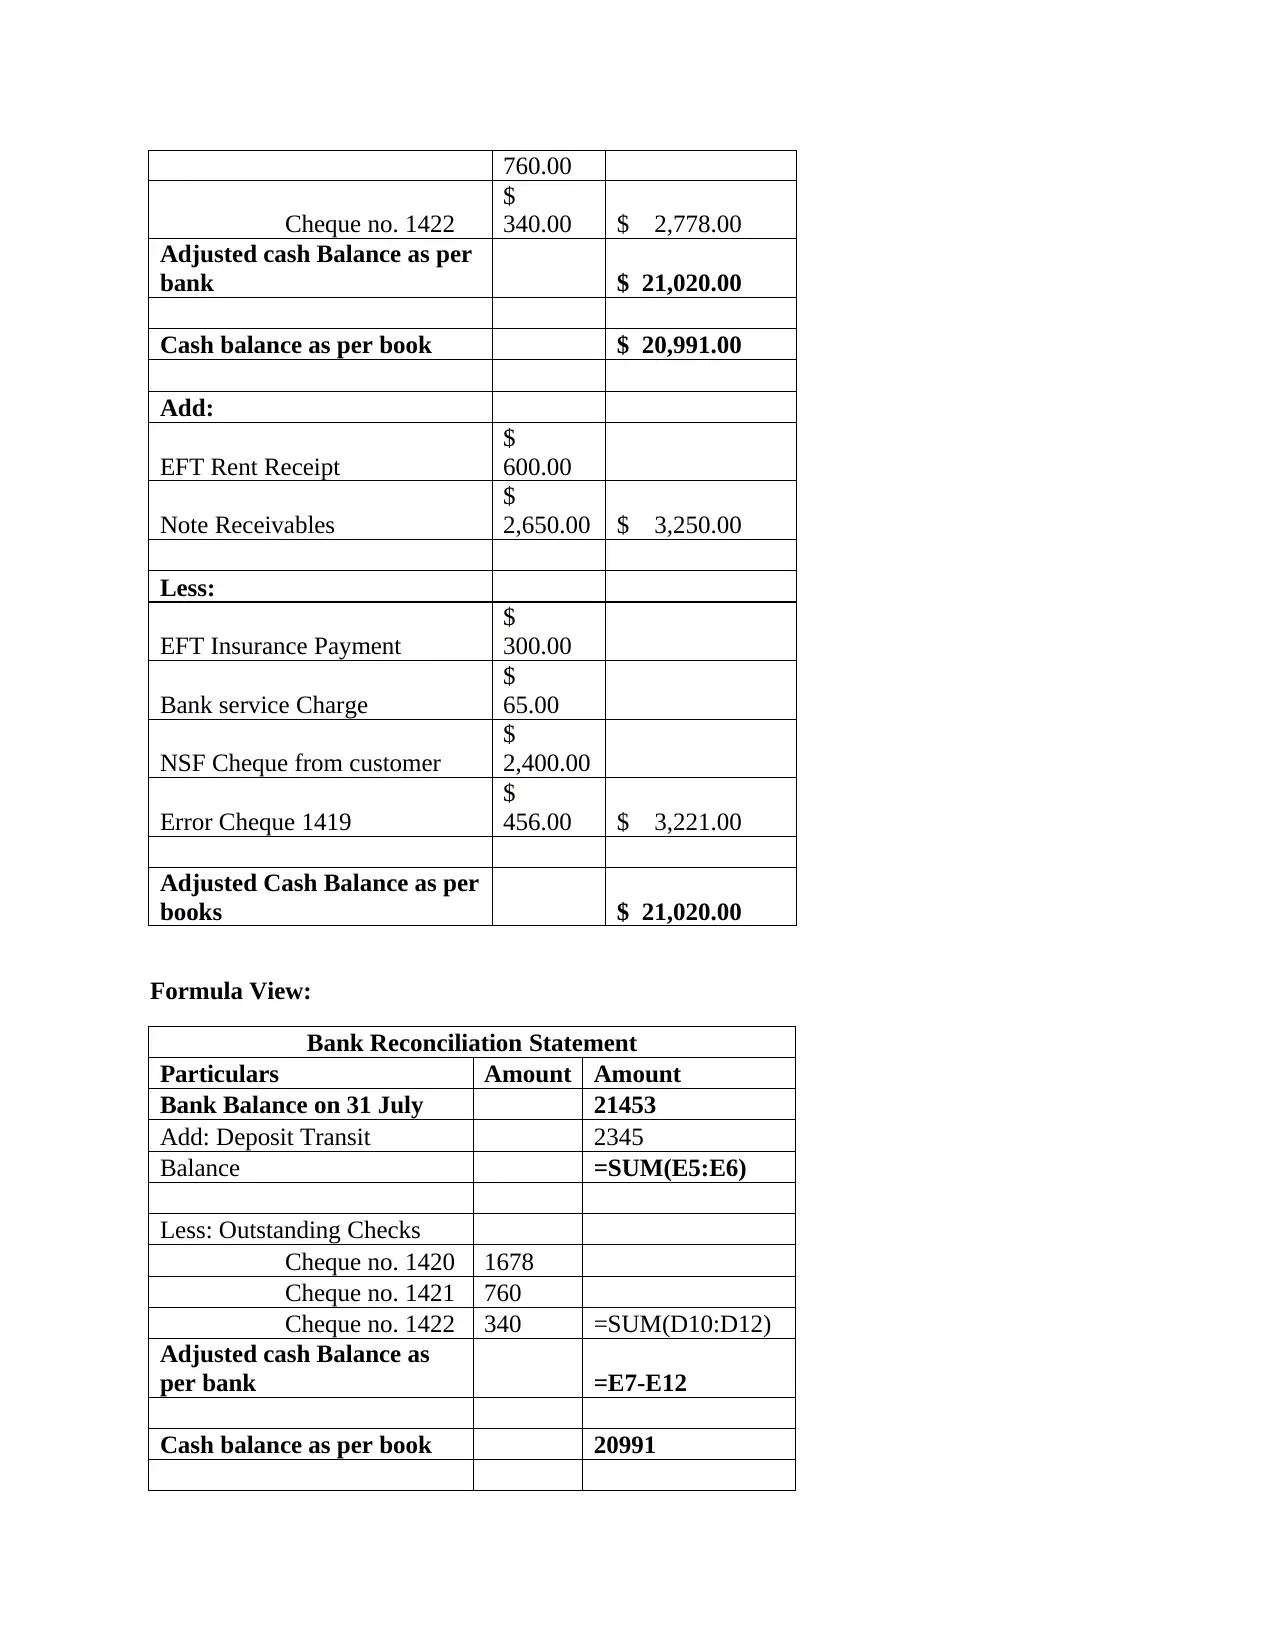
760.00
Cheque no. 1422
$
340.00 $ 2,778.00
Adjusted cash Balance as per
bank $ 21,020.00
Cash balance as per book $ 20,991.00
Add:
EFT Rent Receipt
$
600.00
Note Receivables
$
2,650.00 $ 3,250.00
Less:
EFT Insurance Payment
$
300.00
Bank service Charge
$
65.00
NSF Cheque from customer
$
2,400.00
Error Cheque 1419
$
456.00 $ 3,221.00
Adjusted Cash Balance as per
books $ 21,020.00
Formula View:
Bank Reconciliation Statement
Particulars Amount Amount
Bank Balance on 31 July 21453
Add: Deposit Transit 2345
Balance =SUM(E5:E6)
Less: Outstanding Checks
Cheque no. 1420 1678
Cheque no. 1421 760
Cheque no. 1422 340 =SUM(D10:D12)
Adjusted cash Balance as
per bank =E7-E12
Cash balance as per book 20991
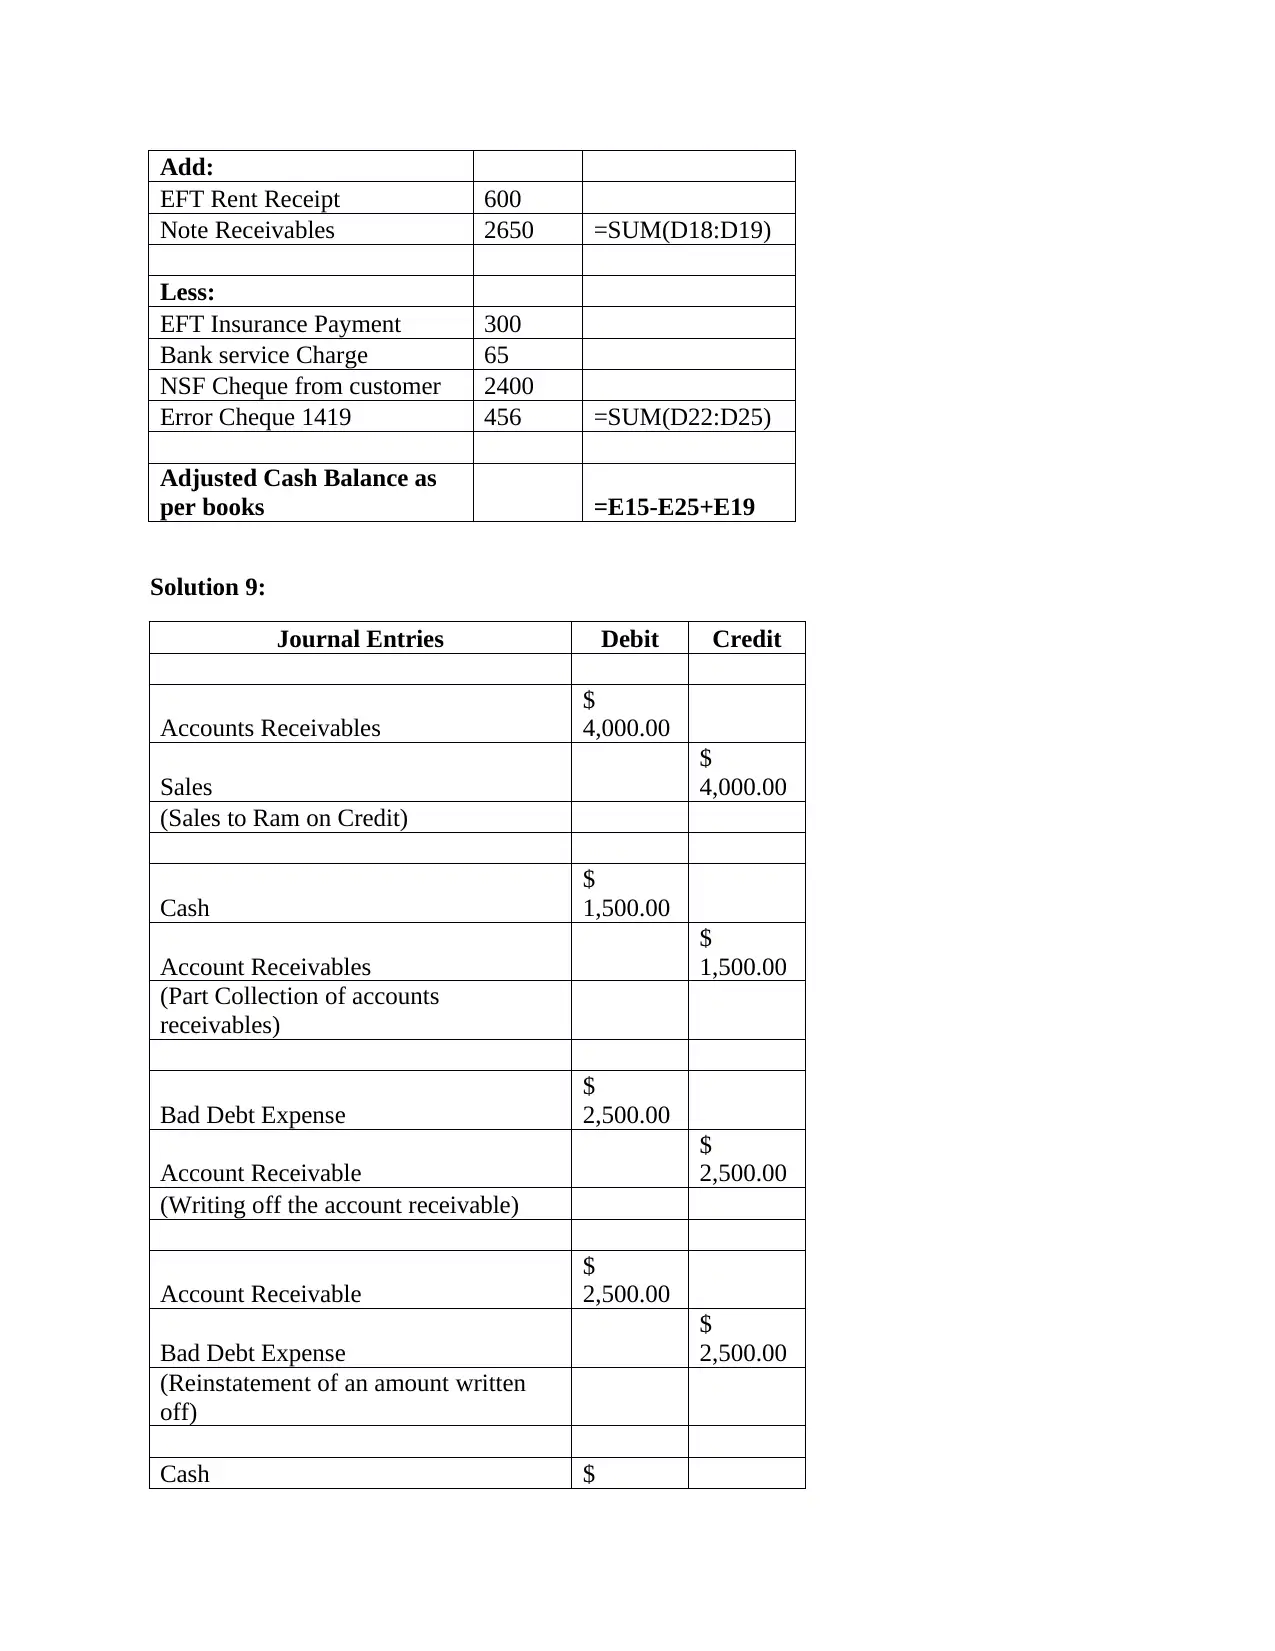
Add:
EFT Rent Receipt 600
Note Receivables 2650 =SUM(D18:D19)
Less:
EFT Insurance Payment 300
Bank service Charge 65
NSF Cheque from customer 2400
Error Cheque 1419 456 =SUM(D22:D25)
Adjusted Cash Balance as
per books =E15-E25+E19
Solution 9:
Journal Entries Debit Credit
Accounts Receivables
$
4,000.00
Sales
$
4,000.00
(Sales to Ram on Credit)
Cash
$
1,500.00
Account Receivables
$
1,500.00
(Part Collection of accounts
receivables)
Bad Debt Expense
$
2,500.00
Account Receivable
$
2,500.00
(Writing off the account receivable)
Account Receivable
$
2,500.00
Bad Debt Expense
$
2,500.00
(Reinstatement of an amount written
off)
Cash $
⊘ This is a preview!⊘
Do you want full access?
Subscribe today to unlock all pages.
Trusted by 1+ million students worldwide
2,500.00
Account Receivables
$
2,500.00
(Collection of accounts receivables)
(Bromwich & Bhimani, 2005)
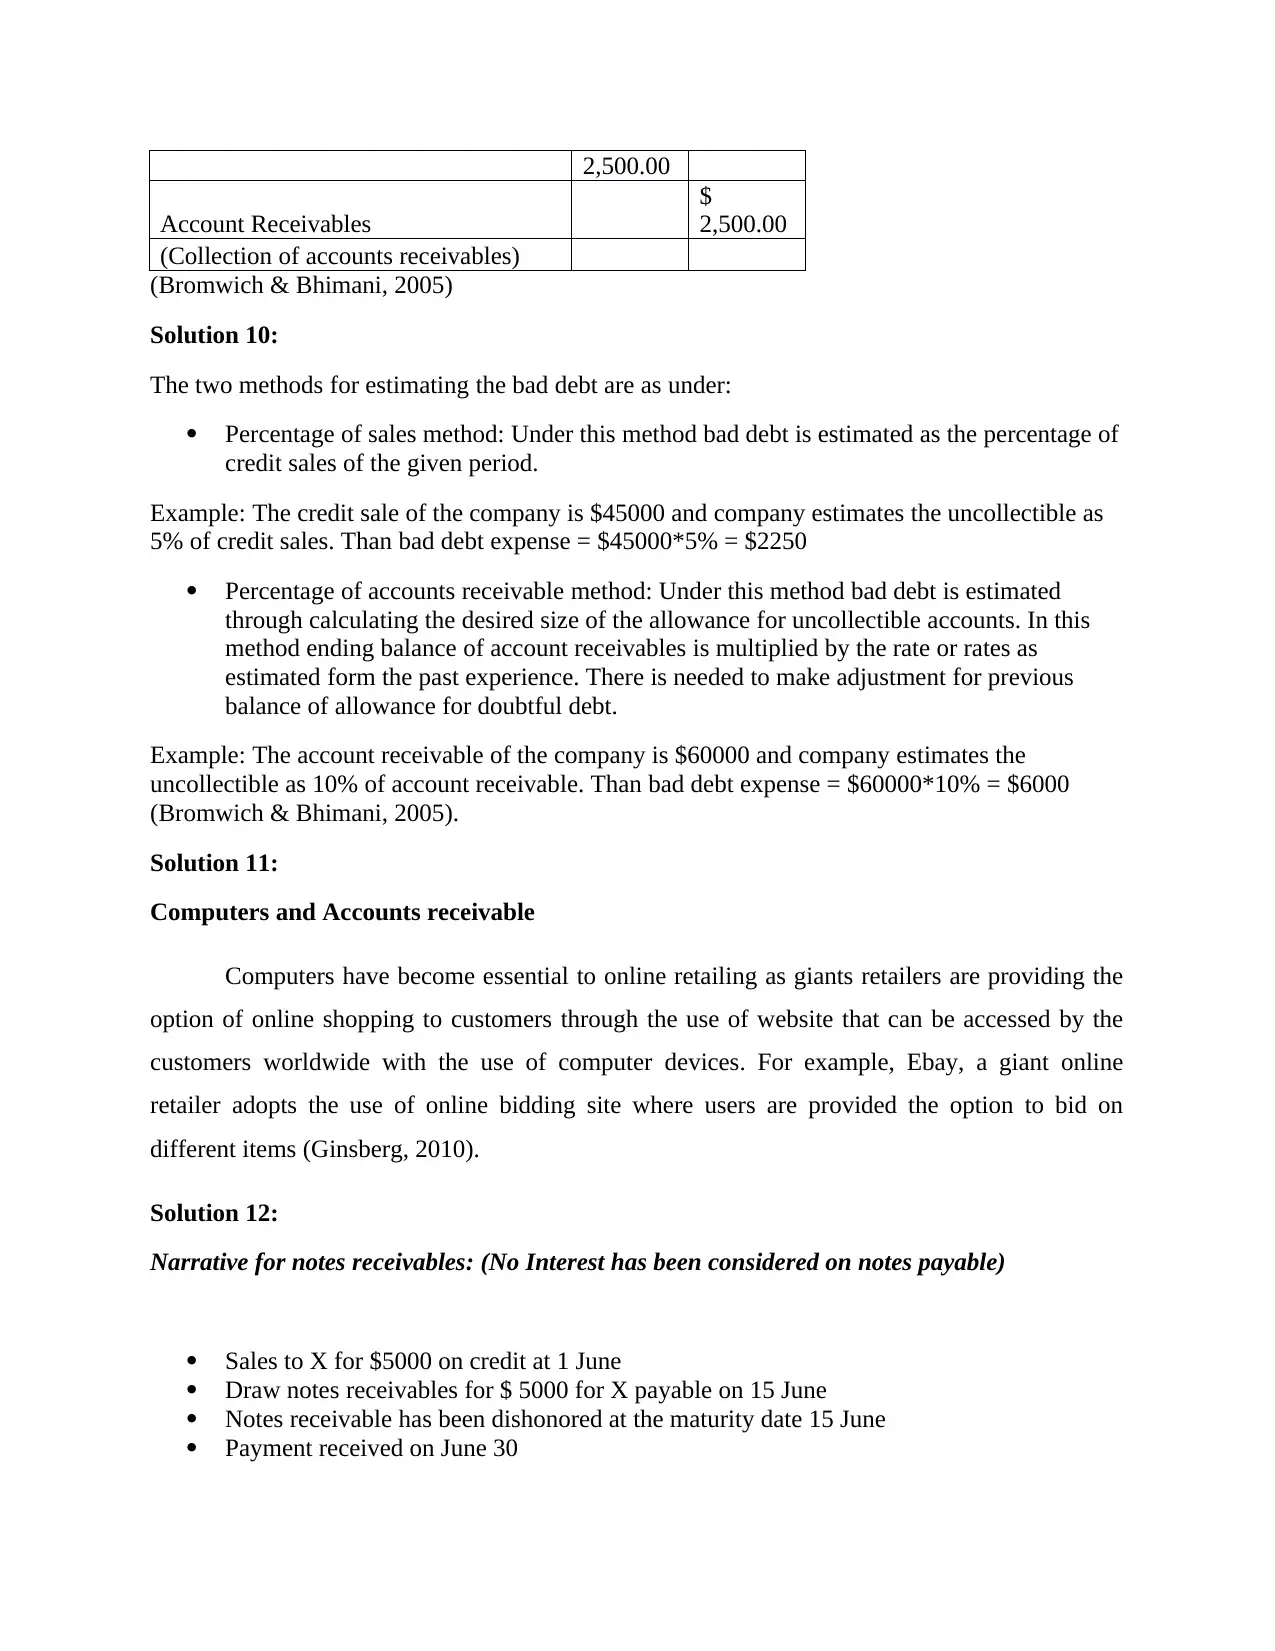
Solution 10:
The two methods for estimating the bad debt are as under:
Percentage of sales method: Under this method bad debt is estimated as the percentage of
credit sales of the given period.
Example: The credit sale of the company is $45000 and company estimates the uncollectible as
5% of credit sales. Than bad debt expense = $45000*5% = $2250
Percentage of accounts receivable method: Under this method bad debt is estimated
through calculating the desired size of the allowance for uncollectible accounts. In this
method ending balance of account receivables is multiplied by the rate or rates as
estimated form the past experience. There is needed to make adjustment for previous
balance of allowance for doubtful debt.
Example: The account receivable of the company is $60000 and company estimates the
uncollectible as 10% of account receivable. Than bad debt expense = $60000*10% = $6000
(Bromwich & Bhimani, 2005).
Solution 11:
Computers and Accounts receivable
Computers have become essential to online retailing as giants retailers are providing the
option of online shopping to customers through the use of website that can be accessed by the
customers worldwide with the use of computer devices. For example, Ebay, a giant online
retailer adopts the use of online bidding site where users are provided the option to bid on
different items (Ginsberg, 2010).
Solution 12:
Narrative for notes receivables: (No Interest has been considered on notes payable)
Sales to X for $5000 on credit at 1 June
Draw notes receivables for $ 5000 for X payable on 15 June
Notes receivable has been dishonored at the maturity date 15 June
Payment received on June 30
Account Receivables
$
2,500.00
(Collection of accounts receivables)
(Bromwich & Bhimani, 2005)
Solution 10:
The two methods for estimating the bad debt are as under:
Percentage of sales method: Under this method bad debt is estimated as the percentage of
credit sales of the given period.
Example: The credit sale of the company is $45000 and company estimates the uncollectible as
5% of credit sales. Than bad debt expense = $45000*5% = $2250
Percentage of accounts receivable method: Under this method bad debt is estimated
through calculating the desired size of the allowance for uncollectible accounts. In this
method ending balance of account receivables is multiplied by the rate or rates as
estimated form the past experience. There is needed to make adjustment for previous
balance of allowance for doubtful debt.
Example: The account receivable of the company is $60000 and company estimates the
uncollectible as 10% of account receivable. Than bad debt expense = $60000*10% = $6000
(Bromwich & Bhimani, 2005).
Solution 11:
Computers and Accounts receivable
Computers have become essential to online retailing as giants retailers are providing the
option of online shopping to customers through the use of website that can be accessed by the
customers worldwide with the use of computer devices. For example, Ebay, a giant online
retailer adopts the use of online bidding site where users are provided the option to bid on
different items (Ginsberg, 2010).
Solution 12:
Narrative for notes receivables: (No Interest has been considered on notes payable)
Sales to X for $5000 on credit at 1 June
Draw notes receivables for $ 5000 for X payable on 15 June
Notes receivable has been dishonored at the maturity date 15 June
Payment received on June 30
Paraphrase This Document
Need a fresh take? Get an instant paraphrase of this document with our AI Paraphraser
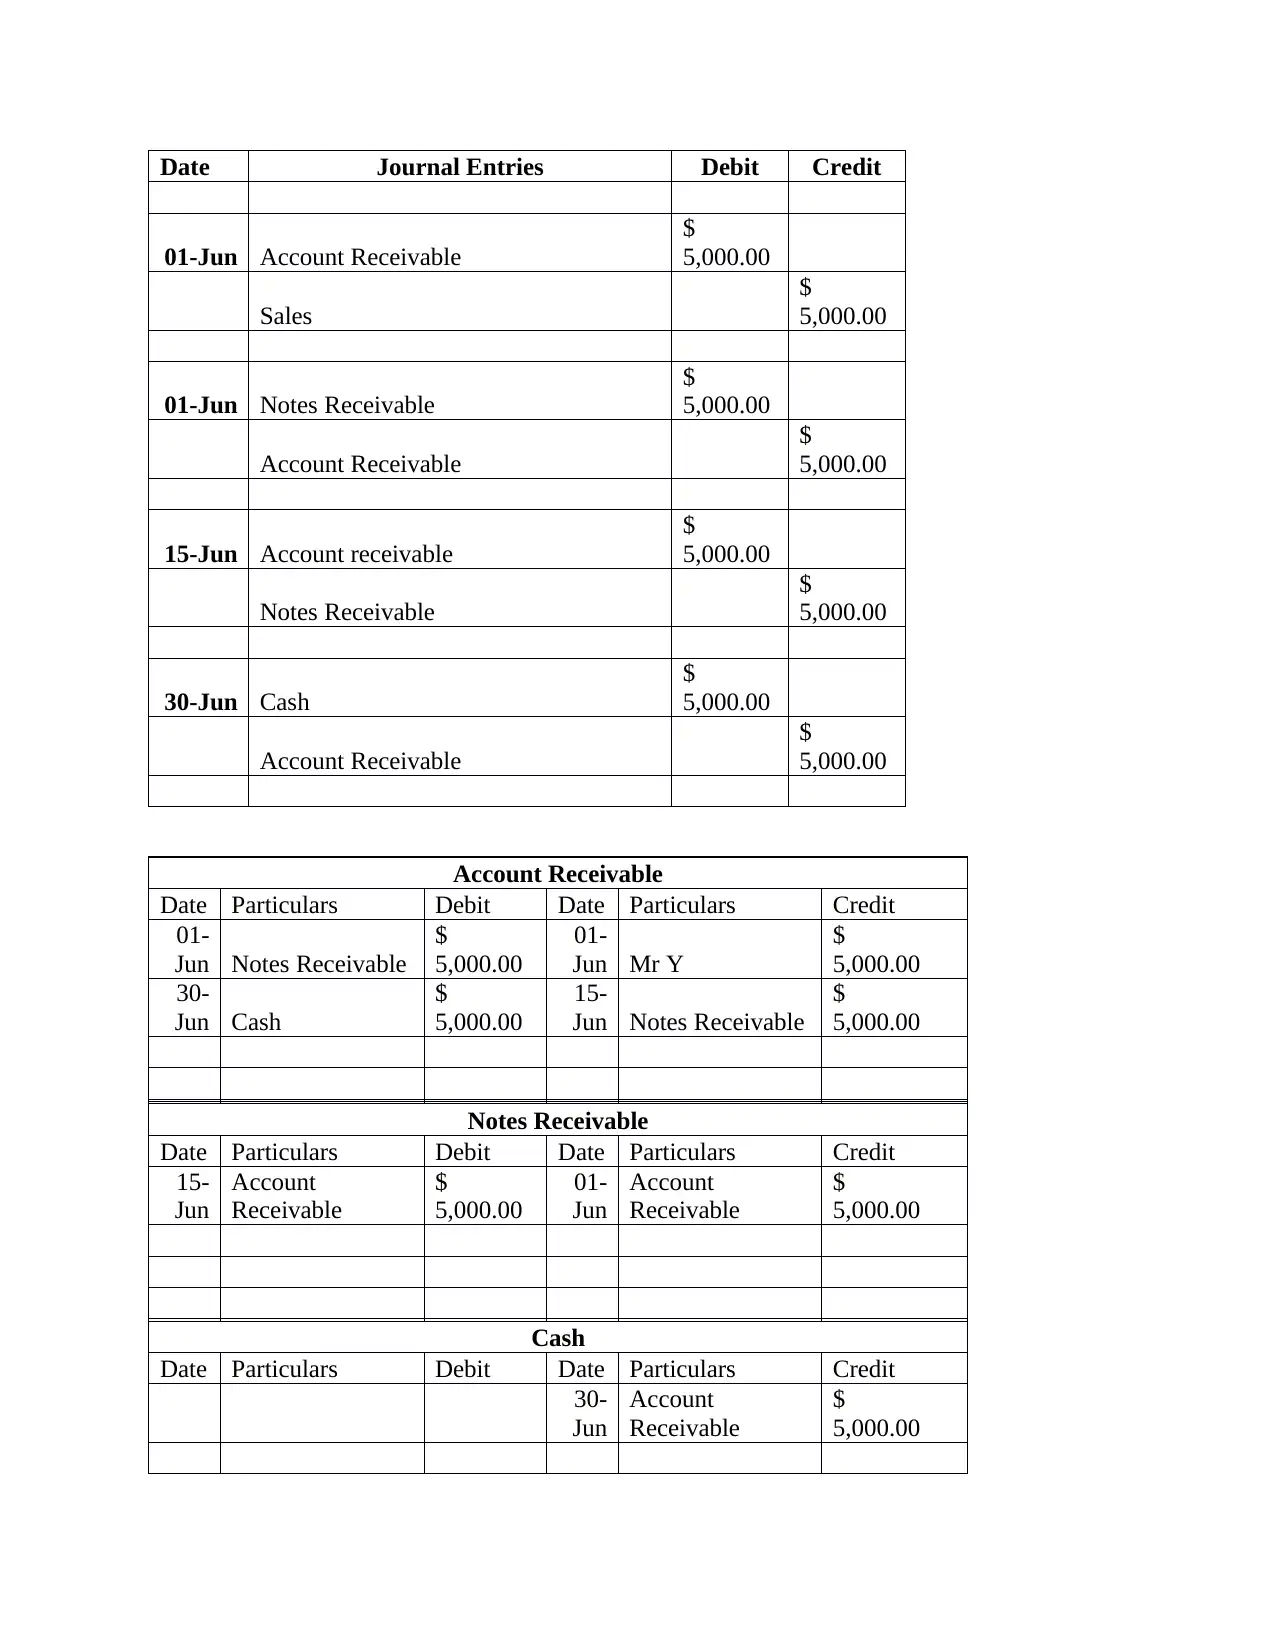
Date Journal Entries Debit Credit
01-Jun Account Receivable
$
5,000.00
Sales
$
5,000.00
01-Jun Notes Receivable
$
5,000.00
Account Receivable
$
5,000.00
15-Jun Account receivable
$
5,000.00
Notes Receivable
$
5,000.00
30-Jun Cash
$
5,000.00
Account Receivable
$
5,000.00
Account Receivable
Date Particulars Debit Date Particulars Credit
01-
Jun Notes Receivable
$
5,000.00
01-
Jun Mr Y
$
5,000.00
30-
Jun Cash
$
5,000.00
15-
Jun Notes Receivable
$
5,000.00
Notes Receivable
Date Particulars Debit Date Particulars Credit
15-
Jun
Account
Receivable
$
5,000.00
01-
Jun
Account
Receivable
$
5,000.00
Cash
Date Particulars Debit Date Particulars Credit
30-
Jun
Account
Receivable
$
5,000.00
(Brigham & Michael, 2013)
Solution 13:
Work Integrated Assessment case study
Introduction
The present report is developed for providing an analysis of Wesfarmers as a shareholder
investment on the perspective of an investment advisor with accounting expertise. The analysis
has been carried out with examining the various ranges of the company activities such as
sustainability issues and financial information. The report also presents the charts created from
Wesfarmers data to represent a better analysis of the company performance.
Analysis of Wesfarmers as a Shareholder Investment
Wesfarmers, a supermarket giant of Australia, is involved in diverse business activities
such as supermarkets, liquor, hotels and convenience stores, home improvement and office
supplies. The company has reported a significant increase in the financial earnings in the year
2017 due to improvement in its core business activities. The balance sheet of the company has
reflected a strong position of its asset base and ability to overcome the external shocks. It is also
helping the company to realize the advantage of cost of capital and maintaining adequate sources
of funds such as bank facilities and global bond markets. Also, it has maintained a good credit
rating that is depicted from its strong cash flows statement. The company income statement has
reported an increase in the net profit after tax (NPAT) of about 22.1 per cent in the year 2017 as
compared to the year 2016. Also, there is increase in the return on equity of the company from
12.4% to 9.6% in the previous year. There is also an increase in the operating cash flows of the
company from $861 million to $4,226 million. This is largely due to higher earnings and its
effective management of inventory across its various business segments. Also, it has reduced its
capital expenses in the year 2017 as compared to the previous year by about 11.5 per cent
(Wesfarmers Limited: Annual Report, 2017).
The company has also developed a strong and effective sustainability framework based
on its solid core values of integrity and accountability. It has developed and maintained
operational excellence in its business activities by innovating in its product range and categories
⊘ This is a preview!⊘
Do you want full access?
Subscribe today to unlock all pages.
Trusted by 1+ million students worldwide
1 out of 15
Your All-in-One AI-Powered Toolkit for Academic Success.
+13062052269
info@desklib.com
Available 24*7 on WhatsApp / Email
![[object Object]](/_next/static/media/star-bottom.7253800d.svg)
Unlock your academic potential
Copyright © 2020–2026 A2Z Services. All Rights Reserved. Developed and managed by ZUCOL.