Financial Analysis of UK Gambling Companies: A Detailed Report
VerifiedAdded on 2020/07/23
|18
|3743
|70
Report
AI Summary
This report provides a comprehensive financial analysis of three UK gambling companies: William Hill, Ladbrokes, and Paddy Power. The analysis includes an examination of financial ratios such as gross profit, operating margin, net profit, ROE, assets turnover, interest coverage, current ratio, collection period, credit days, and gearing ratio to assess their profitability, solvency, liquidity, and efficiency. Non-financial ratios are also considered. The report identifies the best and worst performing companies, offering recommendations for improvement. Furthermore, it explores the key stages in capital investment decision-making and various methods of investment appraisal, including payback period, accounting rate of return, net present value, and internal rate of return, with numerical examples to illustrate their application. The report aims to provide insights into the financial health and investment potential within the UK gambling market, highlighting areas for strategic improvement and future growth.

ACCOUNTNG AND FINANCE FOR
MANAGERS
MANAGERS
Paraphrase This Document
Need a fresh take? Get an instant paraphrase of this document with our AI Paraphraser

TABLE OF CONTENTS
INTRODUCTION...........................................................................................................................1
SECTION A.....................................................................................................................................1
Financial and non-financial analysis............................................................................................1
FINANCIAL RATIOS....................................................................................................................1
Gross profit ratio......................................................................................................................1
Operating margin ratio.............................................................................................................2
Net profit ratio..........................................................................................................................3
ROE..........................................................................................................................................3
Assets turnover ratio.................................................................................................................4
Interest coverage ratio..............................................................................................................4
Current ratio.............................................................................................................................5
Collection period......................................................................................................................5
Credit days................................................................................................................................6
Gearing ratio.............................................................................................................................7
NON-FINANCIAL RATIOS..........................................................................................................7
Identifying best performing companies with reasons..................................................................8
Identifying poor performing company with recommendations...................................................8
SECTION B.....................................................................................................................................9
A. Identifying the key stages in capital investment decision-making process.............................9
B. Identifying and explaining main methods of investment appraisal with examples..............11
CONCLUSION..............................................................................................................................14
REFERENCES..............................................................................................................................15
INDEX OF TABLES
Table 1 Calculation of payback period..........................................................................................11
Table 2 Calculation of Accounting Rate of Return.......................................................................12
Table 3 Calculation of Net Present Value.....................................................................................13
Table 4 Calculation of Internal Rate of return...............................................................................14
INTRODUCTION
Managing accounting and finance related functions in current volatile market is a
toughest tasks. Successful and strong financial plans and decisions can bring growth whereas
poor quality decisions may threaten the business sustainability. Financial Managers of the
companies are accountable to make the best financial plan to satisfy their own monetary
requirement, assure its optimum utilization and put better control and monitoring over the usage
so as to avoid the possibility of money shortfall. UK Gambling industry has undergone with a
strong growth period, UK Gambling Commission reported that online market expanded to £4.7
billion. The aim of the current assignment is to critically examine the financial performance of
three companies listed on LSE and works in UK Gambling market. It will be assessed via
financial ratio analysis including profitability, solvency, liquidity and efficiency. In the later part,
the report discusses the key stages in capital budgeting decisions and various methods of
investment appraisal will be examined with numerical examples to illustrate the key aspects and
taking viable investment decisions.
SECTION A
Financial and non-financial analysis
FINANCIAL RATIOS
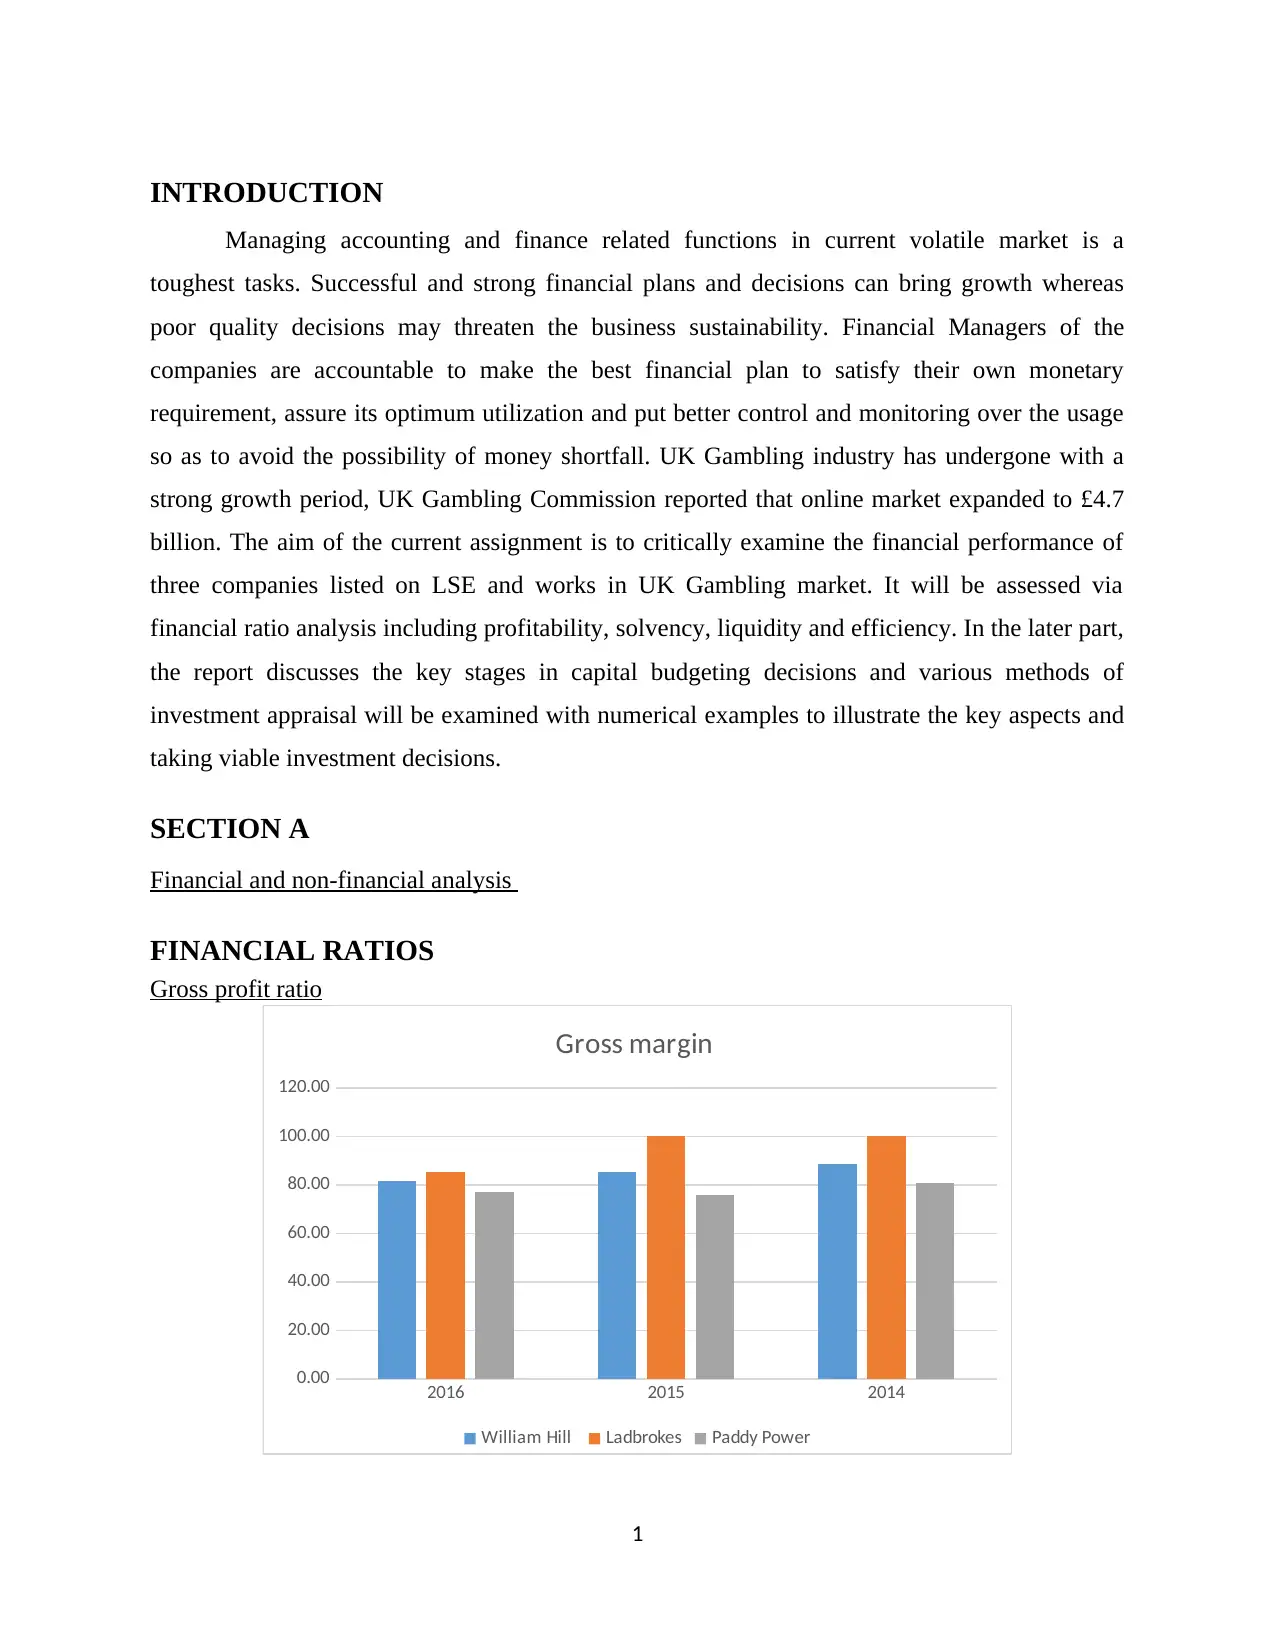
Gross profit ratio
2016 2015 2014
0.00
20.00
40.00
60.00
80.00
100.00
120.00
Gross margin
William Hill Ladbrokes Paddy Power
1
Managing accounting and finance related functions in current volatile market is a
toughest tasks. Successful and strong financial plans and decisions can bring growth whereas
poor quality decisions may threaten the business sustainability. Financial Managers of the
companies are accountable to make the best financial plan to satisfy their own monetary
requirement, assure its optimum utilization and put better control and monitoring over the usage
so as to avoid the possibility of money shortfall. UK Gambling industry has undergone with a
strong growth period, UK Gambling Commission reported that online market expanded to £4.7
billion. The aim of the current assignment is to critically examine the financial performance of
three companies listed on LSE and works in UK Gambling market. It will be assessed via
financial ratio analysis including profitability, solvency, liquidity and efficiency. In the later part,
the report discusses the key stages in capital budgeting decisions and various methods of
investment appraisal will be examined with numerical examples to illustrate the key aspects and
taking viable investment decisions.
SECTION A
Financial and non-financial analysis
FINANCIAL RATIOS
Gross profit ratio
2016 2015 2014
0.00
20.00
40.00
60.00
80.00
100.00
120.00
Gross margin
William Hill Ladbrokes Paddy Power
1
⊘ This is a preview!⊘
Do you want full access?
Subscribe today to unlock all pages.
Trusted by 1+ million students worldwide
William Hill’s gross profit shows falling trend from 88.57% to 85.27% & 81.74%. It is
lower than Ladbrokes gross margin of 85.40% but relatively greater than that of Paddy Power’s
ratio of 76.91%. The ratio clearly shows that Ladbrokes earned a greater return through mark-up
on product and service cost. Merger with Coral had really proved trading momentum as it
brought many opportunities and enable business to become the leading betting and gaming
business. Business had delivered excellent performance with huge increase in revenues by
completion of Coral merger. Proforma Basis reported 12% increase in football stakes as a result
of Euros and Self Service Betting Terminal Rollout helped to offset declining popularity of
greyhound and horse racing. In Italy, it had performed extremely well as its Eurobet revenue
goes up by 12%.
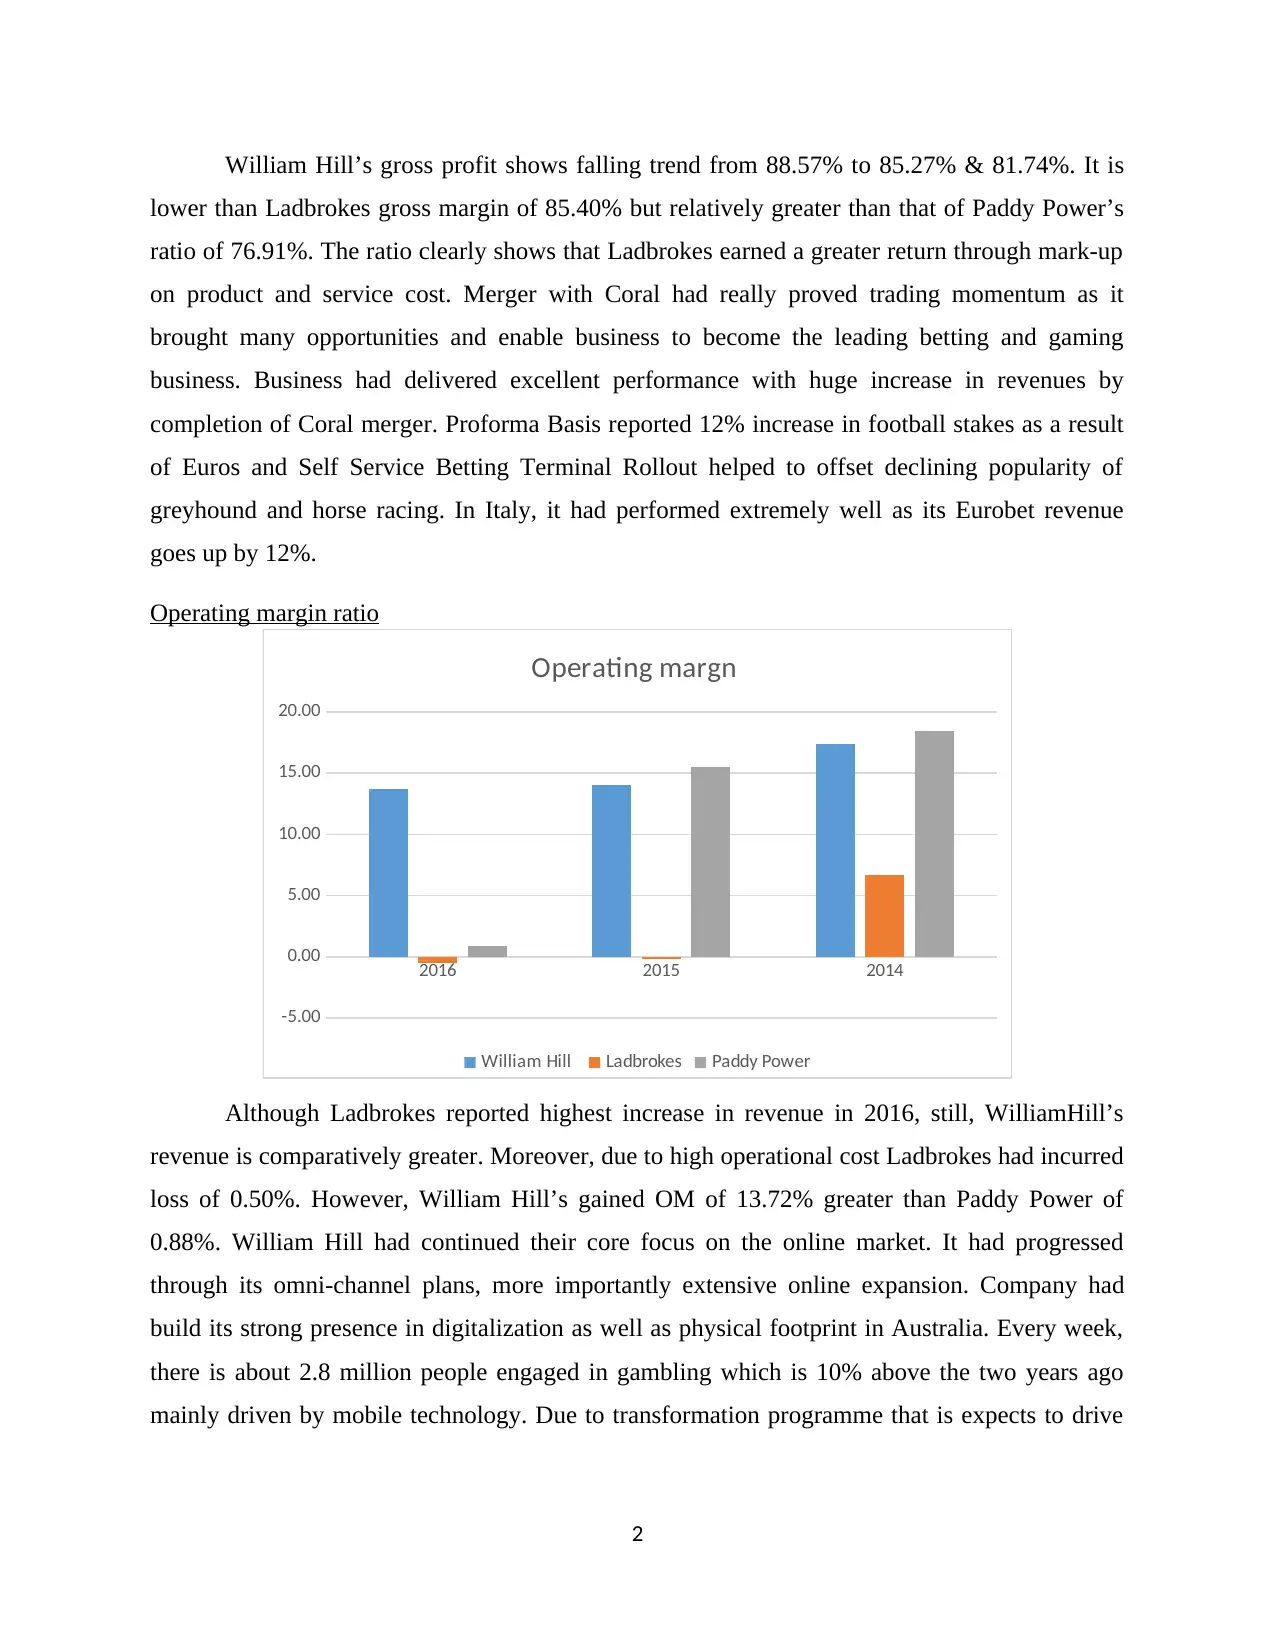
Operating margin ratio
2016 2015 2014
-5.00
0.00
5.00
10.00
15.00
20.00
Operating margn
William Hill Ladbrokes Paddy Power
Although Ladbrokes reported highest increase in revenue in 2016, still, WilliamHill’s
revenue is comparatively greater. Moreover, due to high operational cost Ladbrokes had incurred
loss of 0.50%. However, William Hill’s gained OM of 13.72% greater than Paddy Power of
0.88%. William Hill had continued their core focus on the online market. It had progressed
through its omni-channel plans, more importantly extensive online expansion. Company had
build its strong presence in digitalization as well as physical footprint in Australia. Every week,
there is about 2.8 million people engaged in gambling which is 10% above the two years ago
mainly driven by mobile technology. Due to transformation programme that is expects to drive
2
lower than Ladbrokes gross margin of 85.40% but relatively greater than that of Paddy Power’s
ratio of 76.91%. The ratio clearly shows that Ladbrokes earned a greater return through mark-up
on product and service cost. Merger with Coral had really proved trading momentum as it
brought many opportunities and enable business to become the leading betting and gaming
business. Business had delivered excellent performance with huge increase in revenues by
completion of Coral merger. Proforma Basis reported 12% increase in football stakes as a result
of Euros and Self Service Betting Terminal Rollout helped to offset declining popularity of
greyhound and horse racing. In Italy, it had performed extremely well as its Eurobet revenue
goes up by 12%.
Operating margin ratio
2016 2015 2014
-5.00
0.00
5.00
10.00
15.00
20.00
Operating margn
William Hill Ladbrokes Paddy Power
Although Ladbrokes reported highest increase in revenue in 2016, still, WilliamHill’s
revenue is comparatively greater. Moreover, due to high operational cost Ladbrokes had incurred
loss of 0.50%. However, William Hill’s gained OM of 13.72% greater than Paddy Power of
0.88%. William Hill had continued their core focus on the online market. It had progressed
through its omni-channel plans, more importantly extensive online expansion. Company had
build its strong presence in digitalization as well as physical footprint in Australia. Every week,
there is about 2.8 million people engaged in gambling which is 10% above the two years ago
mainly driven by mobile technology. Due to transformation programme that is expects to drive
2
Paraphrase This Document
Need a fresh take? Get an instant paraphrase of this document with our AI Paraphraser

efficiency saving of £40m, incurred one-off operating cost and incurred capital expense to drive
efficiency. Its operating costs grows up by 5% due to high staffing requirement.
Net profit ratio
2016 2015 2014
-20.00
-15.00
-10.00
-5.00
0.00
5.00
10.00
15.00
20.00
25.00
Net Margin
William Hill Ladbrokes Paddy Power
William Hill’s net profit continuously declining from 14.45% to 11.55% and 11.20%,
still, comparatively it is better, because both the other competitors had faced net loss through
their trading activities. Technological focus had evident strong growth in home market UK with
a CAGR of 15% with high revenues through betting shops also, as people loved watching it.
Leading position in the domestic market had provided a platform of international expansion
through mobile apps and online operations (William Hill’s Annual Report, 2016). Rigorous focus
on the consumer experience, launched redesigned Sportsbook app and Gaming updates had
reported a strong growth. Moreover, affordable financing cost on load had enabled firm in
maintaining a good profit margin where Ladbrokes loans just got doubled with high debt interest
obligation declined its profit (Laitinen, 2017).
3
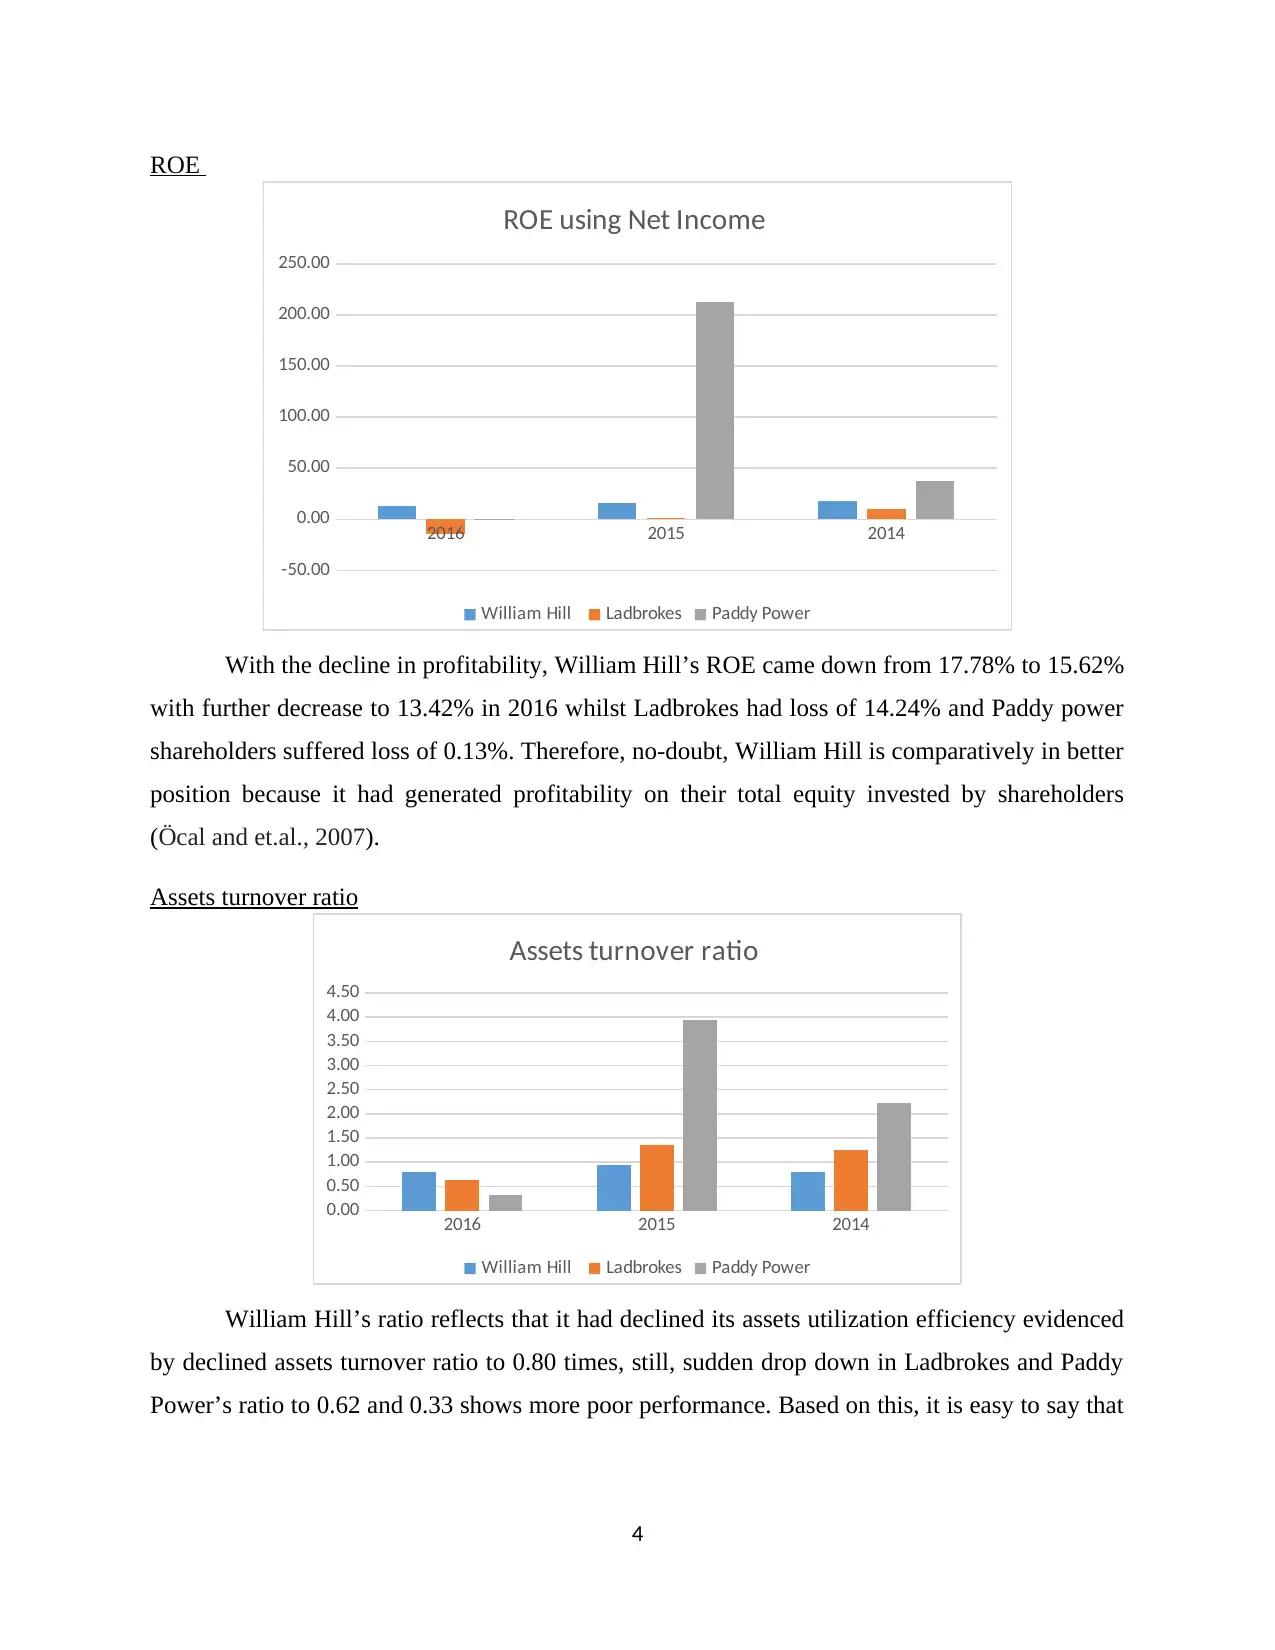
ROE
2016 2015 2014
-50.00
0.00
50.00
100.00
150.00
200.00
250.00
ROE using Net Income
William Hill Ladbrokes Paddy Power
With the decline in profitability, William Hill’s ROE came down from 17.78% to 15.62%
with further decrease to 13.42% in 2016 whilst Ladbrokes had loss of 14.24% and Paddy power
shareholders suffered loss of 0.13%. Therefore, no-doubt, William Hill is comparatively in better
position because it had generated profitability on their total equity invested by shareholders
(Öcal and et.al., 2007).
Assets turnover ratio
2016 2015 2014
0.00
0.50
1.00
1.50
2.00
2.50
3.00
3.50
4.00
4.50
Assets turnover ratio
William Hill Ladbrokes Paddy Power
William Hill’s ratio reflects that it had declined its assets utilization efficiency evidenced
by declined assets turnover ratio to 0.80 times, still, sudden drop down in Ladbrokes and Paddy
Power’s ratio to 0.62 and 0.33 shows more poor performance. Based on this, it is easy to say that
4
2016 2015 2014
-50.00
0.00
50.00
100.00
150.00
200.00
250.00
ROE using Net Income
William Hill Ladbrokes Paddy Power
With the decline in profitability, William Hill’s ROE came down from 17.78% to 15.62%
with further decrease to 13.42% in 2016 whilst Ladbrokes had loss of 14.24% and Paddy power
shareholders suffered loss of 0.13%. Therefore, no-doubt, William Hill is comparatively in better
position because it had generated profitability on their total equity invested by shareholders
(Öcal and et.al., 2007).
Assets turnover ratio
2016 2015 2014
0.00
0.50
1.00
1.50
2.00
2.50
3.00
3.50
4.00
4.50
Assets turnover ratio
William Hill Ladbrokes Paddy Power
William Hill’s ratio reflects that it had declined its assets utilization efficiency evidenced
by declined assets turnover ratio to 0.80 times, still, sudden drop down in Ladbrokes and Paddy
Power’s ratio to 0.62 and 0.33 shows more poor performance. Based on this, it is easy to say that
4
⊘ This is a preview!⊘
Do you want full access?
Subscribe today to unlock all pages.
Trusted by 1+ million students worldwide

William Hill Plc’s managers had more effectively and efficiently used their business assets to
generate maximum turnover (Misund, 2017).
Interest coverage ratio
2016 2015 2014
-400
0
400
800
1200
Interest coverage ratio
William Hill Ladbrokes Paddy Power
Paddy Power ratio evident a sharp decline because of loss and increasing interest
obligation due to more debt collection. However, William Hill’s ratio is 4.51 times greater than
that of Ladbrokes and Paddy Power to -0.19 and 2.64 times. It clearly entails that it is able to
meet out their debt interest obligations on the scheduled time because of enough profitability.
Moreover, the business had managed the debt composition to maintain interest to the extent to
which it is affordable.
Current ratio
2016 2015 2014
0.00
0.20
0.40
0.60
0.80
1.00
1.20
1.40
1.60
Current ratio
William Hill Ladbrokes Paddy Power
William Hill’s CR dropped to 0.52:1 in 2015 and then increased to 0.71:1. Although, it is
greater than Ladbrokes whereas Paddy Power had comparatively good liquidity position with CR
of 0.99:1. It is mainly because of more investment in current assets whereas proportionately
5
Paraphrase This Document
Need a fresh take? Get an instant paraphrase of this document with our AI Paraphraser

increase in current liabilities is comparatively lower that helped managing sufficient liquidity
(Sahu and Pillai, 2017). Still, all these three gambling companies must focus on creditworthiness
because their CR is far below recommended ratio of 2:1.
Collection period
2,016.00 2,015.00 2,014.00
0
1
2
3
4
5
Collection period
William Hill Ladbrokes Paddy Power
William Hill’s debtor’s collection period increased to 5 days that shows that business
received its cash from receivables after 5 days Ladbrokes just took 1 day and Paddy Power get
money from debtors in 2 days. The findings strongly evident poor cash collection for William
Hill whereas Ladbrokes focuses on prompt cash receipts for managing liquidity (Lewellen,
2004).
Credit days
2016 2015 2014
0
5
10
15
20
25
30
35
Credit days
William Hill Ladbrokes Paddy Power
William Hill’s renegotiated with supplies and extended credit duration from 24 to 29
days to defer their payment to suppliers for a more period. Ladbrokes pay creditors within 25
6
days whereas Paddy Power pay them as they receive from debtors means debtors and creditors
payment days is equal to 2 days that seems too risky. Therefore, Ladbrokes and William are
comparatively in better position who pay suppliers delayed.
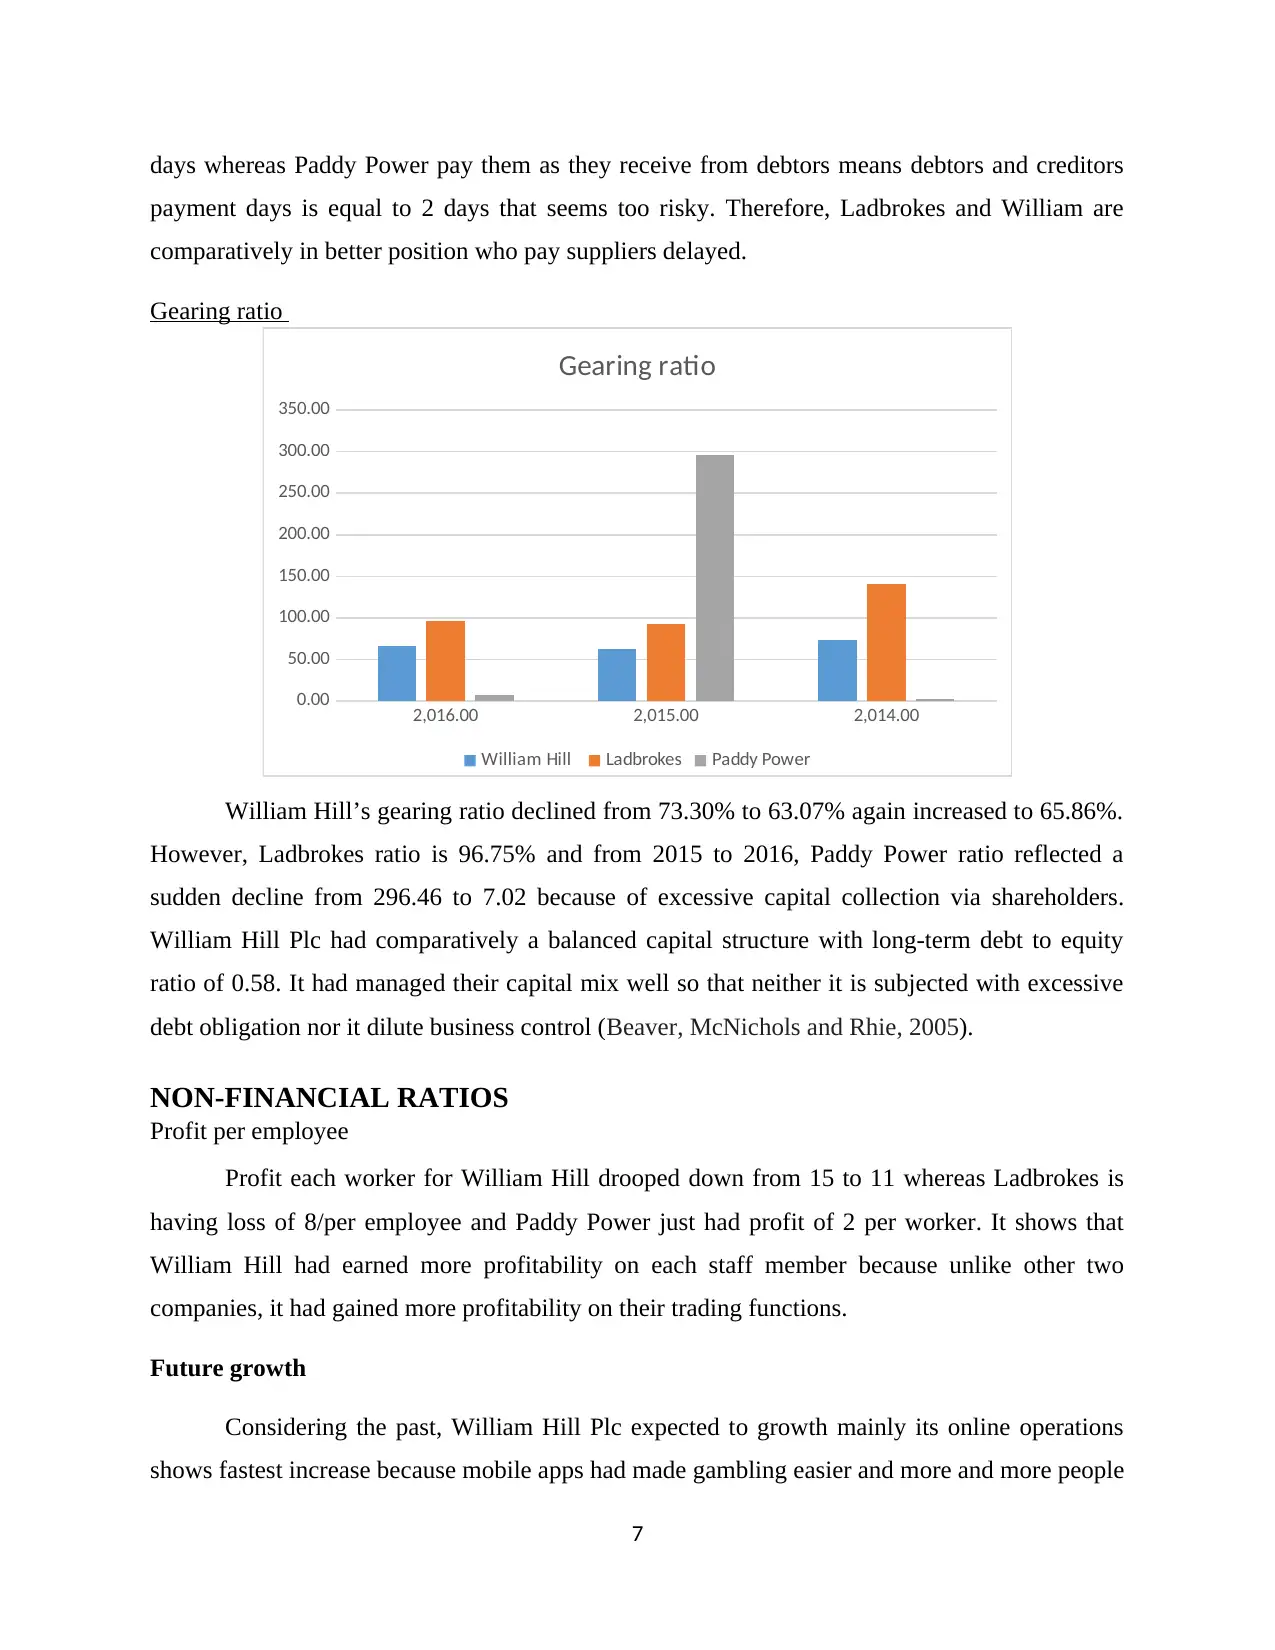
Gearing ratio
2,016.00 2,015.00 2,014.00
0.00
50.00
100.00
150.00
200.00
250.00
300.00
350.00
Gearing ratio
William Hill Ladbrokes Paddy Power
William Hill’s gearing ratio declined from 73.30% to 63.07% again increased to 65.86%.
However, Ladbrokes ratio is 96.75% and from 2015 to 2016, Paddy Power ratio reflected a
sudden decline from 296.46 to 7.02 because of excessive capital collection via shareholders.
William Hill Plc had comparatively a balanced capital structure with long-term debt to equity
ratio of 0.58. It had managed their capital mix well so that neither it is subjected with excessive
debt obligation nor it dilute business control (Beaver, McNichols and Rhie, 2005).
NON-FINANCIAL RATIOS
Profit per employee
Profit each worker for William Hill drooped down from 15 to 11 whereas Ladbrokes is
having loss of 8/per employee and Paddy Power just had profit of 2 per worker. It shows that
William Hill had earned more profitability on each staff member because unlike other two
companies, it had gained more profitability on their trading functions.
Future growth
Considering the past, William Hill Plc expected to growth mainly its online operations
shows fastest increase because mobile apps had made gambling easier and more and more people
7
payment days is equal to 2 days that seems too risky. Therefore, Ladbrokes and William are
comparatively in better position who pay suppliers delayed.
Gearing ratio
2,016.00 2,015.00 2,014.00
0.00
50.00
100.00
150.00
200.00
250.00
300.00
350.00
Gearing ratio
William Hill Ladbrokes Paddy Power
William Hill’s gearing ratio declined from 73.30% to 63.07% again increased to 65.86%.
However, Ladbrokes ratio is 96.75% and from 2015 to 2016, Paddy Power ratio reflected a
sudden decline from 296.46 to 7.02 because of excessive capital collection via shareholders.
William Hill Plc had comparatively a balanced capital structure with long-term debt to equity
ratio of 0.58. It had managed their capital mix well so that neither it is subjected with excessive
debt obligation nor it dilute business control (Beaver, McNichols and Rhie, 2005).
NON-FINANCIAL RATIOS
Profit per employee
Profit each worker for William Hill drooped down from 15 to 11 whereas Ladbrokes is
having loss of 8/per employee and Paddy Power just had profit of 2 per worker. It shows that
William Hill had earned more profitability on each staff member because unlike other two
companies, it had gained more profitability on their trading functions.
Future growth
Considering the past, William Hill Plc expected to growth mainly its online operations
shows fastest increase because mobile apps had made gambling easier and more and more people
7
⊘ This is a preview!⊘
Do you want full access?
Subscribe today to unlock all pages.
Trusted by 1+ million students worldwide
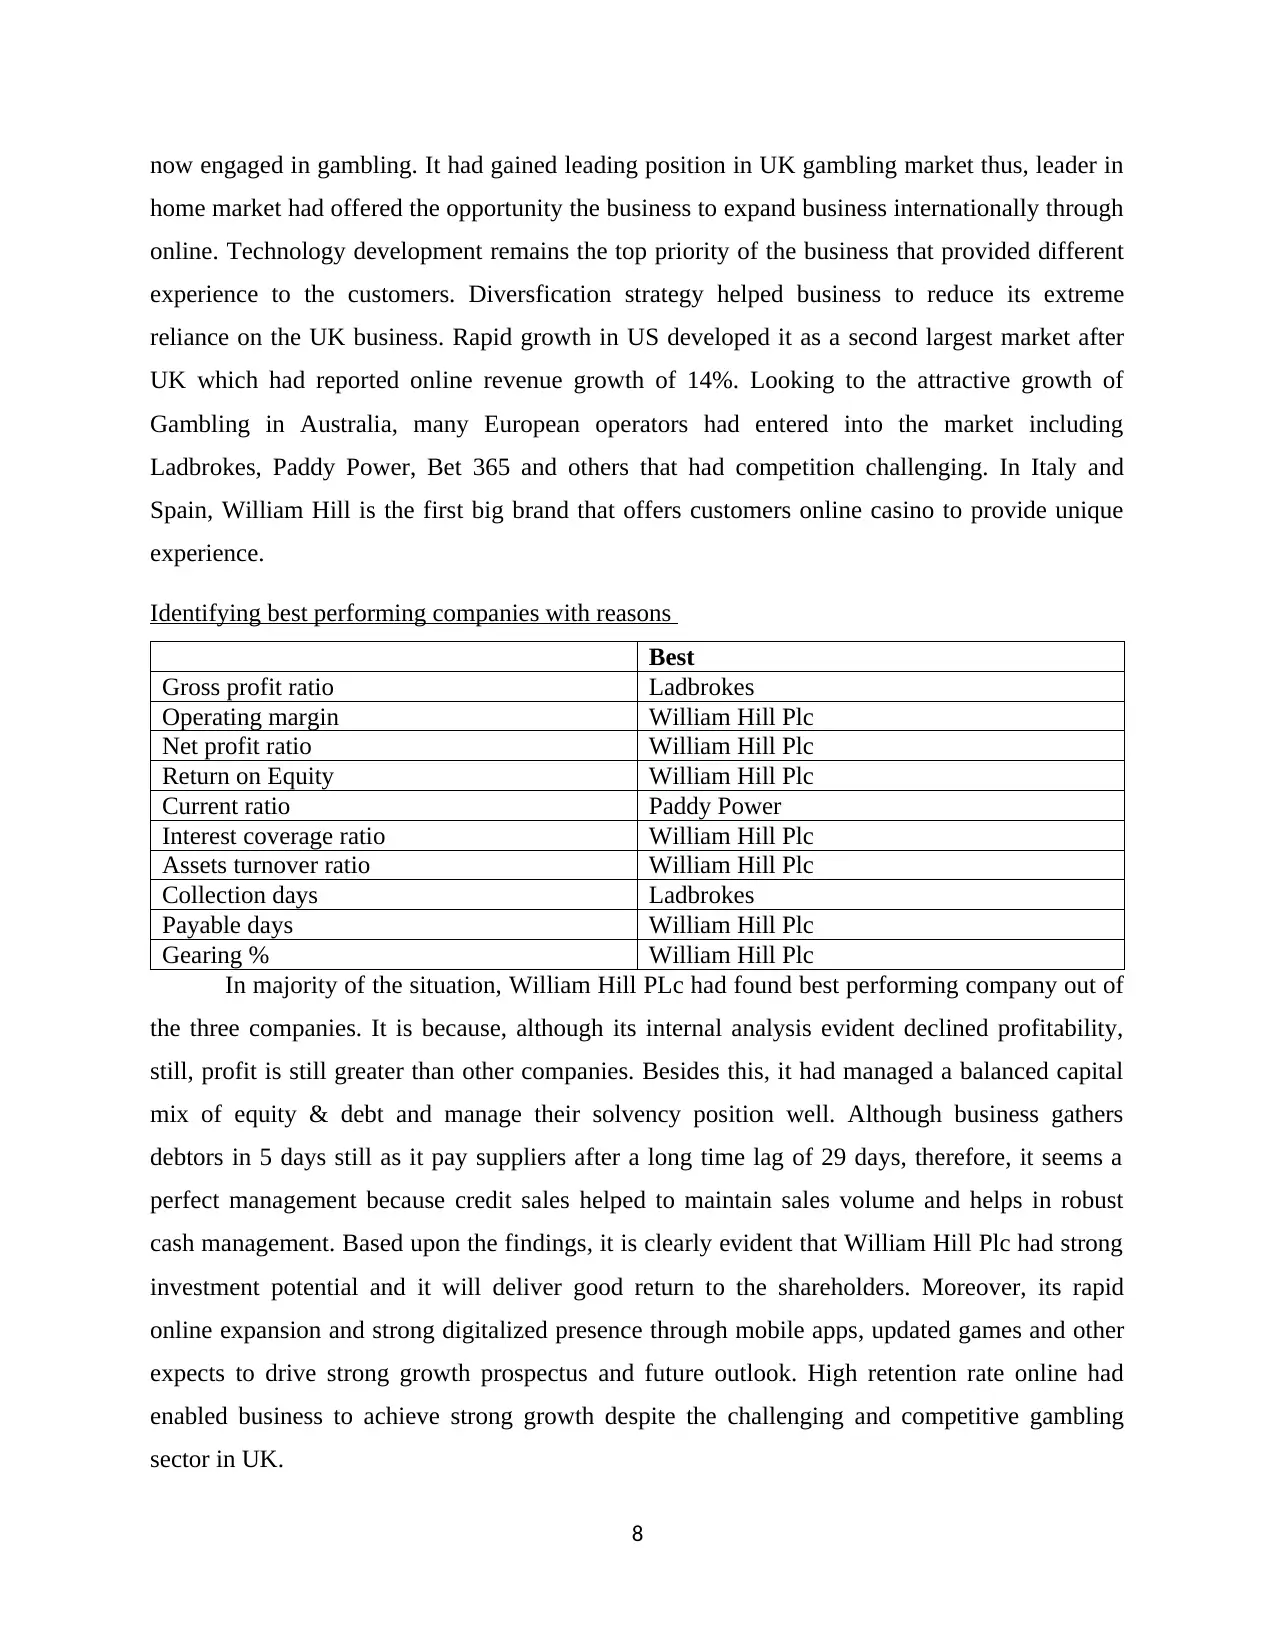
now engaged in gambling. It had gained leading position in UK gambling market thus, leader in
home market had offered the opportunity the business to expand business internationally through
online. Technology development remains the top priority of the business that provided different
experience to the customers. Diversfication strategy helped business to reduce its extreme
reliance on the UK business. Rapid growth in US developed it as a second largest market after
UK which had reported online revenue growth of 14%. Looking to the attractive growth of
Gambling in Australia, many European operators had entered into the market including
Ladbrokes, Paddy Power, Bet 365 and others that had competition challenging. In Italy and
Spain, William Hill is the first big brand that offers customers online casino to provide unique
experience.
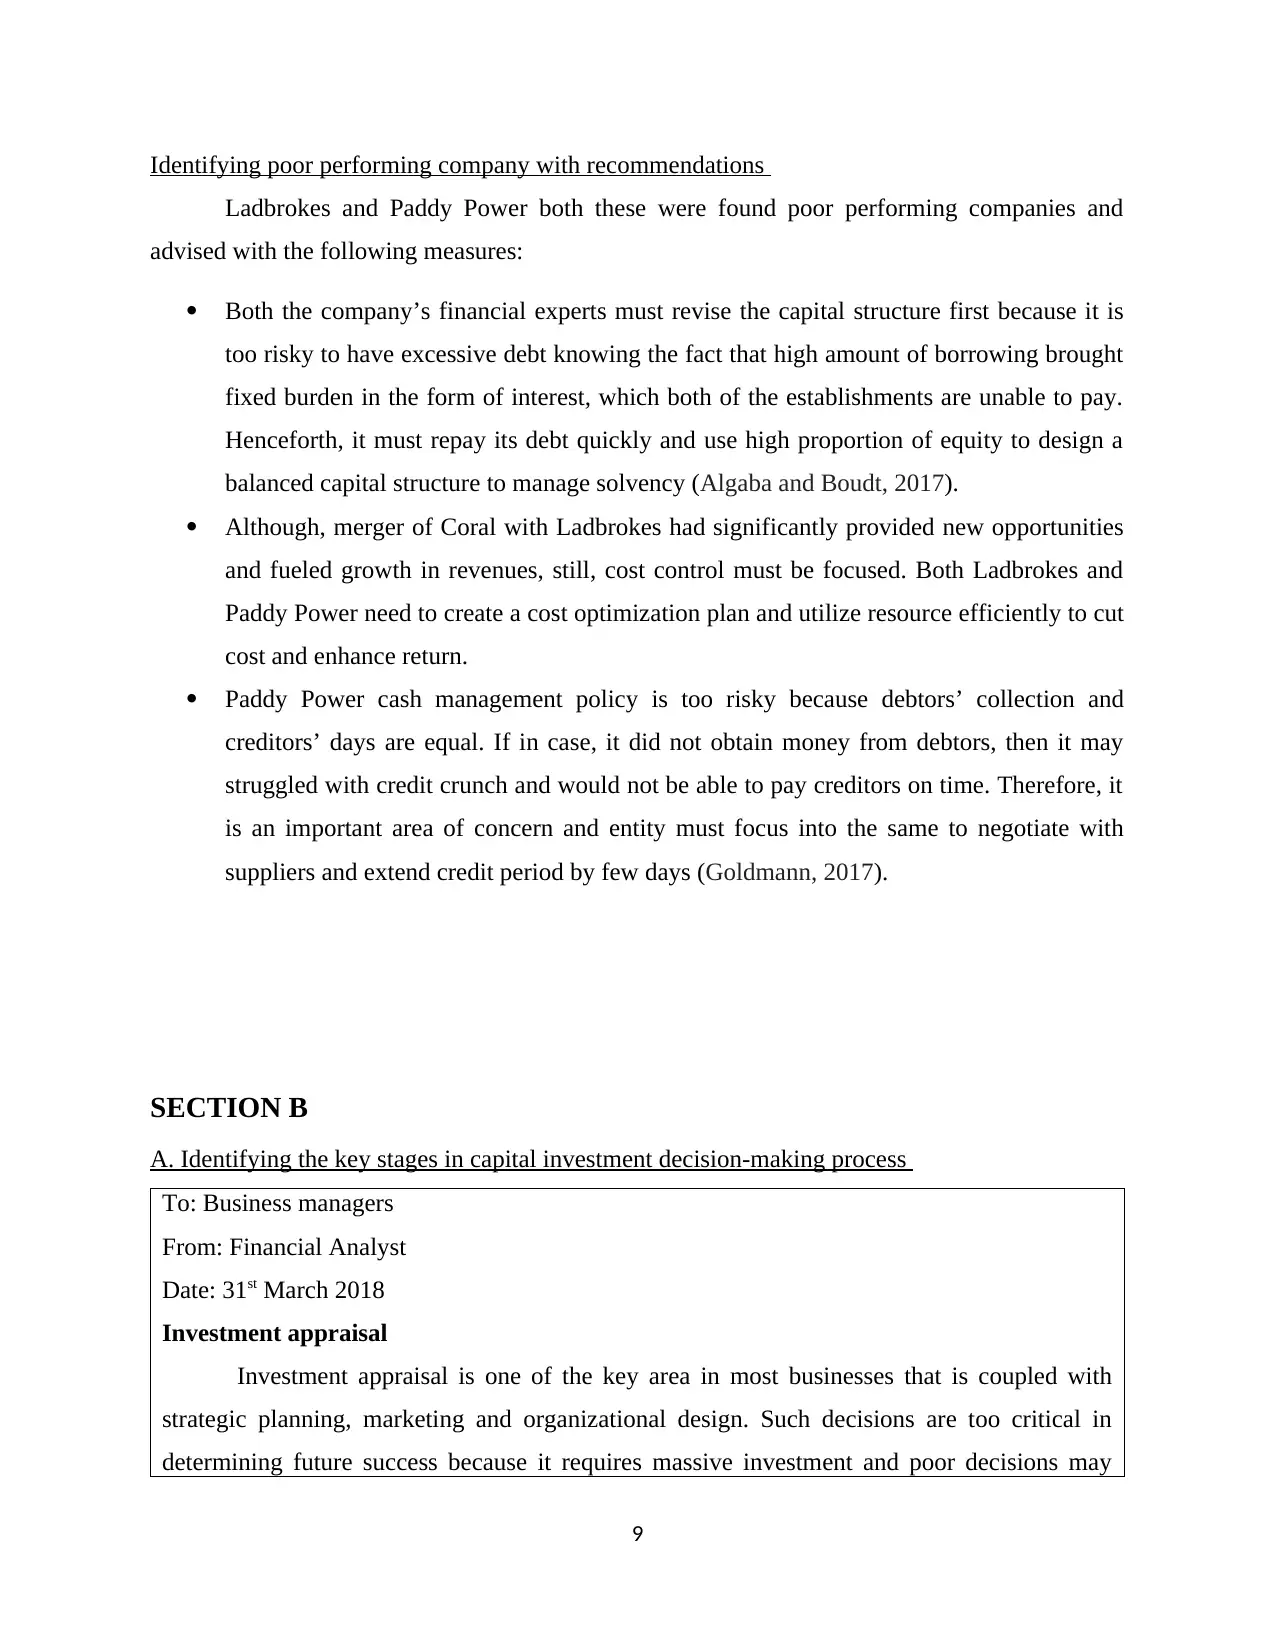
Identifying best performing companies with reasons
Best
Gross profit ratio Ladbrokes
Operating margin William Hill Plc
Net profit ratio William Hill Plc
Return on Equity William Hill Plc
Current ratio Paddy Power
Interest coverage ratio William Hill Plc
Assets turnover ratio William Hill Plc
Collection days Ladbrokes
Payable days William Hill Plc
Gearing % William Hill Plc
In majority of the situation, William Hill PLc had found best performing company out of
the three companies. It is because, although its internal analysis evident declined profitability,
still, profit is still greater than other companies. Besides this, it had managed a balanced capital
mix of equity & debt and manage their solvency position well. Although business gathers
debtors in 5 days still as it pay suppliers after a long time lag of 29 days, therefore, it seems a
perfect management because credit sales helped to maintain sales volume and helps in robust
cash management. Based upon the findings, it is clearly evident that William Hill Plc had strong
investment potential and it will deliver good return to the shareholders. Moreover, its rapid
online expansion and strong digitalized presence through mobile apps, updated games and other
expects to drive strong growth prospectus and future outlook. High retention rate online had
enabled business to achieve strong growth despite the challenging and competitive gambling
sector in UK.
8
home market had offered the opportunity the business to expand business internationally through
online. Technology development remains the top priority of the business that provided different
experience to the customers. Diversfication strategy helped business to reduce its extreme
reliance on the UK business. Rapid growth in US developed it as a second largest market after
UK which had reported online revenue growth of 14%. Looking to the attractive growth of
Gambling in Australia, many European operators had entered into the market including
Ladbrokes, Paddy Power, Bet 365 and others that had competition challenging. In Italy and
Spain, William Hill is the first big brand that offers customers online casino to provide unique
experience.
Identifying best performing companies with reasons
Best
Gross profit ratio Ladbrokes
Operating margin William Hill Plc
Net profit ratio William Hill Plc
Return on Equity William Hill Plc
Current ratio Paddy Power
Interest coverage ratio William Hill Plc
Assets turnover ratio William Hill Plc
Collection days Ladbrokes
Payable days William Hill Plc
Gearing % William Hill Plc
In majority of the situation, William Hill PLc had found best performing company out of
the three companies. It is because, although its internal analysis evident declined profitability,
still, profit is still greater than other companies. Besides this, it had managed a balanced capital
mix of equity & debt and manage their solvency position well. Although business gathers
debtors in 5 days still as it pay suppliers after a long time lag of 29 days, therefore, it seems a
perfect management because credit sales helped to maintain sales volume and helps in robust
cash management. Based upon the findings, it is clearly evident that William Hill Plc had strong
investment potential and it will deliver good return to the shareholders. Moreover, its rapid
online expansion and strong digitalized presence through mobile apps, updated games and other
expects to drive strong growth prospectus and future outlook. High retention rate online had
enabled business to achieve strong growth despite the challenging and competitive gambling
sector in UK.
8
Paraphrase This Document
Need a fresh take? Get an instant paraphrase of this document with our AI Paraphraser
Identifying poor performing company with recommendations
Ladbrokes and Paddy Power both these were found poor performing companies and
advised with the following measures:
Both the company’s financial experts must revise the capital structure first because it is
too risky to have excessive debt knowing the fact that high amount of borrowing brought
fixed burden in the form of interest, which both of the establishments are unable to pay.
Henceforth, it must repay its debt quickly and use high proportion of equity to design a
balanced capital structure to manage solvency (Algaba and Boudt, 2017).
Although, merger of Coral with Ladbrokes had significantly provided new opportunities
and fueled growth in revenues, still, cost control must be focused. Both Ladbrokes and
Paddy Power need to create a cost optimization plan and utilize resource efficiently to cut
cost and enhance return.
Paddy Power cash management policy is too risky because debtors’ collection and
creditors’ days are equal. If in case, it did not obtain money from debtors, then it may
struggled with credit crunch and would not be able to pay creditors on time. Therefore, it
is an important area of concern and entity must focus into the same to negotiate with
suppliers and extend credit period by few days (Goldmann, 2017).
SECTION B
A. Identifying the key stages in capital investment decision-making process
To: Business managers
From: Financial Analyst
Date: 31st March 2018
Investment appraisal
Investment appraisal is one of the key area in most businesses that is coupled with
strategic planning, marketing and organizational design. Such decisions are too critical in
determining future success because it requires massive investment and poor decisions may
9
bring business into significant financial trouble (Dyson and Berry, 2014). Capital budgeting
alternatively known as investment appraisal which is the best way to examine project viability
and thereby choose the most suitable project. Such methods helps in evaluating long-lived
investment and attractiveness of different available investment alternatives.
Key stages in Capital budgeting process
Capital budgeting process flows through various stages that are enumerated
underneath:
Ideas generation: First stage of capital budgeting starts with generating good quality
investment ideas from various sources such as employees, functional divisions or even outside
the business (Capital Budgeting Process, 2017). There are number of reasons which requires
company to invest in new proposals such as expanding existing product line, technological
advancement due to obsolescence, new machinery to enhance production volume and others.
Project screening & evaluation: After identifying investment opportunity, every
proposal is require to be critically evaluated on different criteria. It includes contribution
towards business value, analysis of risk reward relationship, related business risks and others.
During the stage, investment appraisal tools and techniques plays a major role because all the
proposal is evaluated applying various methods like payback, accounting rate of return, net
present value, and internal rate of return and profitability index to judge the risk-reward
relationship (Beck, Raj and Britzelmaier, 2013). Discounted methods are always preferred
because they adjust time value and examine associated risks. However, companies who may
struggle with liquidity crunch may prefer quick recovery of beginning outlay, as a result,
payback period seems preferable over other.
Project Selection: Different kind of businesses have distinctive requirements therefore,
there is no a particular method that is suitable for the selection. Therefore, companies are
require to use various selection criteria keeping in mind their target objectives. Company must
select project that expected to generate maximum yield at seems worthy by higher NPV and
IRR.
Implementation: After the selection, implementation stage comes where different tasks
and duties are assigned to different responsible parties who are liable to undertake the project
timely within the set budget constraints, maintain prudent supervision, monitoring and
controlling (Collier, 2015).
10
⊘ This is a preview!⊘
Do you want full access?
Subscribe today to unlock all pages.
Trusted by 1+ million students worldwide
1 out of 18
Related Documents


Your All-in-One AI-Powered Toolkit for Academic Success.
+13062052269
info@desklib.com
Available 24*7 on WhatsApp / Email
![[object Object]](/_next/static/media/star-bottom.7253800d.svg)
Unlock your academic potential
Copyright © 2020–2026 A2Z Services. All Rights Reserved. Developed and managed by ZUCOL.