Financial Analysis of ANZ Bank
VerifiedAdded on 2023/04/21
|16
|2402
|135
AI Summary
The aim of the assignment is to conduct a financial analysis on the Australia and New Zealand Banking Group Limited and asses the financial position of the company. The financial position of the company was evaluated with the help of the ratio analysis and the relevant financial analysis of the company with respect to the debt position on the company was also assessed.
Contribute Materials
Your contribution can guide someone’s learning journey. Share your
documents today.

Running head: ACCOUNTS AND FINANCE
Accounting and Finance
Name of the Student:
Name of the University:
Author’s Note:
Accounting and Finance
Name of the Student:
Name of the University:
Author’s Note:
Secure Best Marks with AI Grader
Need help grading? Try our AI Grader for instant feedback on your assignments.
1ANZ BANK
Executive Summary
The aim of the assignment is to conduct a financial analysis on the Australia and New Zealand
Banking Group Limited and asses the financial position of the company. The financial position
of the company was evaluated with the help of the ratio analysis and the relevant financial
analysis of the company with respect to the debt position on the company was also assessed. The
required rate of return for the company was also evaluated with the application of the CAPM
model and the cost of capital for the company was evaluated with the capital structure of the
company. The financial analysis of the ANZ Company was evaluated with the help of the ratio
analysis for the comp0any and relevant ratios were included to assess the financial performance
and the financial position of the company. The integrity and accountability of the ANZ Bank and
the recent issues occurred in the Bank were discussed and the relevant actions taken by the bank
to mitigate the same were analyzed in the assignment.
2ANZ BANK
Table of Contents
Introduction......................................................................................................................................3
Discussion........................................................................................................................................3
ANZ Current Capital Structure....................................................................................................3
Weighted Average Cost of Capital..............................................................................................4
Capital Asset Pricing Model........................................................................................................5
Capital Structure Analysis...........................................................................................................5
Ratio Analysis..............................................................................................................................7
Changes of Capital Structure.......................................................................................................8
Integrity & Accountability of ANZ Bank....................................................................................9
Conclusion.....................................................................................................................................10
Reference.......................................................................................................................................11
Appendix........................................................................................................................................13
3ANZ BANK
Introduction
The Australia and New Zealand Banking Group Limited is one of the key banking group
operating its services in the Australia and provides various kinds of financial products and
services. The capital structure of the company was evaluated by assessing the level of debt in
comparison to the equity of the company. The required rate of return for the stock was evaluated
with the help of the CAPM formula and the same has been applied in determining the weighted
average cost of capital for the firm. The key financial ratio is evaluated for the ANZ Bank was
assessed in order to determine the financial performance. The financing structure of the company
was evaluated with the help of the capital structure of the company and the same was compared
with other key competitors of the company like Westpac Bank (ANZ Bank, 2018).
Discussion
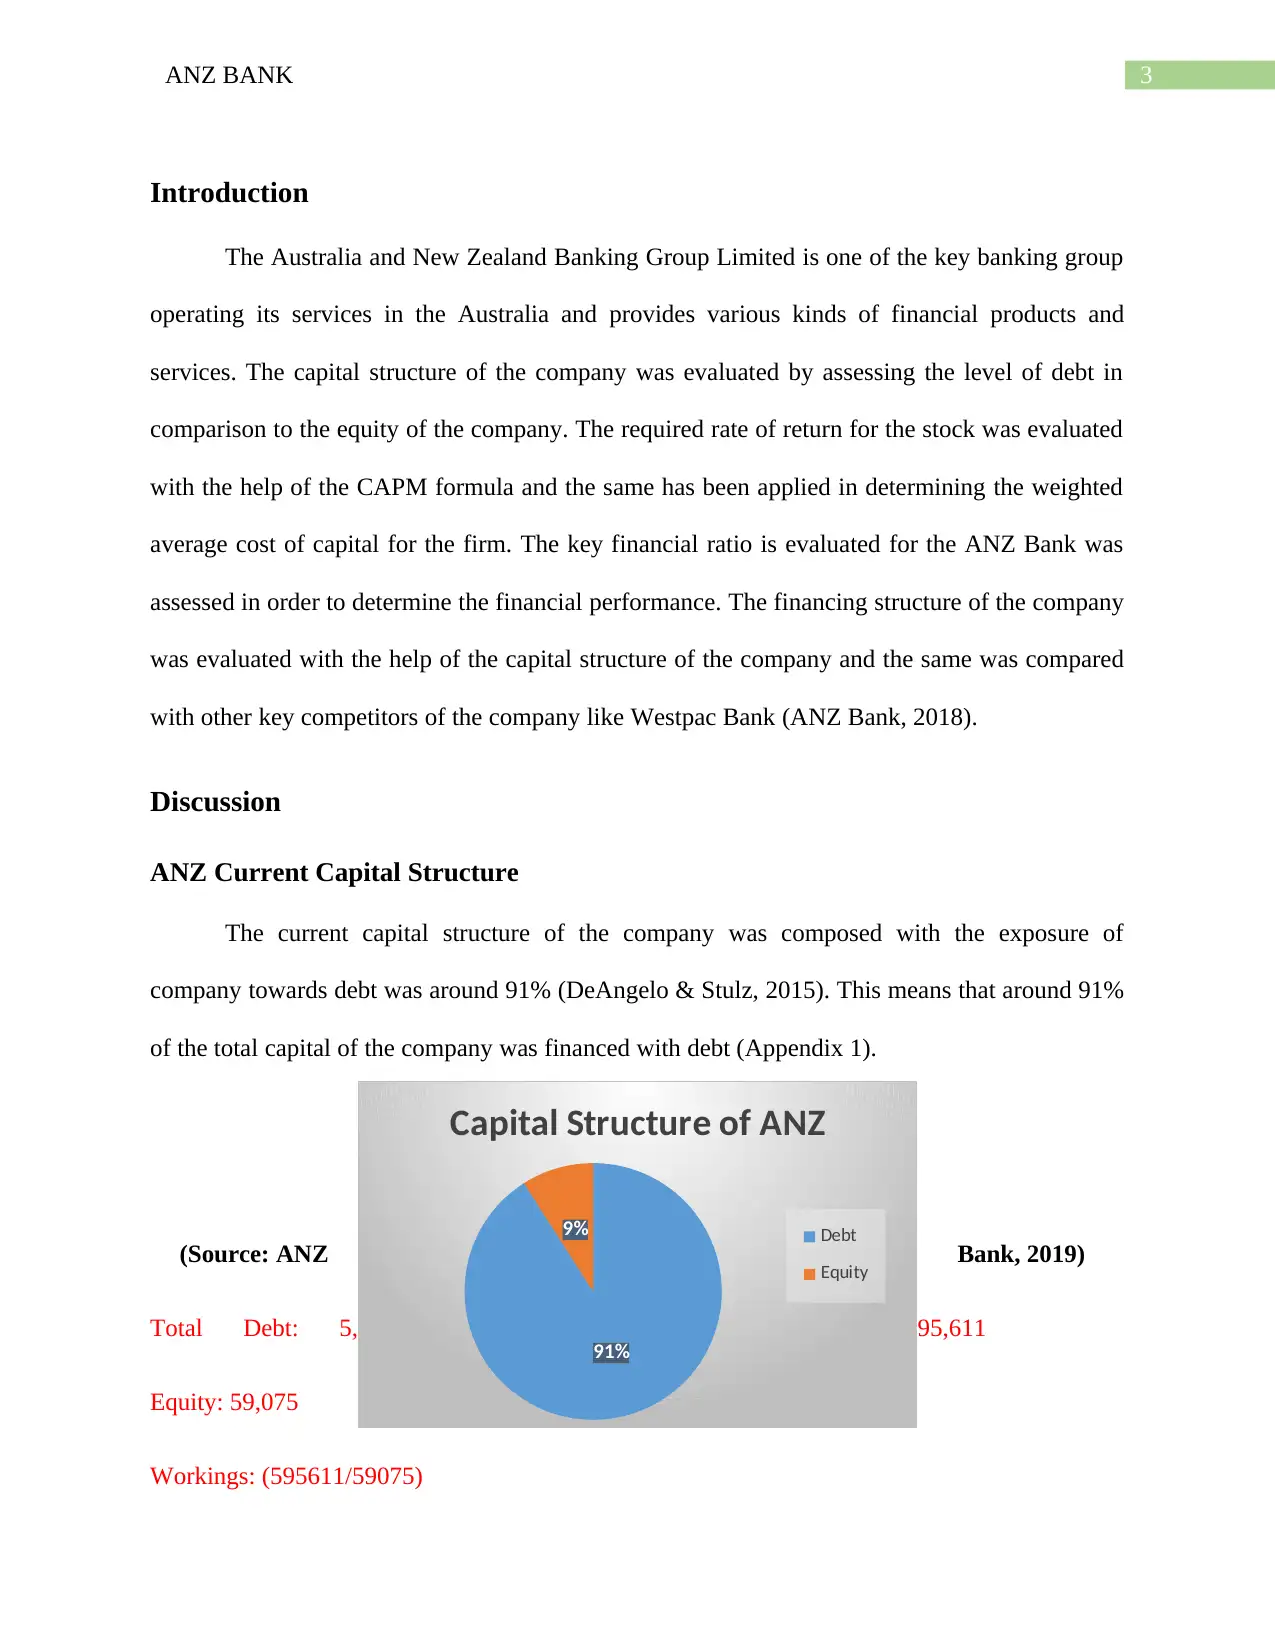
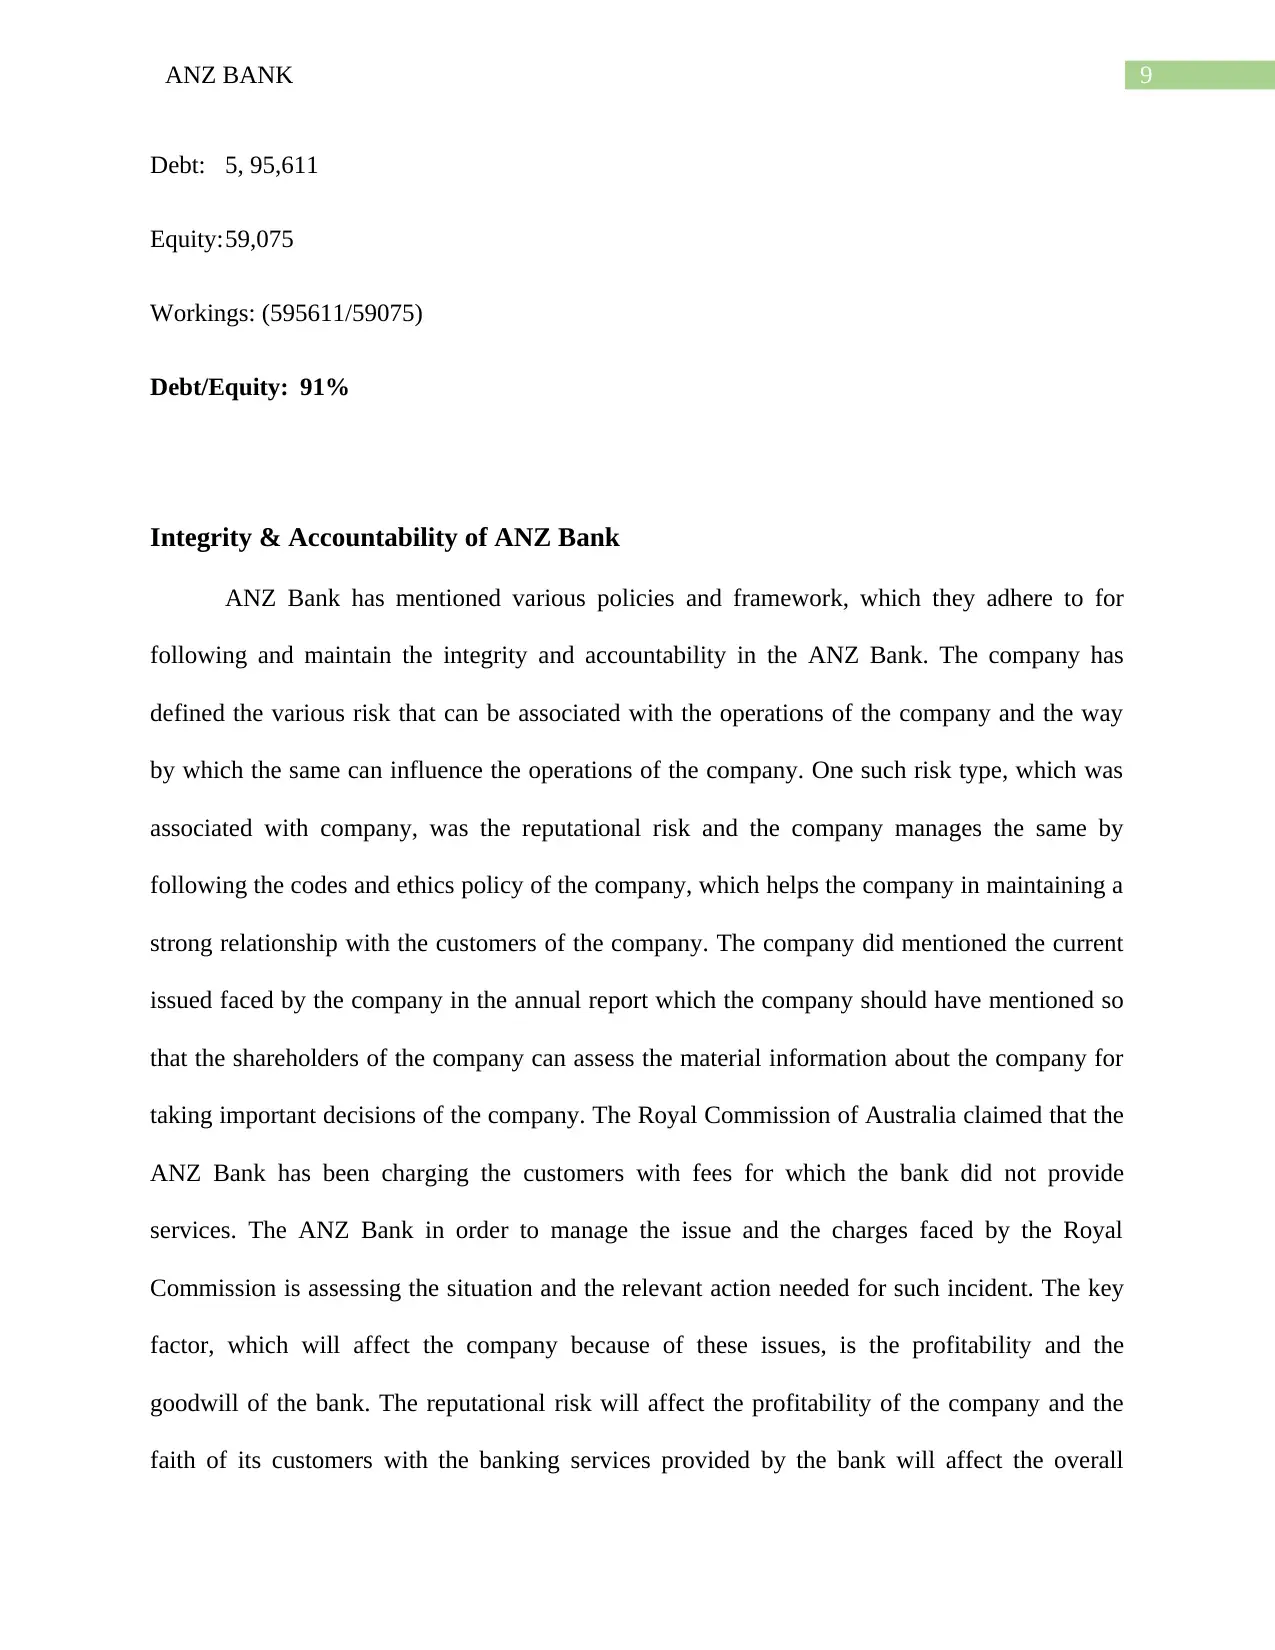
ANZ Current Capital Structure
The current capital structure of the company was composed with the exposure of
company towards debt was around 91% (DeAngelo & Stulz, 2015). This means that around 91%
of the total capital of the company was financed with debt (Appendix 1).
(Source: ANZ Bank, 2019)
Total Debt: 5, 95,611
Equity: 59,075
Workings: (595611/59075)
91%
9%
Capital Structure of ANZ
Debt
Equity
Introduction
The Australia and New Zealand Banking Group Limited is one of the key banking group
operating its services in the Australia and provides various kinds of financial products and
services. The capital structure of the company was evaluated by assessing the level of debt in
comparison to the equity of the company. The required rate of return for the stock was evaluated
with the help of the CAPM formula and the same has been applied in determining the weighted
average cost of capital for the firm. The key financial ratio is evaluated for the ANZ Bank was
assessed in order to determine the financial performance. The financing structure of the company
was evaluated with the help of the capital structure of the company and the same was compared
with other key competitors of the company like Westpac Bank (ANZ Bank, 2018).
Discussion
ANZ Current Capital Structure
The current capital structure of the company was composed with the exposure of
company towards debt was around 91% (DeAngelo & Stulz, 2015). This means that around 91%
of the total capital of the company was financed with debt (Appendix 1).
(Source: ANZ Bank, 2019)
Total Debt: 5, 95,611
Equity: 59,075
Workings: (595611/59075)
91%
9%
Capital Structure of ANZ
Debt
Equity
Secure Best Marks with AI Grader
Need help grading? Try our AI Grader for instant feedback on your assignments.
4ANZ BANK
Debt/Equity (2017): 91%
Total Debt: 5, 88,195
Equity 57,927
Workings (588195/57927)
Debt/Equity (2016): 91%
Weighted Average Cost of Capital
The weighted average cost of capital for the firm was evaluated with the formula:
Weighted Average Cost of Capital: (Weight of Equity*Cost of Equity) + ((Weight of Debt*Cost
of Debt)*(1-tax rate)).
The cost of equity for the company was evaluated with the help of the CAPM formula
and the cost of debt was calculated with the help of interest level paid by the company on the
long-term liabilities of the company (Appendix 2). The WACC for ANZ was 2.39% (Magni,
2015).
WACC: (0.09*0.1039) ((0.91*0.0239)*(1-0.33)
WACC: (0.94)+((0.0218)*.66)
WACC: (0.94+1.45)
Weighted Average Cost of Capital: 2.39%
Capital Asset Pricing Model
The capital asset pricing model was applied for evaluating the required return on equity
for the ANZ Bank and the formula applied for evaluating the same was:
5ANZ BANK
CAPM = Risk Free Rate of Return + Beta*(Return on Market-Risk Free Rate of Return)
The risk free rate of return taken for the analysis was the 10-year government bond rate
for evaluating the return (Barberis et al. 2015). The required return on equity was around 10.39%
and the beta of the stock was around 1.37 times that reflects that the stock is quite risky when
compared to the benchmark index (Appendix 3) (ANZ Bank, 2019).
Capital Asset Pricing Model (CAPM): Risk Free Rate of Return + Beta*(Return on Market-Risk
Free Rate of Return).
CAPM: (2.27% + (1.37*(8.20%-2.27%))).
CAPM: (2.27%+ (1.37*5.93%))
CAPM: (2.27%+ 8.124%)
CAPM: 10.39%.
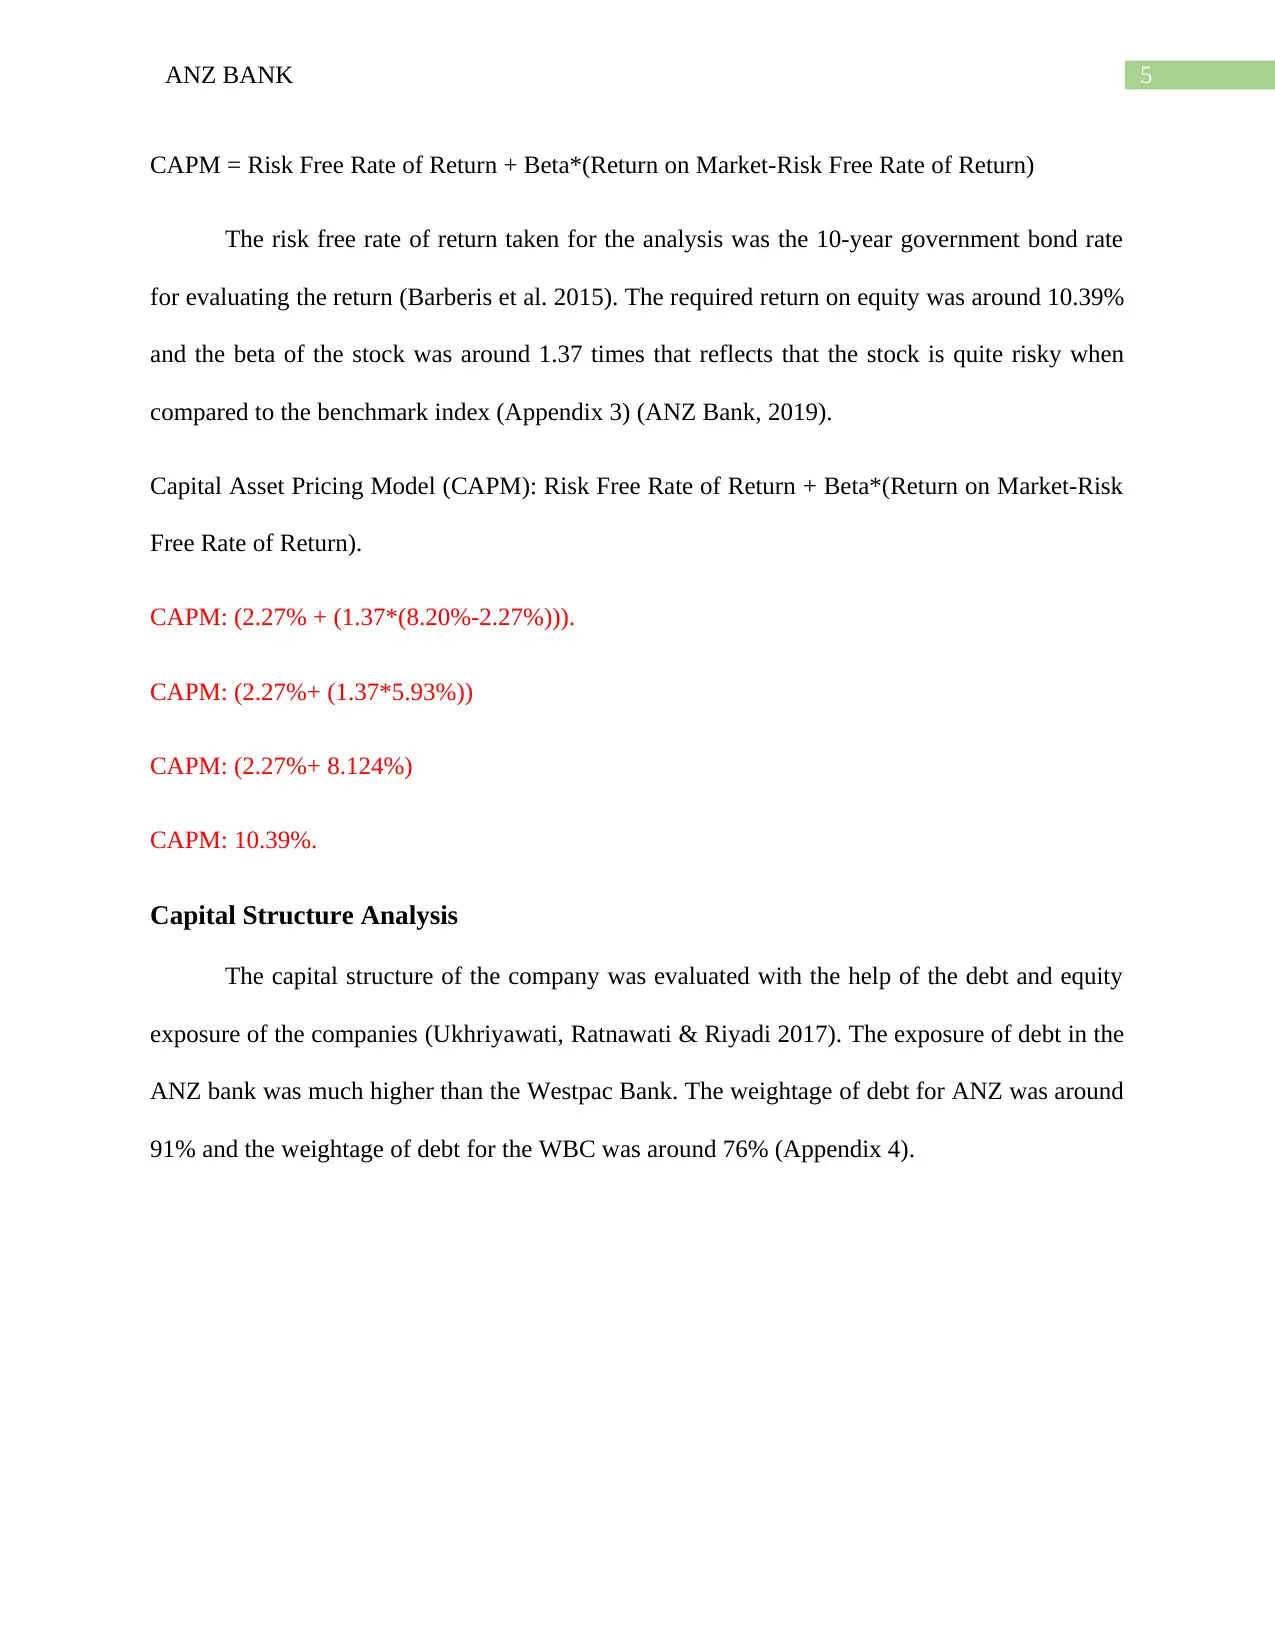
Capital Structure Analysis
The capital structure of the company was evaluated with the help of the debt and equity
exposure of the companies (Ukhriyawati, Ratnawati & Riyadi 2017). The exposure of debt in the
ANZ bank was much higher than the Westpac Bank. The weightage of debt for ANZ was around
91% and the weightage of debt for the WBC was around 76% (Appendix 4).
CAPM = Risk Free Rate of Return + Beta*(Return on Market-Risk Free Rate of Return)
The risk free rate of return taken for the analysis was the 10-year government bond rate
for evaluating the return (Barberis et al. 2015). The required return on equity was around 10.39%
and the beta of the stock was around 1.37 times that reflects that the stock is quite risky when
compared to the benchmark index (Appendix 3) (ANZ Bank, 2019).
Capital Asset Pricing Model (CAPM): Risk Free Rate of Return + Beta*(Return on Market-Risk
Free Rate of Return).
CAPM: (2.27% + (1.37*(8.20%-2.27%))).
CAPM: (2.27%+ (1.37*5.93%))
CAPM: (2.27%+ 8.124%)
CAPM: 10.39%.
Capital Structure Analysis
The capital structure of the company was evaluated with the help of the debt and equity
exposure of the companies (Ukhriyawati, Ratnawati & Riyadi 2017). The exposure of debt in the
ANZ bank was much higher than the Westpac Bank. The weightage of debt for ANZ was around
91% and the weightage of debt for the WBC was around 76% (Appendix 4).
6ANZ BANK
ANZ WBC
0%
10%
20%
30%
40%
50%
60%
70%
80%
90%
100%
Capital Structure of ANZ & WBC
Debt Equity
Debt/Equity Exposure in WBC
Debt: 1, 83,574
Equity: 58,120
Workings: (183574/58120)
Debt/Equity: 76%
Debt/Equity Exposure in ANZ
Debt: 5, 95,611
Equity:59,075
Workings: (595611/59075)
Debt/Equity: 91%
ANZ WBC
0%
10%
20%
30%
40%
50%
60%
70%
80%
90%
100%
Capital Structure of ANZ & WBC
Debt Equity
Debt/Equity Exposure in WBC
Debt: 1, 83,574
Equity: 58,120
Workings: (183574/58120)
Debt/Equity: 76%
Debt/Equity Exposure in ANZ
Debt: 5, 95,611
Equity:59,075
Workings: (595611/59075)
Debt/Equity: 91%
Paraphrase This Document
Need a fresh take? Get an instant paraphrase of this document with our AI Paraphraser
7ANZ BANK
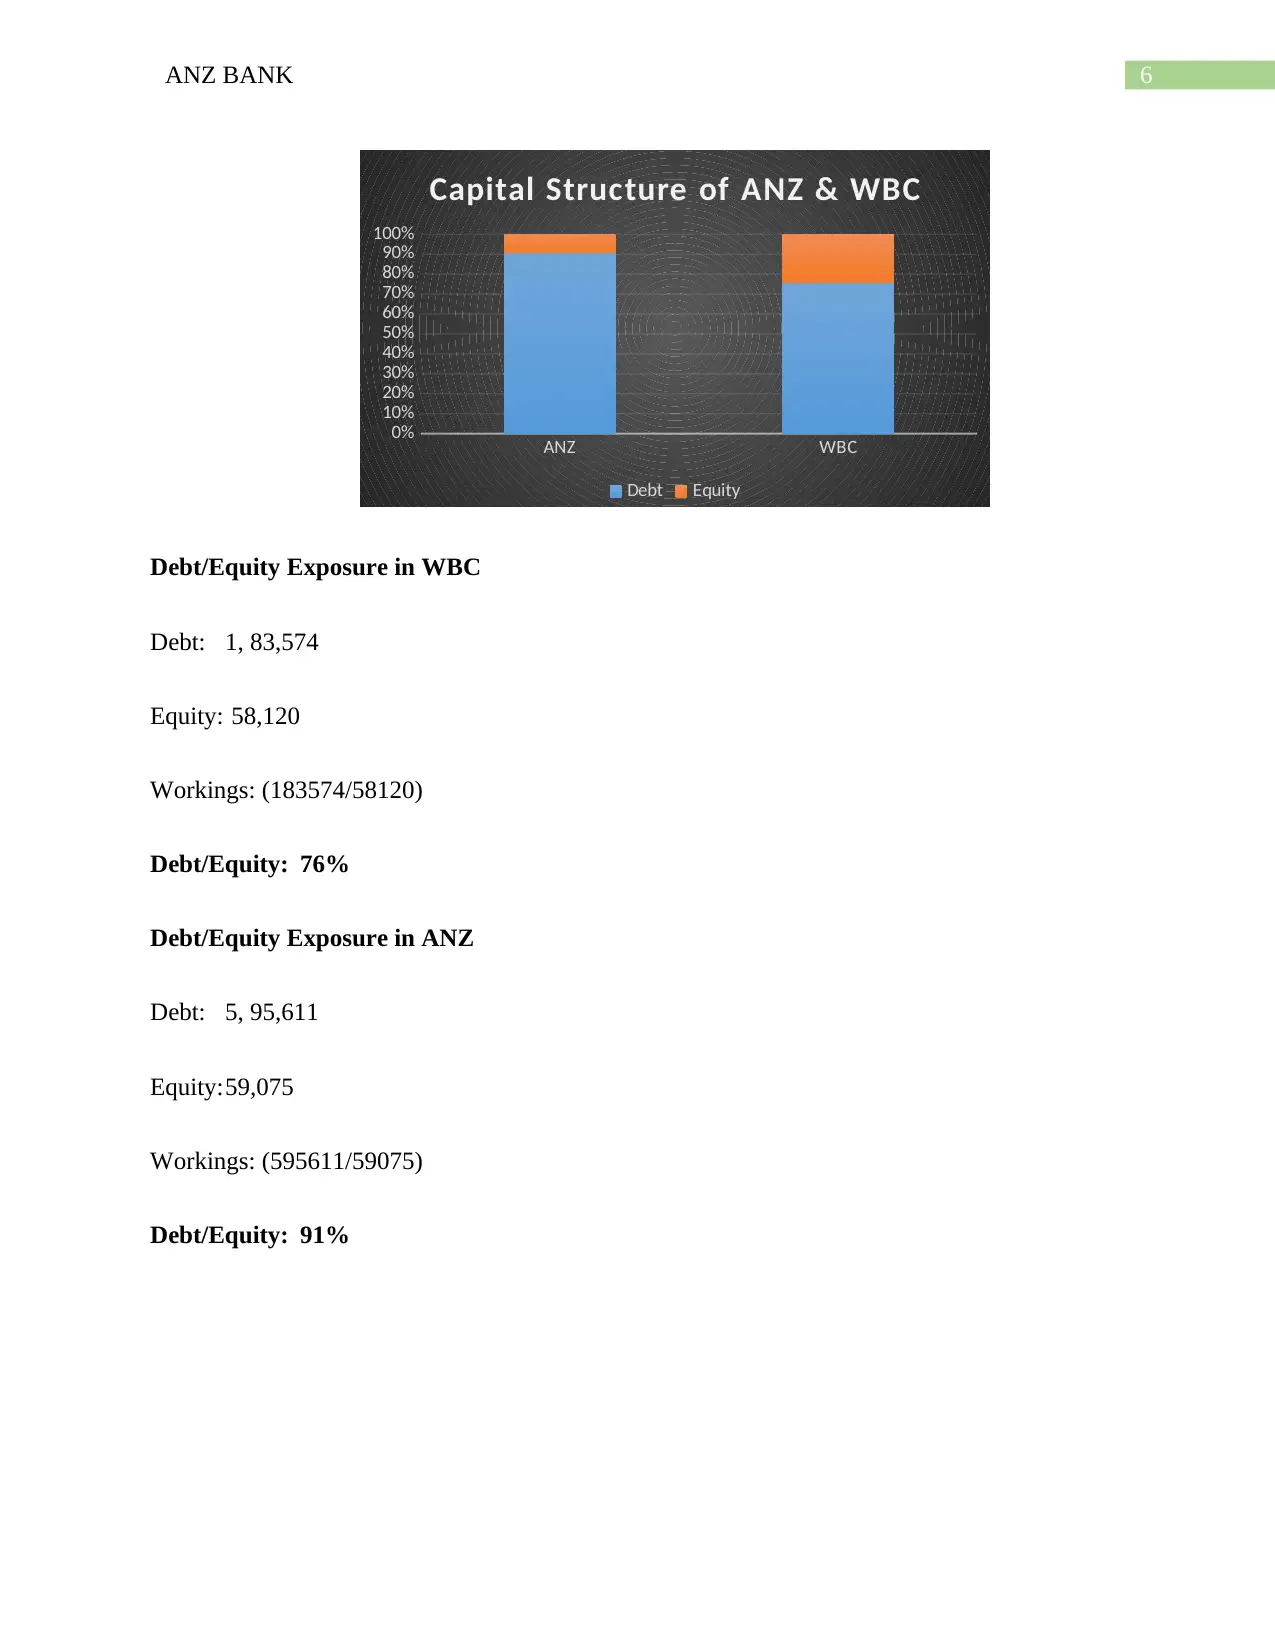
Ratio Analysis
The ratio analysis for company was evaluated for assessing the financial performance of
the ANZ Bank. The current ratio, return on capital employed, solvency ratio, quick ratio and the
investors ratio was assessed for assessing financial performance (Uechi et al. 2015). The
liquidity and profitability ratio was taken into consideration for evaluating performance of the
stocks as the same are crucial for the operations and financial position of the ANZ Bank
(Appendix 5).
Ratio Analysis of ANZ Bank
Profitability Ratio
Earnings before Interest and Tax 6,421
Capital Employed 58,959
(EBIT/Capital Employed) 6421/58959
Return on capital employed 10.89%
Gearing/Capital Structure Ratio
Debt 5,95,611
Equity 58,959
(Debt/Equity) 595611/58959
Debt to Total Capital 90.99%
Liquidity Ratio
Current Assets 1,11,653
Current Liabilities 15,833
(CA/CL) 111653/15833
Current Ratio 7.05
Cash 68,048
Trading Securities 43,605
Current Liabilities 15,833
(Cash+ Trading Securities/Current Liabilities) (68048+43605/15833)
Quick Ratio 2.75
Investor's Ratio
Net Income 6,421
No. of Outstanding Shares 29103
(Net Income/Outstanding Shares) 6421/29103
Earning's Per Share (In Cents) 0.221
8ANZ BANK
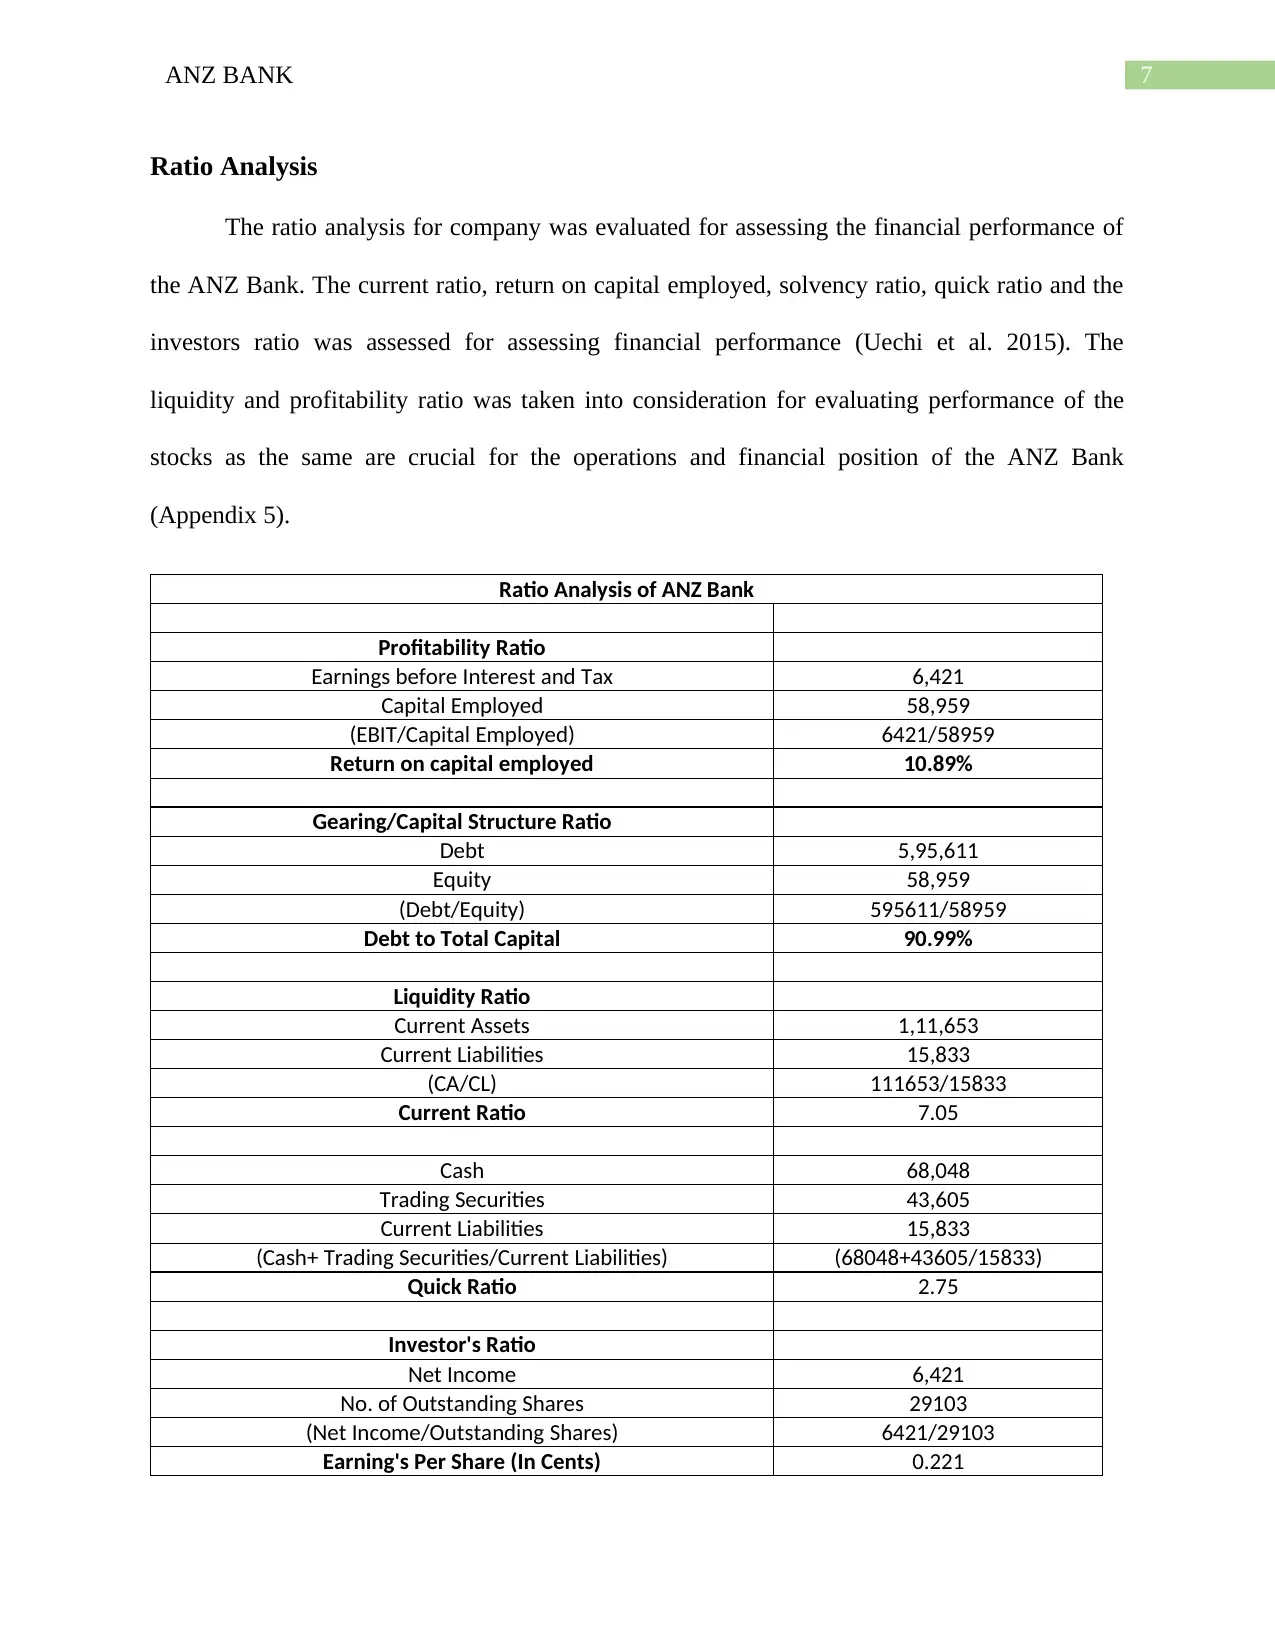
Changes of Capital Structure
ANZ bank has tried to maintain the same amount of debt and equity exposure in the last
three year with him, the amount of debt in the capital structure where the debt financing has
remained a priority for funding the capital requirement of the company (Allen, Carletti &
Marquez, 2015). The weightage of debt in contrast to other capital sources like equity has
remained stable with weightage given around 91%.
ANZ WBC
0%
10%
20%
30%
40%
50%
60%
70%
80%
90%
100%
Capital Structure of ANZ & WBC
Debt Equity
Debt/Equity Exposure in WBC
Debt: 1, 83,574
Equity: 58,120
Workings: (183574/58120)
Debt/Equity: 76%
Debt/Equity Exposure in ANZ
9ANZ BANK
Debt: 5, 95,611
Equity:59,075
Workings: (595611/59075)
Debt/Equity: 91%
Integrity & Accountability of ANZ Bank
ANZ Bank has mentioned various policies and framework, which they adhere to for
following and maintain the integrity and accountability in the ANZ Bank. The company has
defined the various risk that can be associated with the operations of the company and the way
by which the same can influence the operations of the company. One such risk type, which was
associated with company, was the reputational risk and the company manages the same by
following the codes and ethics policy of the company, which helps the company in maintaining a
strong relationship with the customers of the company. The company did mentioned the current
issued faced by the company in the annual report which the company should have mentioned so
that the shareholders of the company can assess the material information about the company for
taking important decisions of the company. The Royal Commission of Australia claimed that the
ANZ Bank has been charging the customers with fees for which the bank did not provide
services. The ANZ Bank in order to manage the issue and the charges faced by the Royal
Commission is assessing the situation and the relevant action needed for such incident. The key
factor, which will affect the company because of these issues, is the profitability and the
goodwill of the bank. The reputational risk will affect the profitability of the company and the
faith of its customers with the banking services provided by the bank will affect the overall
Secure Best Marks with AI Grader
Need help grading? Try our AI Grader for instant feedback on your assignments.
10ANZ BANK
revenue of the company. ANZ Bank also said that they are taking several steps in order to bring
a transparency amongst the customers so that the same will ensure that the balance between the
earnings and the services provided by the bank. The ANZ Bank also ensured that it would be
compensating those suffered from such unfair play activities. The Management of the company
is doing all possible steps for restoring the confidence of the customers in the banking services
provided by the ANZ Bank.
Conclusion
The financial analysis of the ANZ Bank was assessed for the year 2017 and the financial
performance in the field of profitability was assessed where ANZ Bank is providing a sound
returns for the shareholders of the company. The liquidity position of the company was also
assessed to be at a significant level for the company. The company has also tried to maintain the
accountability and integrity by taking up various actions and policies for maintain the reputation
of the ANZ Bank amongst the customers of the bank.
11ANZ BANK
Reference
Allen, F., Carletti, E., & Marquez, R. (2015). Deposits and bank capital structure. Journal of
Financial Economics, 118(3), 601-619.
ANZ Bank. (2018). ANZ 2017 ANNUAL REPORT [Ebook]. Australia. Retrieved from
https://shareholder.anz.com/sites/default/files/2017_anz_annual_report.pdf
ANZ Bank. (2019). Retrieved from https://in.finance.yahoo.com/quote/ANZ.AX/history/
Barberis, N., Greenwood, R., Jin, L., & Shleifer, A. (2015). X-CAPM: An extrapolative capital
asset pricing model. Journal of financial economics, 115(1), 1-24.
Dagher, J., & Kazimov, K. (2015). Banks׳ liability structure and mortgage lending during the
financial crisis. Journal of Financial Economics, 116(3), 565-582.
DeAngelo, H., & Stulz, R. M. (2015). Liquid-claim production, risk management, and bank
capital structure: Why high leverage is optimal for banks. Journal of Financial
Economics, 116(2), 219-236.
Magni, C. A. (2015). Investment, financing and the role of ROA and WACC in value creation.
European Journal of Operational Research, 244(3), 855-866.
Uechi, L., Akutsu, T., Stanley, H. E., Marcus, A. J., & Kenett, D. Y. (2015). Sector dominance
ratio analysis of financial markets. Physica A: Statistical Mechanics and its Applications,
421, 488-509.
Ukhriyawati, C. F., Ratnawati, T., & Riyadi, S. (2017). The Influence of Asset Structure, Capital
Structure, Risk Management and Good Corporate Governance on Financial Performance
and Value of The Firm through Earnings and Free Cash Flow As An Intervening Variable

12ANZ BANK
in Banking Companies Listed in Indonesia Stock Exchange. International Journal of
Business and Management, 12(8), 249.
in Banking Companies Listed in Indonesia Stock Exchange. International Journal of
Business and Management, 12(8), 249.
Paraphrase This Document
Need a fresh take? Get an instant paraphrase of this document with our AI Paraphraser
13ANZ BANK
Appendix
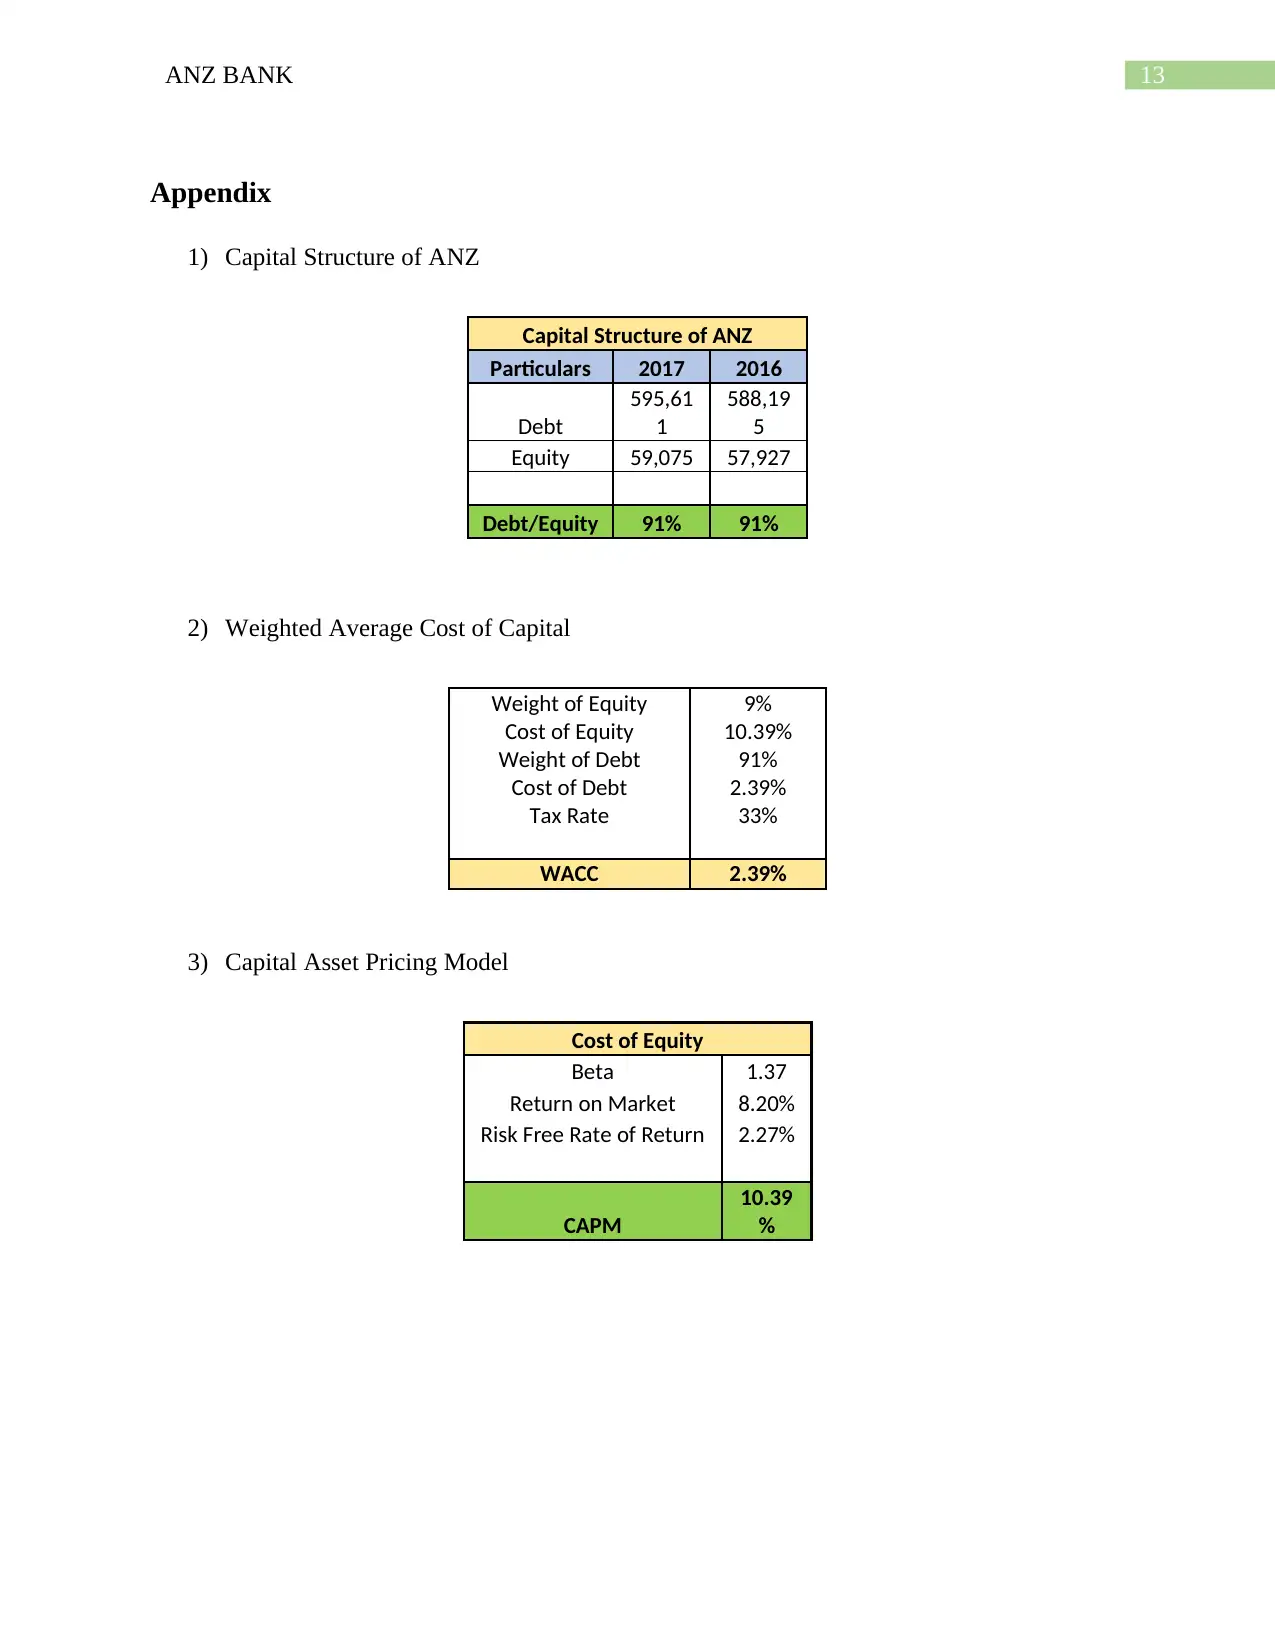
1) Capital Structure of ANZ
Capital Structure of ANZ
Particulars 2017 2016
Debt
595,61
1
588,19
5
Equity 59,075 57,927
Debt/Equity 91% 91%
2) Weighted Average Cost of Capital
Weight of Equity 9%
Cost of Equity 10.39%
Weight of Debt 91%
Cost of Debt 2.39%
Tax Rate 33%
WACC 2.39%
3) Capital Asset Pricing Model
Cost of Equity
Beta 1.37
Return on Market 8.20%
Risk Free Rate of Return 2.27%
CAPM
10.39
%
Appendix
1) Capital Structure of ANZ
Capital Structure of ANZ
Particulars 2017 2016
Debt
595,61
1
588,19
5
Equity 59,075 57,927
Debt/Equity 91% 91%
2) Weighted Average Cost of Capital
Weight of Equity 9%
Cost of Equity 10.39%
Weight of Debt 91%
Cost of Debt 2.39%
Tax Rate 33%
WACC 2.39%
3) Capital Asset Pricing Model
Cost of Equity
Beta 1.37
Return on Market 8.20%
Risk Free Rate of Return 2.27%
CAPM
10.39
%

14ANZ BANK
4) Capital Structure of ANZ and WBC
5) Ratio Analysis
Ratio Analysis of ANZ Bank
Profitability Ratio
Earnings before Interest and
Tax 6,421
Capital Employed 58,959
Return on capital employed 10.89%
Gearing/Capital Structure Ratio
Debt
595,61
1
Equity 58,959
Debt to Total Capital 90.99%
Liquidity Ratio
Current Assets
111,65
3
Current Liabilities 15,833
Current Ratio 7.05
Cash 68,048
Trading Securities 43,605
Current Liabilities 15,833
Quick Ratio 2.75
Investor's Ratio
Net Income 6,421
No. of Outstanding Shares 29103
Particulars ANZ WBC
Debt 595,611 183,574
Equity 59,075 58,120
Debt/Equity 91% 76%
Capital Structure of ANZ & WBC

15ANZ BANK
Earning's Per Share (In Cents) 0.221
Earning's Per Share (In Cents) 0.221
1 out of 16


Your All-in-One AI-Powered Toolkit for Academic Success.
+13062052269
info@desklib.com
Available 24*7 on WhatsApp / Email
![[object Object]](/_next/static/media/star-bottom.7253800d.svg)
Unlock your academic potential
© 2024 | Zucol Services PVT LTD | All rights reserved.