Ask a question from expert
ACCT 502 Global airline Assignment
10 Pages3346 Words133 Views
Added on 2021-04-24
ACCT 502 Global airline Assignment
Added on 2021-04-24
BookmarkShareRelated Documents
ACCT 502, Spring 2018IntroductionThis project requires you to use information about Alaska Air Group to examine issues related to cost behavior,revenue drivers, and profit estimation. For those who are unfamiliar with Alaska Air, I have included theirsummary of business from a recent 10-K below. The Excel file contains historical information from 2004 to 2016for the consolidated operations, which encompasses subsidiaries Alaska Airlines and Horizon Airlines. The filecontains a variety of operating expenses (the costs) and several potential cost drivers (revenue passengermiles, available seat miles, and average number of full-time equivalent employees) as well as historical non-company data (GDP, population numbers etc.).Excerpt from Alaska Air Group’s 2016 10-K describing their businessAir Group operates Alaska, Virgin America and Horizon Air. We completed the acquisition of Virgin America onDecember 14, 2016, at which time Virgin America became our wholly-owned subsidiary. Together with ourregional partner airlines, we fly to 118 destinations with nearly 1,200 daily departures through our expansivenetwork across the United States, Mexico, Canada, Costa Rica and Cuba. With our global airline partners, wecan provide our guests with a virtual network of more than 900 destinations worldwide. During 2016, wecarried an all-time high 34 million guests and earned adjusted net income of $911 million, which includesoperating and financial results for Virgin America for the period December 14, 2016 through December 31,2016, and excludes pretax special items and merger-related costs of $117 million.Our acquisition of Virgin America positions us as the fifth largest airline in the U.S., with an unparalleled abilityto serve West Coast travelers. Virgin America provides a platform for growth of our low-fare, premium productproviding a powerful West Coast network for our guests as well as enhanced international partnerships.Additionally, Virgin America provides an opportunity to grow and improve our loyalty program while gainingaccess to constrained gates, particularly on the East Coast. The combined company now provides more seatsfrom the West Coast than any other carrier, allowing us to serve our guests better.Our mission is "creating an airline people love." The "ing" is to recognize we are never done—we arecontinually working to get better. We believe our success depends on our ability to provide safe airtransportation, develop relationships with guests by providing exceptional customer service and low fares, andmaintain a low cost structure to compete effectively. It is important to us that we achieve our objective as asocially responsible company that values not just our performance, but also our people, our community andour environment.Policy on Academic HonestyThis is an individual assignment. You can ask me for assistance, but you are not to work with other students onthis project or seek answers from other students. This includes comparing answers. Doing so will constitute amajor violation of academic integrity standards and, if detected, will have serious consequences.By typing your name below, you assert that you have completed this project on your own:Enter text here1
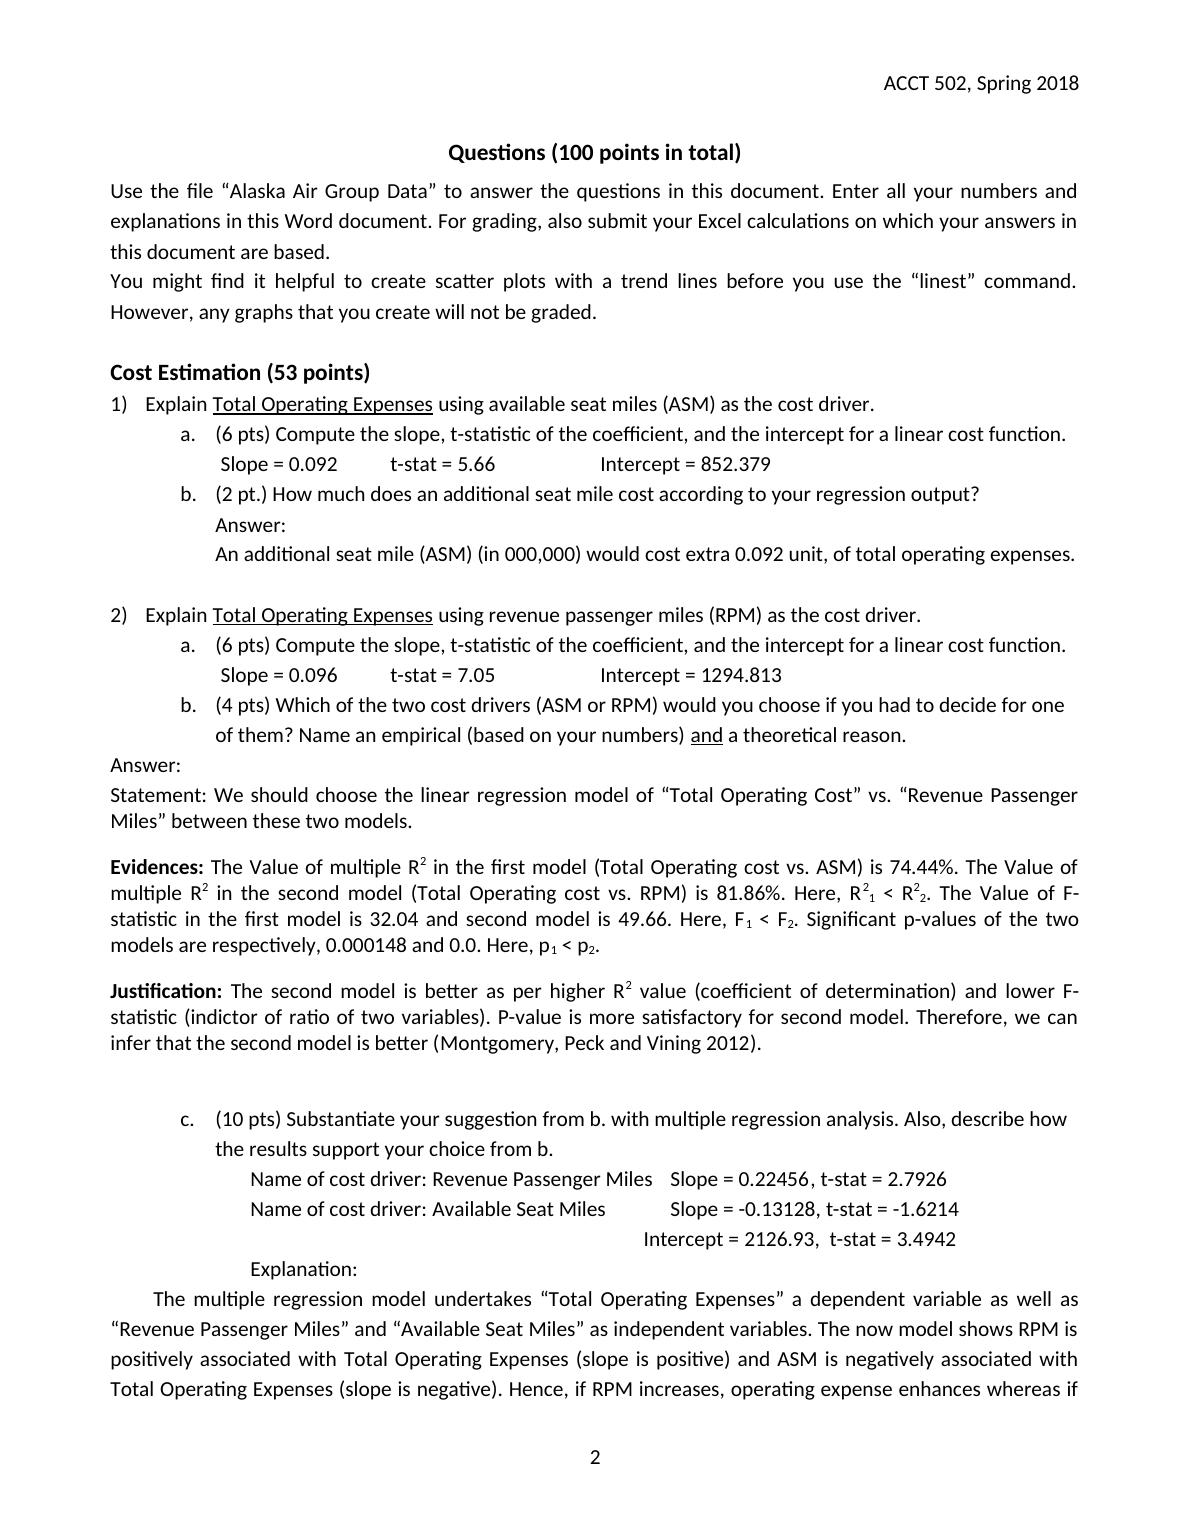
ACCT 502, Spring 2018Questions (100 points in total)Use the file “Alaska Air Group Data” to answer the questions in this document. Enter all your numbers andexplanations in this Word document. For grading, also submit your Excel calculations on which your answers inthis document are based.You might find it helpful to create scatter plots with a trend lines before you use the “linest” command.However, any graphs that you create will not be graded.Cost Estimation (53 points)1)Explain Total Operating Expenses using available seat miles (ASM) as the cost driver.a.(6 pts) Compute the slope, t-statistic of the coefficient, and the intercept for a linear cost function.Slope = 0.092t-stat =5.66Intercept =852.379b.(2 pt.) How much does an additional seat mile cost according to your regression output?Answer:An additional seat mile (ASM) (in 000,000) would cost extra 0.092 unit, of total operating expenses.2)Explain Total Operating Expenses using revenue passenger miles (RPM) as the cost driver.a.(6 pts) Compute the slope, t-statistic of the coefficient, and the intercept for a linear cost function.Slope = 0.096t-stat =7.05Intercept =1294.813b.(4 pts) Which of the two cost drivers (ASM or RPM) would you choose if you had to decide for one of them? Name an empirical (based on your numbers) and a theoretical reason.Answer:Statement: We should choose the linear regression model of “Total Operating Cost” vs. “Revenue PassengerMiles” between these two models. Evidences: The Value of multiple R2 in the first model (Total Operating cost vs. ASM) is 74.44%. The Value ofmultiple R2 in the second model (Total Operating cost vs. RPM) is 81.86%. Here, R21 < R22. The Value of F-statistic in the first model is 32.04 and second model is 49.66. Here, F1 < F2. Significant p-values of the twomodels are respectively, 0.000148 and 0.0. Here, p1 < p2. Justification: The second model is better as per higher R2 value (coefficient of determination) and lower F-statistic (indictor of ratio of two variables). P-value is more satisfactory for second model. Therefore, we caninfer that the second model is better (Montgomery, Peck and Vining 2012). c.(10 pts) Substantiate your suggestion from b. with multiple regression analysis. Also, describe how the results support your choice from b.Name of cost driver:Revenue Passenger MilesSlope =0.22456, t-stat =2.7926Name of cost driver:Available Seat MilesSlope =-0.13128, t-stat = -1.6214 Intercept =2126.93, t-stat = 3.4942Explanation:The multiple regression model undertakes “Total Operating Expenses” a dependent variable as well as“Revenue Passenger Miles” and “Available Seat Miles” as independent variables. The now model shows RPM ispositively associated with Total Operating Expenses (slope is positive) and ASM is negatively associated withTotal Operating Expenses (slope is negative). Hence, if RPM increases, operating expense enhances whereas if2
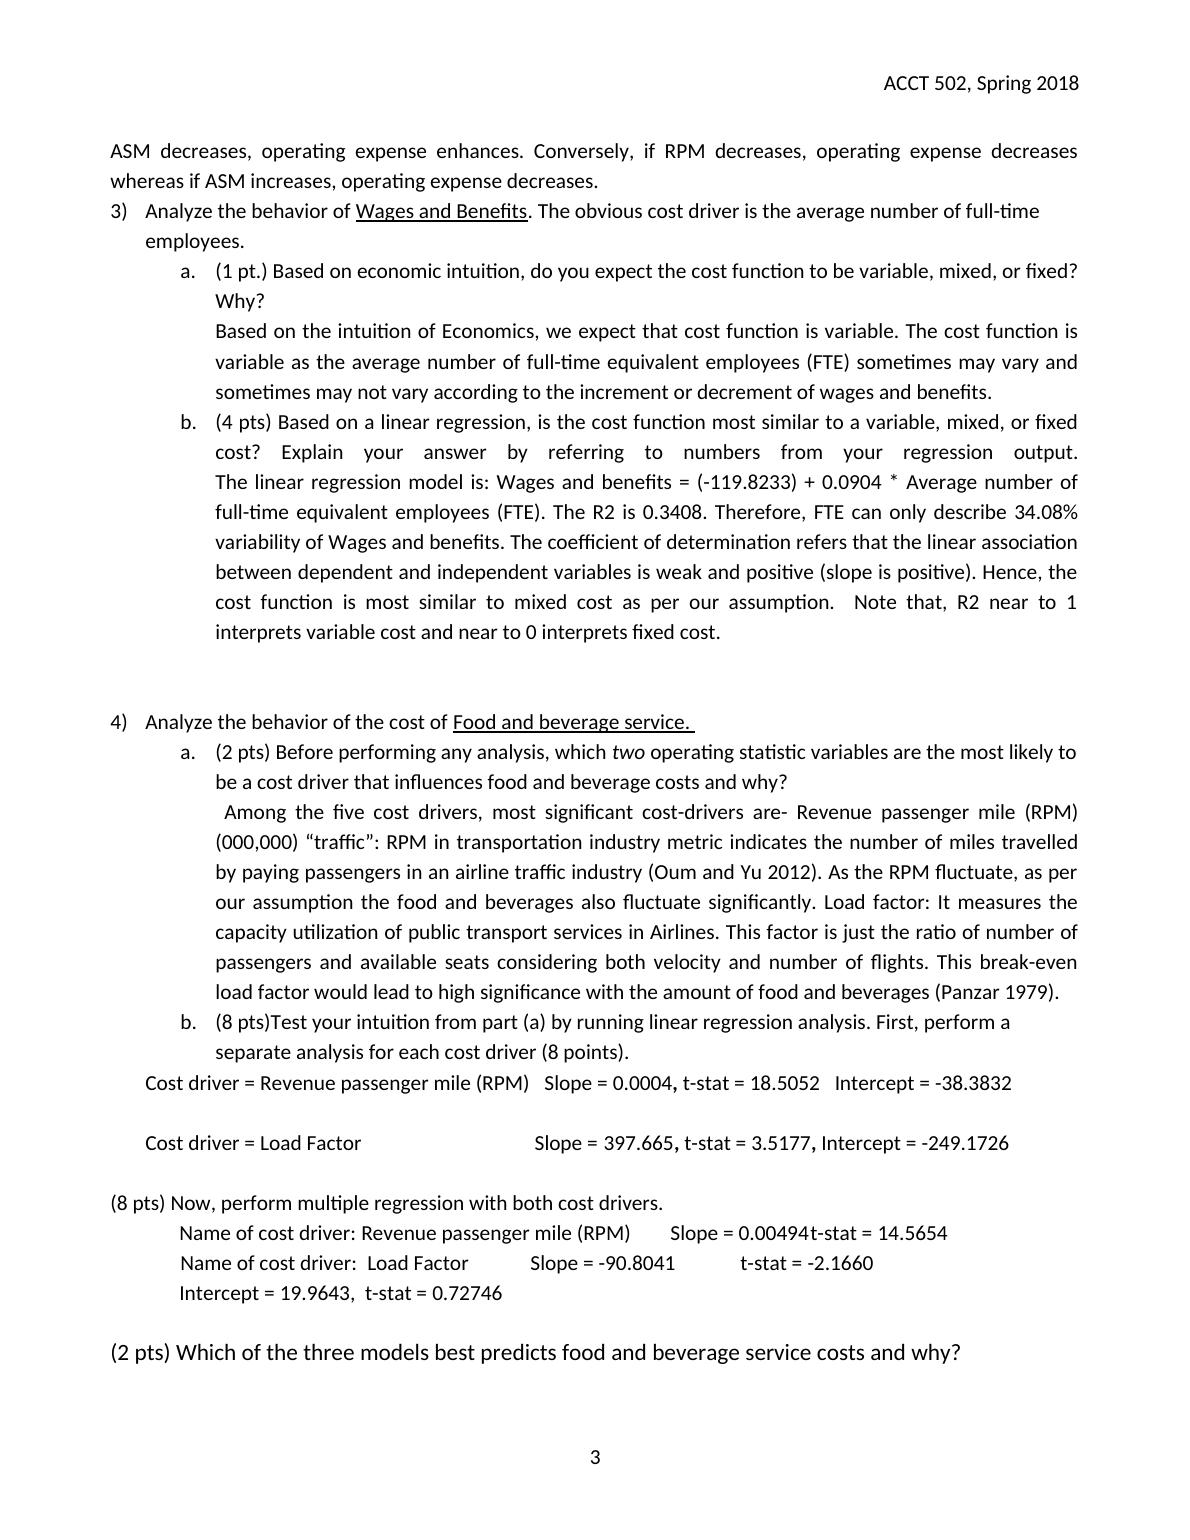
ACCT 502, Spring 2018ASM decreases, operating expense enhances. Conversely, if RPM decreases, operating expense decreaseswhereas if ASM increases, operating expense decreases. 3)Analyze the behavior of Wages and Benefits. The obvious cost driver is the average number of full-time employees. a.(1 pt.) Based on economic intuition, do you expect the cost function to be variable, mixed, or fixed?Why?Based on the intuition of Economics, we expect that cost function is variable. The cost function isvariable as the average number of full-time equivalent employees (FTE) sometimes may vary andsometimes may not vary according to the increment or decrement of wages and benefits. b.(4 pts) Based on a linear regression, is the cost function most similar to a variable, mixed, or fixedcost? Explain your answer by referring to numbers from your regression output.The linear regression model is: Wages and benefits = (-119.8233) + 0.0904 * Average number offull-time equivalent employees (FTE). The R2 is 0.3408. Therefore, FTE can only describe 34.08%variability of Wages and benefits. The coefficient of determination refers that the linear associationbetween dependent and independent variables is weak and positive (slope is positive). Hence, thecost function is most similar to mixed cost as per our assumption. Note that, R2 near to 1 interpretsvariable cost and near to 0 interprets fixed cost. 4)Analyze the behavior of the cost of Food and beverage service. a.(2 pts) Before performing any analysis, which two operating statistic variables are the most likely tobe a cost driver that influences food and beverage costs and why?Among the five cost drivers, most significant cost-drivers are- Revenue passenger mile (RPM)(000,000) “traffic”: RPM in transportation industry metric indicates the number of miles travelledby paying passengers in an airline traffic industry (Oum and Yu 2012). As the RPM fluctuate, as perour assumption the food and beverages also fluctuate significantly. Load factor: It measures thecapacity utilization of public transport services in Airlines. This factor is just the ratio of number ofpassengers and available seats considering both velocity and number of flights. This break-evenload factor would lead to high significance with the amount of food and beverages (Panzar 1979). b.(8 pts)Test your intuition from part (a) by running linear regression analysis. First, perform a separate analysis for each cost driver (8 points).Cost driver = Revenue passenger mile (RPM) Slope = 0.0004,t-stat =18.5052Intercept =-38.3832Cost driver = Load Factor Slope = 397.665, t-stat =3.5177, Intercept =-249.1726(8 pts) Now, perform multiple regression with both cost drivers. Name of cost driver:Revenue passenger mile (RPM)Slope =0.00494t-stat =14.5654Name of cost driver: Load FactorSlope =-90.8041t-stat = -2.1660Intercept =19.9643, t-stat = 0.72746(2 pts) Which of the three models best predicts food and beverage service costs and why?3
End of preview
Want to access all the pages? Upload your documents or become a member.
Related Documents
JetBlue Airlines Management | Assignmentlg...
|13
|2121
|16
WestJet Airline Operations Reportlg...
|5
|742
|57