Degree of Master of Science in Computer Science PDF
VerifiedAdded on 2021/08/19
|67
|16702
|228
AI Summary
Contribute Materials
Your contribution can guide someone’s learning journey. Share your
documents today.
ADDIS ABABA UNIVERSITY
COLLEGE OF NATURAL SCIENCES
DEPARTMENT OF COMPUTER SCIENCE
Misbehaving Public Transport Drivers Reporting System Using
Smart Phone
Shimels Bizuneh
A Project Paper Submitted to Department of Computer Science in Partial
Fulfillment of the Requirements for the Degree of Master of Science in Computer
Science
Addis Ababa, Ethiopia
October 30, 2019
Secure Best Marks with AI Grader
Need help grading? Try our AI Grader for instant feedback on your assignments.
ADDIS ABABA UNIVERSITY
COLLEGE OF NATURAL SCIENCE
Misbehaving Public Transport Drivers Reporting System Using
Smart Phone
Advisor: Dida Midekso(PHD)
This is to certify that the project prepared by Shimels Bizuneh, titled: Misbehaving public
transport drivers reporting system using smart phone and submitted in partial fulfillment of the
requirements for the Degree of Master of Science in Computer Science complies with the
regulations of the University and meets the accepted standards with respect to originality and
quality.
Signed by the Examining Committee:
Name Signature Date
Advisor: ______________________ _______________ ____________
Examiner_____________________ _______________ ____________
Examiner: ____________________ _______________ ____________
Abstract
People use different transportation methods to move from one place to another for different
reasons. Public transportation, taxi and bus, is widely used for moving many people from one
place to another. Many people live in Addis Ababa use these public transportations for their day
to day activities. As public transportation has many benefits, it has problems that affect the
passenger and sometime the reason to injure, disable and kill many people.
Most of the problems are caused by drivers, some of them are, over speed, overload, drunk and
other. People face these problems every day and they don’t have easy way to report these
problems to the right authority.
This project is done to reduce the problems and accidents mentioned above on public transport
cars, taxis and bus, by providing an easy way to passengers and others to report on the drivers’
bad behavior and actions during driving to the traffic polices using smart phone.
The system has been tested on sample data in some area of Addis Ababa. It found that the system
is working as expected and help the passengers to report the problems that they face while they
use public transport cars.
Keywords:
Public transport, Misbehave drivers, Bad behavior drivers, Traffic accidents, Passengers,
Reporting system.
Acknowledgment
First and foremost, I would like to thank the almighty God who blessed me in every step of my
life.
A big thank to my advisor Dr. Dida Midekso. This project would not be successfully completed
without the guidance, supervision and advice of you. You have supported me throughout my
project with your valuable insights, knowledge and patience. I have learned a lot from you; thank
you very much again.
My special heartily thanks and love to my wife, Birtukan Belayneh, whose encouragement and
unreserved support helped me to complete my work successfully. It is my great pleasure to have
you in my life.
Secure Best Marks with AI Grader
Need help grading? Try our AI Grader for instant feedback on your assignments.
i
Contents
List of Tables ..................................................................................................................................... iii
List of Figures .................................................................................................................................... iv
Abbreviations .................................................................................................................................... v
Chapter One: Introduction .................................................................................................................1
1.1 Background ................................................................................................................................... 1
1.2 Motivation ..................................................................................................................................... 2
1.3 Statement of the Problem ............................................................................................................ 2
1.4 Objectives...................................................................................................................................... 3
1.5 Methodology ................................................................................................................................. 3
1.6 Scope and Limitations ................................................................................................................... 4
1.7 Application Results ........................................................................................................................ 4
1.8 Organization of the Document ..................................................................................................... 5
Chapter Two: Literature Review .........................................................................................................6
2.1 Public Transport ............................................................................................................................ 6
2.2 Misbehaving Derivers ................................................................................................................... 6
2.3 Reporting system .......................................................................................................................... 7
2.4 Global Positioning System(GPS) .................................................................................................... 7
2.5 Mobile Internet ............................................................................................................................. 8
2.6 Short Message Service (SMS) ........................................................................................................ 8
2.7 ODK Collect ................................................................................................................................... 9
2.8 OpenStreetMap(OSM) .................................................................................................................. 9
Chapter Three: Related Work ........................................................................................................... 10
3.1 Detecting Aggressive Deriving using smart phone ..................................................................... 10
Chapter Four: System Analysis ......................................................................................................... 13
3.1 Overview ..................................................................................................................................... 13
3.2 Functional Requirement ............................................................................................................. 13
3.3 Non Functional Requirement ...................................................................................................... 13
3.4 System Model ............................................................................................................................. 14
3.4.1 Use Case Diagram ................................................................................................................... 14
3.4.2 Class Diagram .......................................................................................................................... 23
ii
3.4.3 Sequence Diagram .................................................................................................................. 24
Chapter Five: System Design ............................................................................................................ 27
5.1 Design Goal ................................................................................................................................ 27
5.2 Architecture ................................................................................................................................. 28
5.3 Subsystem Decomposition with Services ................................................................................... 29
5.4 Hardware/Software Mapping ...................................................................................................... 31
5.5 Persistent data management ........................................................................................................ 33
5.6 Access Control and Security ....................................................................................................... 34
Chapter six: Implementation ............................................................................................................ 35
6.1 Development Environment and Tools .............................................................................................. 35
6.2 Screenshots of the Web application ................................................................................................. 35
6.3 Screenshots of the Mobile Phone Application.................................................................................. 38
6.4 Testing and Evaluation ...................................................................................................................... 39
Chapter Seven: Conclusion and Future Work .................................................................................... 44
7.1 Conclusion ........................................................................................................................................ 44
7.2. Future Work ..................................................................................................................................... 45
References ....................................................................................................................................... 46
Annex A: sequence diagram for Add misbehave driver info ............................................................... 48
ANNEX B: Sequence diagram for display the location of report sender .............................................. 49
ANNEX C: Sequence diagram for display traffic police information .................................................... 50
ANNEX D: Sequence diagram for add the current GPS location .......................................................... 51
ANNEX E: Sequence diagram for update traffic police information .................................................... 52
ANNEX F: Sequence diagram for update Misbehavior ....................................................................... 53
ANNEX G: Sequence diagram for generate report ............................................................................. 54
ANNEX H: Sample Source code ......................................................................................................... 55
ANNEX I: Interview Questions .......................................................................................................... 58
iii
List of Tables
Table 4 1 Login ........................................................................................................................................... 17
Table 4 2 Register user ............................................................................................................................... 17
Table 4 3 Create misbehaving driver information ...................................................................................... 18
Table 4 4 Add the current traffic police location ........................................................................................ 18
Table 4 5 Recieve SMS ............................................................................................................................... 19
Table 4 6 Register traffic police information .............................................................................................. 19
Table 4 7 Update the location of traffic police ........................................................................................... 20
Table 4 8 Register the list of the driver misbehavior .................................................................................. 20
Table 4 9 Update the main cause of accident .............................................................................................. 21
Table 4 10 Display the location of traffic police ........................................................................................ 21
Table 4 11 Display the location of report sender ........................................................................................ 22
Table 4 12 Generate report ......................................................................................................................... 22
Table 5 1 Access Control Matrix for MPTDRS ......................................................................................... 34
Table 6 1 Questionnaire For Mobile Application user................................................................................ 40
Table 6 2 mobile app usability scale score ................................................................................................. 41
Table 6 3 Questionnaire For Web Application user.................................................................................... 42
Table 6 4 Web application usability scale score ......................................................................................... 42
Paraphrase This Document
Need a fresh take? Get an instant paraphrase of this document with our AI Paraphraser
iv
List of Figures
Figure 4 1.Use case diagram ....................................................................................................................... 15
Figure 4 2 Class diagram ............................................................................................................................ 23
Figure 4 3 Add misbehaving driver information use case ......................................................................... 24
Figure 4 4. Registration of traffic police use case ....................................................................................... 25
Figure 4 5. Register user use case ............................................................................................................... 26
Figure 5 1 Architecture of MPTDRS ......................................................................................................... .29
Figure 5 2 Subsystem decomposition ......................................................................................................... 30
Figure 5 3 Deployment diagram ................................................................................................................ 32
Figure 5 4 Table Relationship .................................................................................................................... 33
Figure 6 1 Login page ................................................................................................................................. 36
Figure 6 2 Home page ................................................................................................................................. 37
Figure 6 3 Behavior page ............................................................................................................................ 37
Figure 6 4 ODK collect app home page ...................................................................................................... 38
Figure 6 5 Information displayed in the mobile phone ......................................................................... 39
v
Abbreviations
AATPR Addis Ababa Traffic Police Report
GPS Global Positioning System
GIS Geographical Information System
MPTDRS Misbehave Public Transport drivers reporting system
NPM Nodejs package manager
PC Personal Computer
ODK Open Data Kit
OSM Open Street Map
SMS Short Message Service
WHO World Health Organization
1
Chapter One: Introduction
1.1 Background
People use different transportation methods to move from one place to another for different
reasons. Public transportation, taxi and bus, is widely used for moving many people from one
place to another. As public transportation has many benefits, it is also the reason to injure,
disable and kill many people.
In Ethiopia, the number of deaths due to traffic accidents is reported to be amongst the highest in
the world. According to the WHO, in 2013 the road crash fatality rate in Ethiopia was 4984.3
deaths per 100,000 vehicles per year, compared to 574 across sub-Saharan African countries. In
general, the scale and the severity of the problem are increasing from time to time and adversely
affecting the economy of the country in general and the livelihood of individuals in particular
[1].
It is a daily trend for us to hear lot of accident in media happen mainly because of over speeding
of vehicle i.e. rash driving, not following sign board and fatigue states of driver like drowsy,
drunken state [2].
Drivers are the major cause of most accidents according to traffic police report. Trucks and
minibus taxis were involved in the majority of crashes, while automobiles (small vehicles) were
less involved in crashes relative to other vehicle types [3].
It is important to decrease the rate of traffic accidents to reduce not only human casualties but
also medical expenses, damages of vehicles and road facilities, congestion due to accidents, and
other economic losses (such as losses of production) [4].
Controlling each driver is difficult because of the limited number traffic police in the country.
Drivers follow the rule when there is traffic police around so this is what makes it difficult to
reduce the accident.
Currently, Smart phones are widely used for different purpose. These smart phones have built-in
GPS (Global positioning system) device which use to determine the current position and can
download and use different applications [5]. This project will help passengers and other to
submit dangerous drivers’ information including their location to the nearest traffic police using
smart phone.
Secure Best Marks with AI Grader
Need help grading? Try our AI Grader for instant feedback on your assignments.
2
The aim of this project is to reduce car accident that will occur on taxis and bus by making
passengers and others to report on the drivers’ illegal action during driving to the nearest traffic
police using smart phone.
1.2 Motivation
Car accidents became critical issue in Ethiopia which takes much human life and people are
getting worry while they travel to other places using public transportation. Because of drivers
fault many parents lost their children, children are forced to live without their parents, and many
people became disabled and stay at home without work. If a technology that controls the drivers
and penalize them implemented such accidents will be reduced. This motivates us to conduct this
project.
1.3 Statement of the Problem
According to Addis Ababa Traffic Police Report (AATPR), nearly 75% of the accident was
attributable to the driver [6]. Some of the attributes are speed, drunk driving, using mobile device
and alike. Generally, most public transportation drivers’ problem is not willing to follow the
traffic law [2].
Passengers usually argue with drivers about their illegal action while they travel to some place
but most drivers do not accept what the passenger say.
In many countries different authorities have set up a call center where motorists and public
transport users are able to report dangerous driving behavior and make a complaint. Traditional
dangerous driving report system is usually carried out by telephone calls in order to report or
make a complaint regarding bad driving behavior [17]. Reporting the drivers action by calling to
call center (991) takes more time to reach the traffic polices so it cannot help to prevent accidents
before happing and calling direct to traffic polices is also difficult because they are not staying
permanently in one place and new comers don’t get the telephone address of traffic officers.
Therefore, it is difficult to report illegal drivers through telephone for accident prevention.
Currently, traffic police randomly use radar guns to control over speed vehicles in different
places which are important to reduce accident cause by over speed but they only use it in specific
area and time because of limited resource. This kind of mobile device cannot be used all over the
country for 24 hours.
3
Alcohol testing device is also used to control drunk driver. This device is also useful to reduce
accident caused by drunk drivers but as radar guns it is not used frequently in all places.
There are research works try to solve this problem by using different technology. According to
research work by Chalermpol and Wasan [17], by collecting a stream of data through built-in
GPS receiver in smart phone, a time series of speed profile can be obtained for a given journey.
The above research work is trying to report over speed using smart phone to passenger but in the
case of Ethiopia, there are different reasons other than the above attribute. Some of them are over
speed, on boarding over the vehicle capacity, using mobile phone and others.
Implementing the technology to control this kind of driver behaviors is also challenging. That is
why we try to solve this problem by allowing passengers of public transportation and others who
see the driver’s behavior to report the situation to the right authority using their smart phone.
1.4 Objectives
General Objective
The general objective of the project is to develop a system which makes people able to report
misbehaving public transport driver to the nearest traffic police.
Specific Objective
The specific objectives that will help us to meet the general objectives are listed below.
- Study the bad driving behavior of public transport drivers while they drive
- Analyze the bad driving behavior of the public transport drivers
- Design the architecture of the solution domain based on the problem
- Develop a prototype application that can solve the problem using smart phone
- User acceptance test
- Use manual preparation
1.5 Methodology
1.5.1 Literature Review
Extensive literature review will be made on different related works to obtain an in-depth
understanding of the area and to identify the actual problem. Moreover, to find useful approaches
that can efficiently solve the problem.
4
1.5.2 Data collection
The relevant data for this study will be gathered by collecting data through physical observation
of necessary documents and interview the appropriate person to capture raw facts and to come up
with appropriate information.
1.5.3 Tools
Different tools will be used for analysis, design and implementation of misbehaving public
transport drivers reporting system. Among these: edraw max for design, MS-excel of form
design, node.js is used for developing real time web application and NPM is used for package
manager for node.js packages, and mongoDB is used for storing data in the database.
1.5.4 System Development
Following the completion of requirements analysis, the system is modelled using UML tools
which are use case diagram, class diagram and sequence diagram. Agile software methodology is
used for the overall software development.
1.5.5 Evaluation of the project
The prototype of misbehaving public transport drivers reporting system will be developed and
deployed on a server before testing is done and the functionality of the system will be tested on
sample data prepared for test.
1.6 Scope and Limitations
The scope of this project is limited to public transport drivers as most of the passengers use
public transportation and many public transport cars are available throughout Ethiopia but our
scope is with in Addis Ababa city.
Internet connection might also be a limitation as continuous Internet connection is required so
that reporting is possible anytime.
1.7 Application Results
The result of this project benefits people who use public transportation and drivers by reporting
public transport drivers’ illegal action during driving. It will also support the effort of traffic
officers.
Paraphrase This Document
Need a fresh take? Get an instant paraphrase of this document with our AI Paraphraser
5
1.8 Organization of the Document
The rest of the document is organized as follows. Chapter two presents the literature review,
Chapter three describes related works. Chapter four describes about the proposed system that
includes functional, nonfunctional, and system models. Chapter five presents the general system
architecture of the proposed system, decomposition of the system into subsystems, the relational
model and access control policy defined for the system. Chapter six presents the implementation.
Finally, Chapter seven presents conclusion and future works.
6
Chapter Two: Literature Review
2.1 Public Transport
Public transportation is a transportation service that is available to the general public and that
carries passengers to destinations for a fee. The systems are broadly accepted in many cities as
preferred transportation alternative for commuting to work, performing errands or travelling to
social events. The mode is an essential component especially for low income groups [7]. Public
transport is therefore vital for the vast majority without access to private transport. But it should
not be viewed as only for the poor, as the importance of public transport to all income groups in
many rich European cities demonstrates [8]. It also provides an alternative to those who have
private transport [7].
One of the urban transportation systems is public transport. Urban transport in Addis Ababa is
carried by a mixture of ownership structures, of which public and private operators are
predominantly contenders for business. Around 2.2 million people in Addis Ababa are using
public transport of which 3.6 million trips happen in the city on daily basis. Currently, the
modalities of public transport mobility in Addis Ababa are limited to the road transport that
mainly comprises 10, 000 white and blue Minibus taxis that can seat at most 12 people, about
460 Higer midi-buses that seat 22 to 27 people, 487 Anbessa city buses (which carry 30 people
seated and 70 standing), and Alliance bus (have 40 seats and 60 hangers). Currently, public
transport including Anbessa buses, Higer mid-buses, Alliance buses, minibus taxis, and Salon
taxis all together cover about 48 percent while private mode only 9 percent [18].
2.2 Misbehaving Derivers
Unacceptably high road traffic crashes statistics in Addis Ababa are attributed to complex
interrelated risk factors ranging from driver and pedestrian behavior, traffic rules and regulations,
and vehicle and road conditions. For instance, the Ministry of Infrastructure, Roads Authority in
2005 report showed that problems related to the road itself were only responsible for about 1 to
3% while the largest crashes were attributed to driver errors, which accounted for 81%.
Similarly, Tesema et al. [9] in their study of road traffic crashes in Ethiopia reported that about
81% of the road traffic crashes countrywide are due to driver errors such as: drivers not
7
respecting pedestrian priority, speeding, unsafe utilization of freight vehicles for passenger
transportation, poor driving skills and undisciplined driver behavior.
According to Addis Ababa traffic police commission report in 2017 said that, “an overwhelming
number of crashes (99.2 percent) involve male drivers, with the highest proportion of fatal
crashes involving public taxis (23 percent) and 26 percent of fatal crashes involving drivers with
less than two years of driving experience” [10].
2.3 Reporting system
There are different reporting mechanisms used for submitting the work to the right authority. The
most used reporting method is submitting the report through paper and phone calls. When an
event is reported using the paper based reporting system, it could take a number of days before
the supervisor gets the report and take any necessary action. This delay is due to the fact that
most often paper based error reports are mailed using internal mail or dropped off at specified
drop boxes. The nature of the time delay inherent in these methods can delay the response time
for the necessary action taken. With the electronic reporting system, the event can be noticed
with minutes of reporting and facilitates faster response times. The electronic error reporting
system became an effective concurrent risk management tool by providing timely
communication about real time events as they occur [11].
2.4 Global Positioning System(GPS)
GPS is a satellite navigation system used to determine the ground position of an object. GPS
technology was first used by the United States military in the 1960s and expanded into civilian
use over the next few decades. Today, GPS receivers are included in many commercial products,
such as automobiles, smart phones, exercise watches, and GIS devices. It uses radio waves
between satellites and a receiver inside the phone to provide location and time information to any
software that needs to use it. You don't have to send any actual data back into space for GPS to
work; you only need to be able to receive data from four or more of the 28 satellites in orbit that
are dedicated for geolocation use[12].
In this project, we are using GPS for capturing the location of report sender to notice the traffic
police around in that area. The location of the sender helps to get the traffic police assigned in
that area.
Secure Best Marks with AI Grader
Need help grading? Try our AI Grader for instant feedback on your assignments.
8
All traffic police information including their location is capture in the system before sending the
report data to them. The report data transfer to traffic police is based on the location of the user
who sends the report.
2.5 Mobile Internet
In today’s age of connectivity, smart phones and tablets are becoming more of a necessity rather
than a luxury. Whether it is not to miss important mails, being updated with the news or finding
directions when lost – connecting to the Internet anytime and anywhere is becoming an integral
part of our lives. It’s now possible to get Internet access in any location as long as your phone
gets a good signal from the cellular network. You can also use public Wi-Fi hotspots to connect
to the Internet through a shared connection therefore there are usually two ways to connect to the
internet through mobile phone – Via a cellular telephone service provider or by using standard
Wi-Fi. A Wi-Fi enabled device lets you surf the Web at free Wi-Fi hotspots, which is helpful
when the phone network connection isn’t that strong. Through a cellular service provider, the
phone connects to the Internet through data transfer the same way a PC does, but with a wireless
link [13].
2.6 Short Message Service (SMS)
SMS, or Short Message Service, is the technical term for text messaging, the most widely used
data application in the world. SMS users can send messages between cell phones or from
a computer to a cell phone. It was first conceptualized in the 1980s and in the last 10 years has
become an important medium in both personal and business communication. SMS is made
possible by the robust cell phone infrastructure made up of cell towers and satellites. These
remote hubs create control channels. When you send a text message, it travels on one of these
control channels to the corresponding tower, which routes it to the corresponding control channel
of the receiver. SMS messages can fit up to 160 characters in a single message, but modern
services can automatically split up longer messages in order to send the complete text [14].
Our system use short SMS to notify the reported data comes from the user to the appropriate
traffic police around that area. When the traffic polices get this SMS, they immediately read the
this data to capture the driver.
9
2.7 ODK Collect
ODK Collect is an open source Android appthat allows data collection using mobile devices and
data submission to an online server, even without an Internet connection or mobile carrier
service at the time of data collection. It renders forms into a sequence of input prompts that apply
form logic, entry constraints, and repeating sub-structures. Users work through the prompts and
can save the submission at any point. Finalized submissions can be sent to (and new forms
downloaded from) a server. Data collection supports location, audio, images, video, barcodes,
signatures, multiple-choice, free text, and numeric answers. It can even accept answers from
other apps on your device [15].
2.8 OpenStreetMap(OSM)
OpenStreetMap(OSM) is an online map, that can interactively be zoomed and paned. The map
on the site is nothing more than a display of map tiles, static images rendered from
OpenStreetMap data as an example of what you can do with it. The real power of
OpenStreetMap is not this default rendering, but the possibility to actually access the data behind
this map rendering. And this is where it differs from Google maps, Bing Maps and Yahoo!
Maps and various others. OpenStreetMap is the only mapping service that allows you to do
something more than just look at pretty map tiles [16].
Summary
The above literatures were reviewed to get more understanding about the problems happen in
public transport drivers. Based on the literature, over 2.2 million people in the Addis Ababa use
public transport every day. This people face different problems while they use this public
transport and some time they may be injured or killed in case of accidents. They don’t have easy
way to report the misbehavior of the drivers.
10
Chapter Three: Related Work
3.1 Detecting Aggressive Deriving using smart phone
- Smartphone Enabled Dangerous Driving report system - This paper proposes a novel
dangerous driving report system using a smart phone platform, by collecting a stream of
data through built-in GPS receiver in smart phone, a time series of speed profile can be
obtained for a given journey. An algorithm is proposed to detect anomaly in speed
profile in order to detect whether a vehicle is speeding. As well as the ability to alert
passengers in real-time in the case of speeding, the proposed system also records the
journey data to be used as evidence when making a report. Furthermore, the work in this
paper focuses mainly on the speed domain where public transport passengers are alerted
automatically when the driver violates the specified speed limit in real-time as they
travel in the vehicle through the mobile application [17].
- Driving Style Recognition Using a Smartphone as a Sensor Platform - They develop
a system called MIROAD (Mobile-Sensor-Platform for Intelligent Recognition of
Aggressive Driving). The system can provide audible feedback if a driver’s style
becomes aggressive, as well as the information leading up to an aggressive event
including video, location, speed and recent driving maneuvers. The system is designed to
help prevent incidents by warning a driver if his or her driving style becomes aggressive,
and to provide information about incidents so that we have a better understanding of what
causes them [19]. The paper proposes a method for determining both driving style and
type of driving maneuver using sensor fusion and the Dynamic Time Warping algorithm;
a complete driver monitoring system on a mobile phone that records and plays back video
and sensor data in a synchronized manner; and finally a comparison of individual sensors
vs. sensor-fused data for driving event recognition using DTW [19].
- Detecting Driving Events Using Smartphone - Human error is one of the three key
contributing factors to road traffic accidents, the other two being vehicles capabilities
and road infrastructures. The fundamental elements leading up to aggressive driving
behaviors are from different driving events that occur during a journey such as harsh
braking and acceleration, rapid turning and rapid lane change. Therefore, it is essential to
be able to detect these fundamental driving events and classify whether or not they are
Paraphrase This Document
Need a fresh take? Get an instant paraphrase of this document with our AI Paraphraser
11
aggressive in order to recognize potential crashes [20].The research work proposes two
algorithms which detect driving events using data collected from smart phone sensors
such as GPS, accelerometer and magnetometer. More importantly, the proposed
algorithms classify whether or not these driving events are aggressive. With all the data
and sensors they are able to detect vehicle’s movement when a smart phone is placed
inside a vehicle of interest. As a result, typical driving events such as turning left and
right, braking and accelerating can be detected. It is important to detect these typical
driving events as they are fundamental to the evaluation of driver behavior [20].
- Safe Driving Using Mobile Phones - Using a smart phone, they have demonstrated
applications that are integrated inside an automobile to evaluate a vehicle’s condition,
such as gear shifts and overall road conditions. Along with these findings, an analysis of
a driver behavior for safe and sudden maneuvers, such as vehicle accelerations and lane
changes, has been identified, which can advise drivers who are unaware of the risks they
are potentially creating for themselves and neighboring vehicles. The direction of lane
change, as well as safe acceleration, compared with sudden acceleration, was easily
distinguishable [21].The device, which is a smart phone, contains GPS, microphones,
and an accelerometer offering flexibility in methodology and user implementation.
Encouraging results in identifying numerous road anomalies and sudden driving
maneuvers allow for the system to evaluate an entire road’s condition and help advice
drivers on unsafe characteristics, respectively, both of which are distinguishable factors
that can determine safety on the road [21].
Summary
The limitations of the paper, smart phone enable dangerous driving report is continuous GPS
reading and good connection is require, the accuracy is vary low using GPS and they only test in
outside the city.
The limitations of the “Driving Style Recognition Using a Smartphone as a Sensor Platform” are
specifically designed to monitor company drivers, requires latest smart phone which include all
sensors for only this purpose and it always need good internet connection.
12
The third paper which is called Detecting Driving Events Using Smartphone, the limitations of
this research are the raw data was collected using a single driver in one vehicle and some of the
events not detected well in pattern matching.
The limitations of the paper Safe Driving Using Mobile Phones is, it uses for driver safety and
only tells the driver about his driving behavior and only use one device to test.
The above research works tries to prevent the accidents cause by specific attributes by placing
smart phone in each car. Among this: over speed, hard braking, rapid turning and lane change
can be detected and recorded using smart phone and report the situation to the driver himself and
the companies but our project provide an option for passengers and others to report in addition to
the mention attribute to the traffic police before accident will happen using smart phone.
13
Chapter Four: System Analysis
3.1 Overview
System analysis involves a detailed study of the existing system to find out what feature the
current system has and what additional features should be included. This will lead to
specifications of a new system.
This chapter discusses the identified functional and non-functional requirements of the system
and the models (use case diagram, class diagram and sequence diagram) used to present the
structural and dynamic behavior of the system. Information about the existing system has been
collected mainly through a questionnaire, interview, observation and document analysis method.
3.2 Functional Requirement
The functional requirements of the system are requirements that are directly related to the functional
aspect of the system. Main functional requirements of the system include:
- The system shall register new traffic police information
- The system shall have the ability to update the traffic police when their assigned place is
changed.
- The system shall hold the list of the main misbehave action done by public transport
drivers
- The system shall accept the reported data sent by a passenger or other.
- The system shall notify the reported data immediately by SMS to the traffic polices
assigned in the sender area.
- The system shall display the report data on the web application on the map.
- The system shall generate report.
3.3 Non Functional Requirement
Non-functional requirements describe user visible aspects of the system that are not directly
related with the functional behavior of the system. The Non-Functional requirements of the
system are described as follows:
Secure Best Marks with AI Grader
Need help grading? Try our AI Grader for instant feedback on your assignments.
14
Performance
The performance of the system should be reliable and the response time should be reasonable
according to the available resource.
Reliability
The system should be reliable and the input data should be returning the exact result at all time.
Usability
The system should be easily understandable by its users. The interface should be easy to use and
it should have a customary look and feel so that users can easily be acquainted with the system.
It should be easy to learn, operate and it should provide alternatives to different tasks. It should
be usable for accomplishing tasks to the client.
Maintainability
The system should be developed for easy future maintenance and enhancement if there are
additional user requirements, system failure, new technological shift, etc.
3.4 System Model
System modeling is the process of developing abstract models of a system, with each model
presenting a different view or perspective of that system.
System modeling helps the analyst to understand the functionality of the system and models are
used to communicate with customers.
3.4.1 Use Case Diagram
Use cases are used during requirements elicitation and analysis to represent the functionality of
the proposed system. Use cases focus on the behavior of the system from an external point of
view. A use case is used to describe a function provided by the system that yields a visible result
for an actor. An actor describes any entity that interacts with the system, such as a user, another
system. The actors are outside the boundary of the system, whereas the use cases are inside the
boundary of the system. The following use cases and actors are identified for the proposed
system.
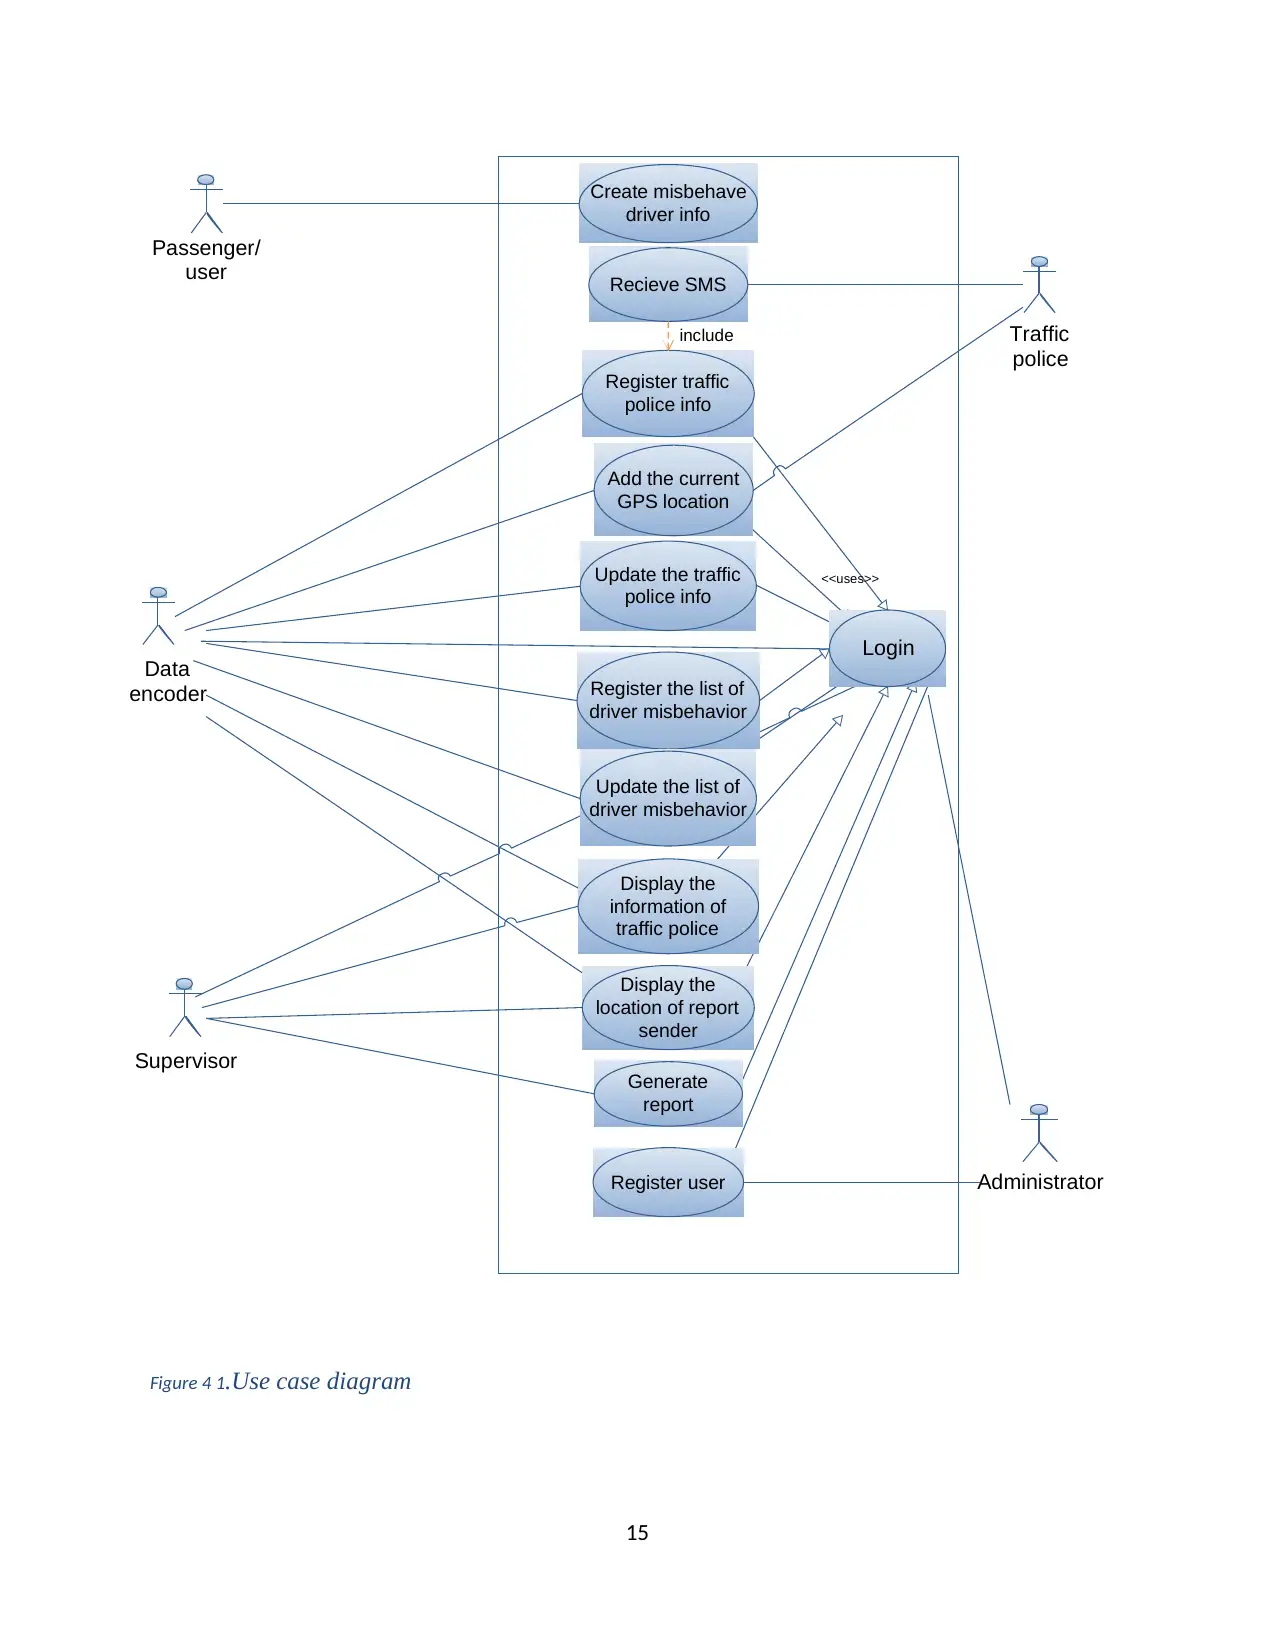
15
Figure 4 1.Use case diagram
<<uses>>
Create misbehave
driver info
Recieve SMS
Register traffic
police info
Update the traffic
police info
Register the list of
driver misbehavior
Update the list of
driver misbehavior
Display the
information of
traffic police
Display the
location of report
sender
Register user
Generate
report
Add the current
GPS location
Administrator
Passenger/
user
Data
encoder
Supervisor
Traffic
police
Login
include
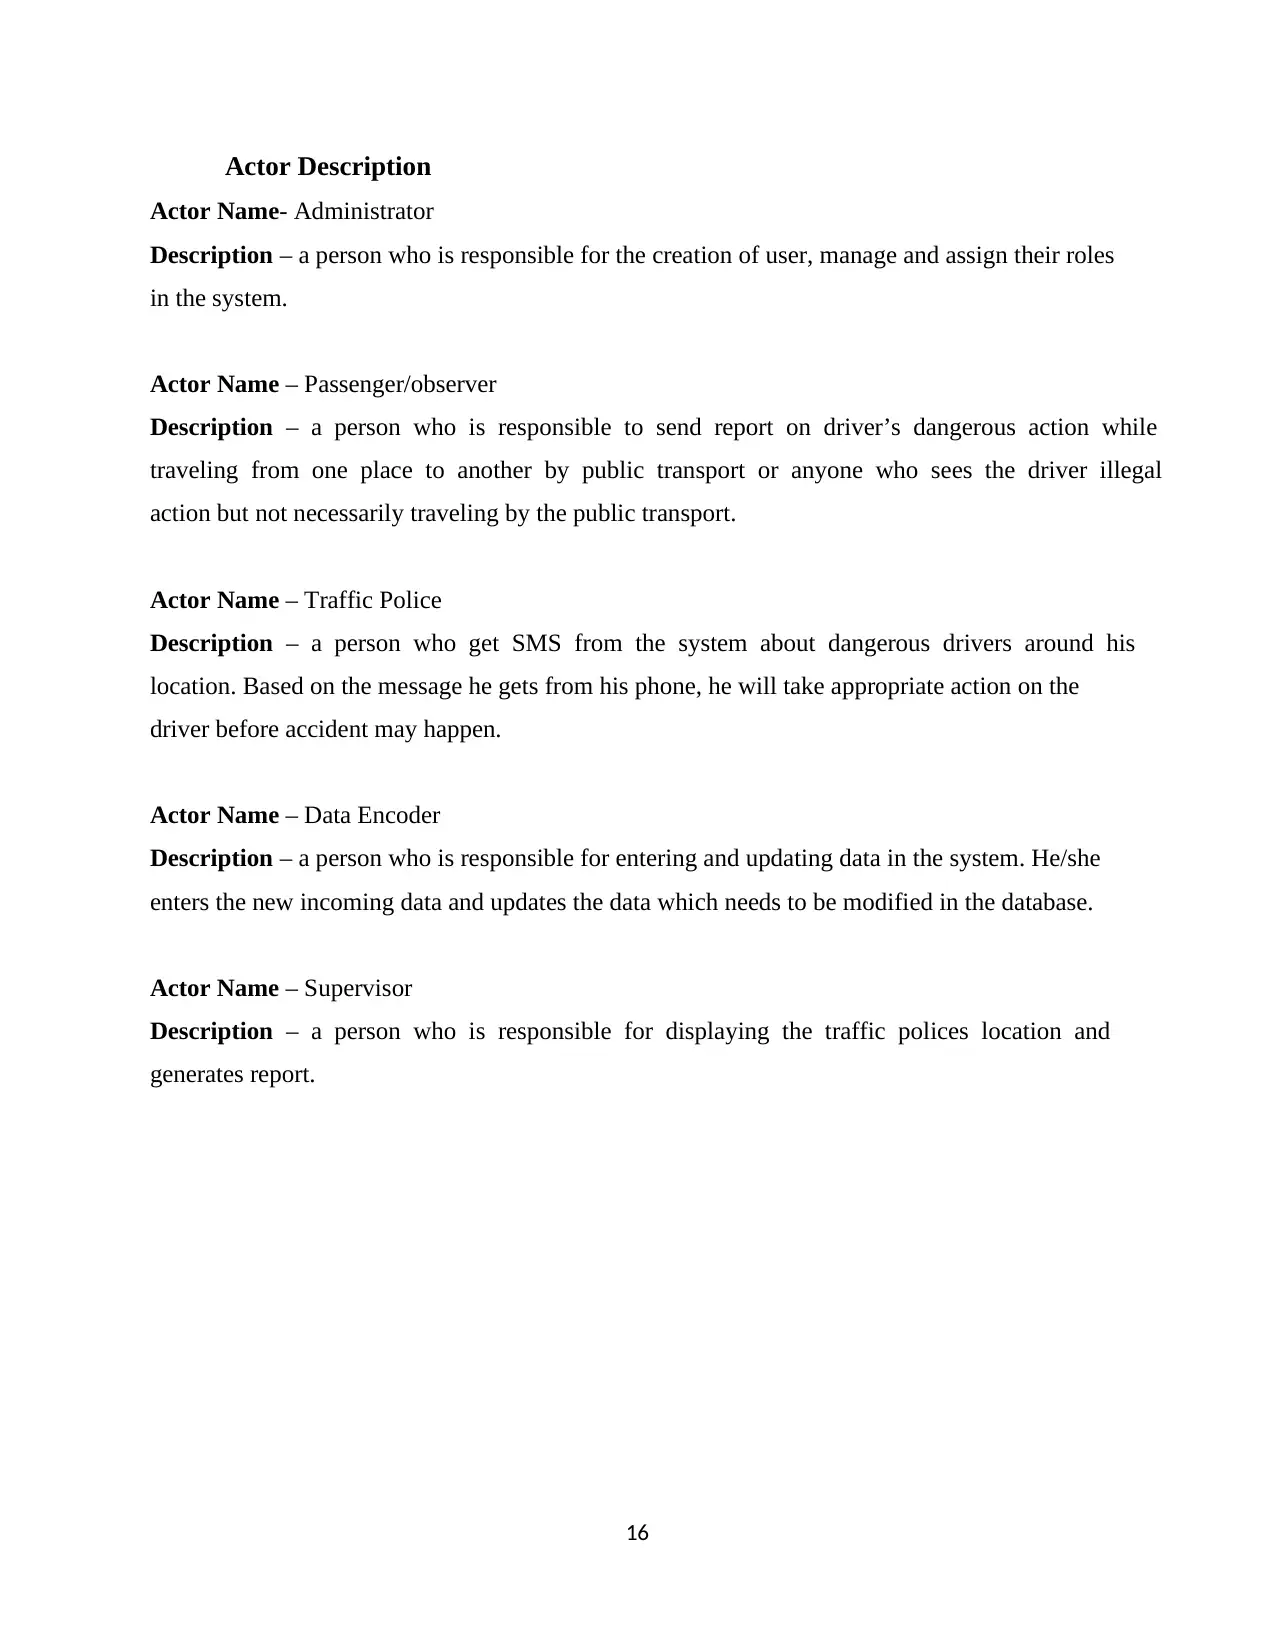
16
Actor Description
Actor Name- Administrator
Description – a person who is responsible for the creation of user, manage and assign their roles
in the system.
Actor Name – Passenger/observer
Description – a person who is responsible to send report on driver’s dangerous action while
traveling from one place to another by public transport or anyone who sees the driver illegal
action but not necessarily traveling by the public transport.
Actor Name – Traffic Police
Description – a person who get SMS from the system about dangerous drivers around his
location. Based on the message he gets from his phone, he will take appropriate action on the
driver before accident may happen.
Actor Name – Data Encoder
Description – a person who is responsible for entering and updating data in the system. He/she
enters the new incoming data and updates the data which needs to be modified in the database.
Actor Name – Supervisor
Description – a person who is responsible for displaying the traffic polices location and
generates report.
Paraphrase This Document
Need a fresh take? Get an instant paraphrase of this document with our AI Paraphraser
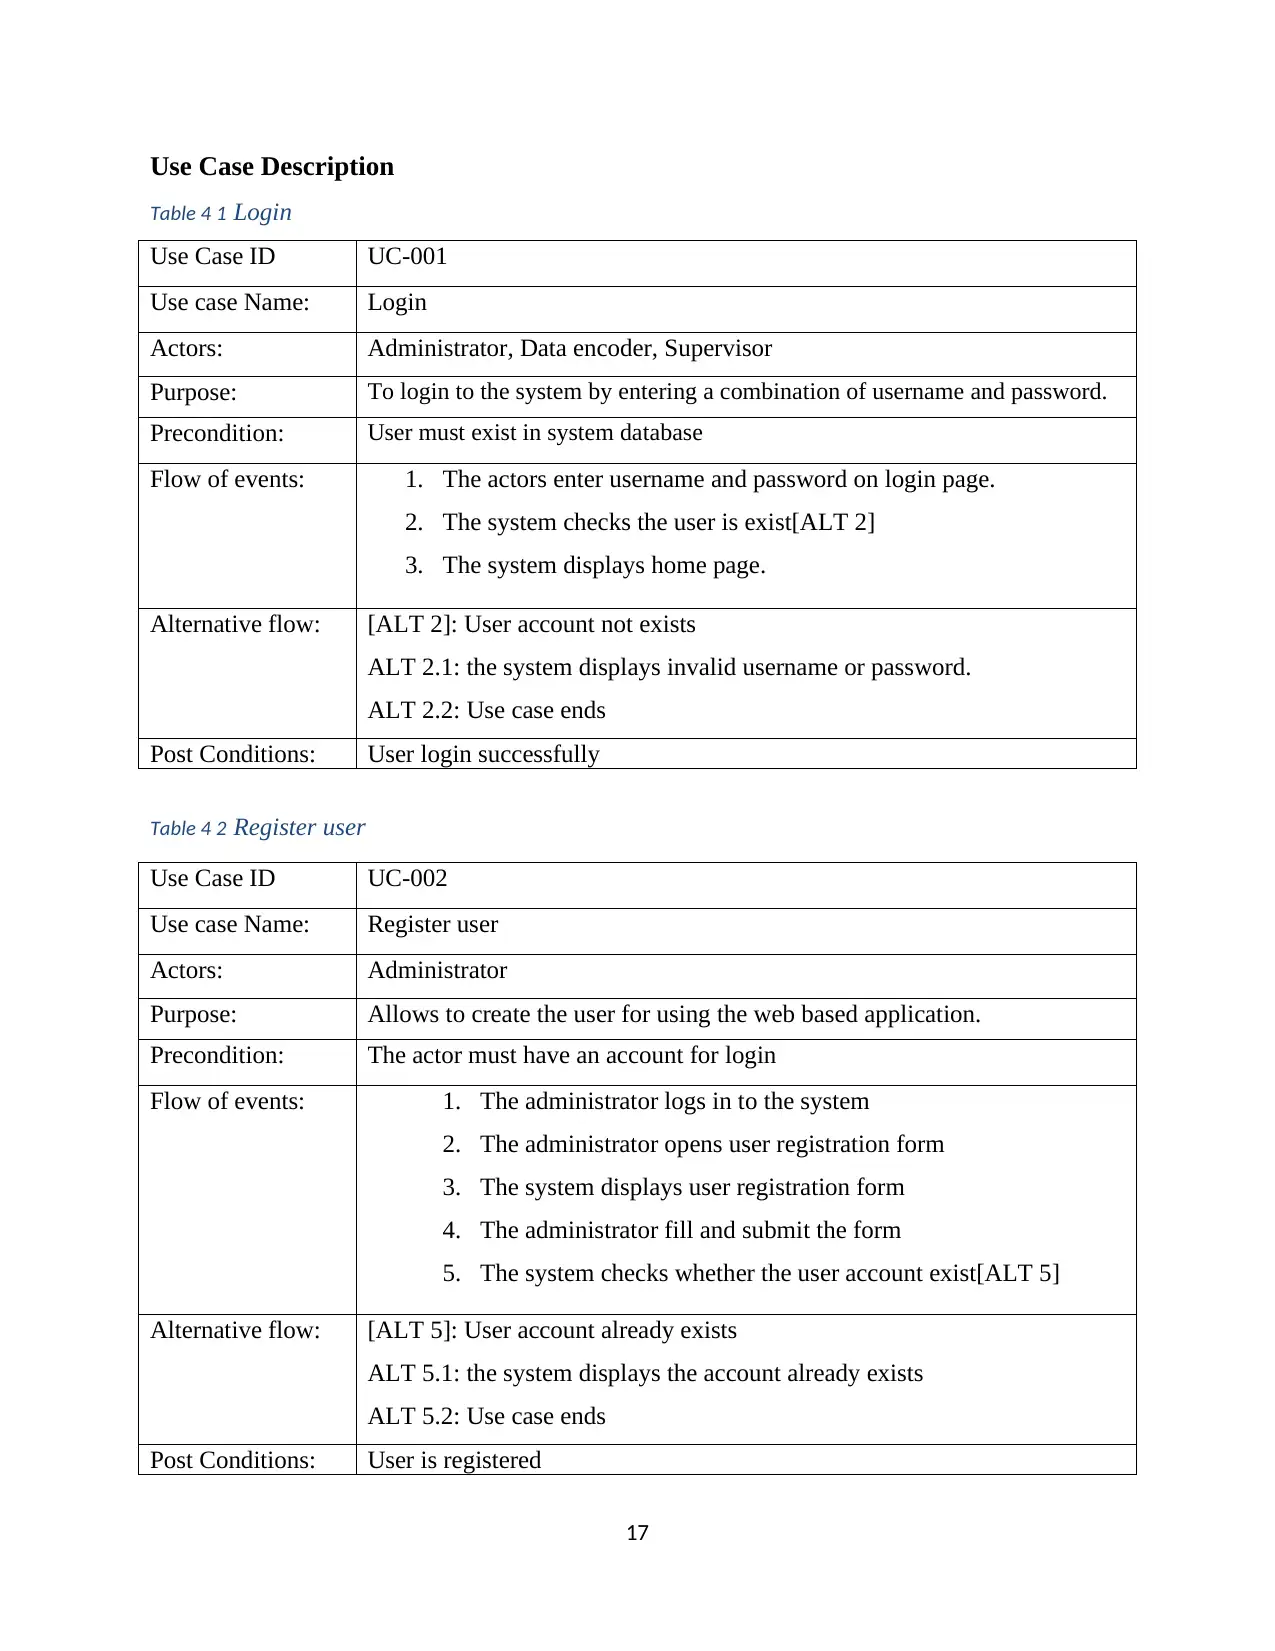
17
Use Case Description
Table 4 1 Login
Use Case ID UC-001
Use case Name: Login
Actors: Administrator, Data encoder, Supervisor
Purpose: To login to the system by entering a combination of username and password.
Precondition: User must exist in system database
Flow of events: 1. The actors enter username and password on login page.
2. The system checks the user is exist[ALT 2]
3. The system displays home page.
Alternative flow: [ALT 2]: User account not exists
ALT 2.1: the system displays invalid username or password.
ALT 2.2: Use case ends
Post Conditions: User login successfully
Table 4 2 Register user
Use Case ID UC-002
Use case Name: Register user
Actors: Administrator
Purpose: Allows to create the user for using the web based application.
Precondition: The actor must have an account for login
Flow of events: 1. The administrator logs in to the system
2. The administrator opens user registration form
3. The system displays user registration form
4. The administrator fill and submit the form
5. The system checks whether the user account exist[ALT 5]
Alternative flow: [ALT 5]: User account already exists
ALT 5.1: the system displays the account already exists
ALT 5.2: Use case ends
Post Conditions: User is registered
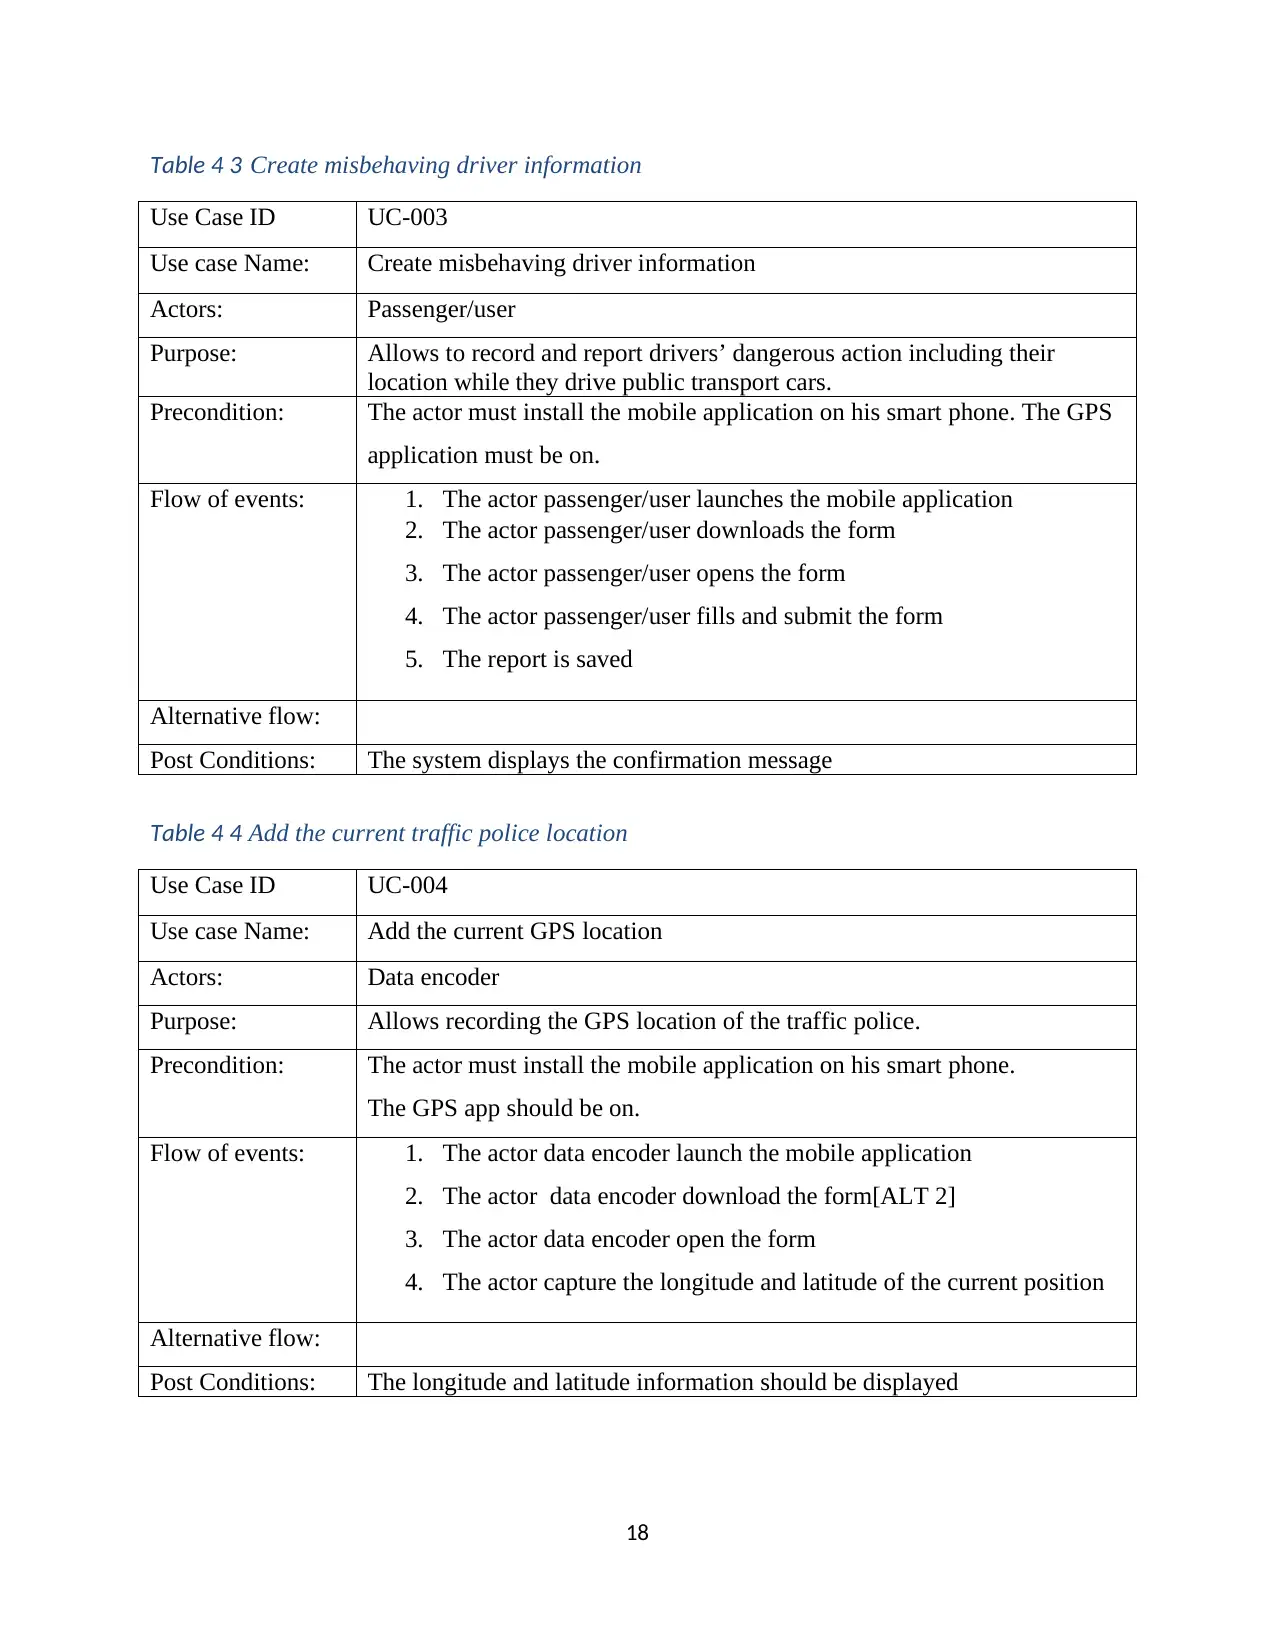
18
Table 4 3 Create misbehaving driver information
Use Case ID UC-003
Use case Name: Create misbehaving driver information
Actors: Passenger/user
Purpose: Allows to record and report drivers’ dangerous action including their
location while they drive public transport cars.
Precondition: The actor must install the mobile application on his smart phone. The GPS
application must be on.
Flow of events: 1. The actor passenger/user launches the mobile application
2. The actor passenger/user downloads the form
3. The actor passenger/user opens the form
4. The actor passenger/user fills and submit the form
5. The report is saved
Alternative flow:
Post Conditions: The system displays the confirmation message
Table 4 4 Add the current traffic police location
Use Case ID UC-004
Use case Name: Add the current GPS location
Actors: Data encoder
Purpose: Allows recording the GPS location of the traffic police.
Precondition: The actor must install the mobile application on his smart phone.
The GPS app should be on.
Flow of events: 1. The actor data encoder launch the mobile application
2. The actor data encoder download the form[ALT 2]
3. The actor data encoder open the form
4. The actor capture the longitude and latitude of the current position
Alternative flow:
Post Conditions: The longitude and latitude information should be displayed
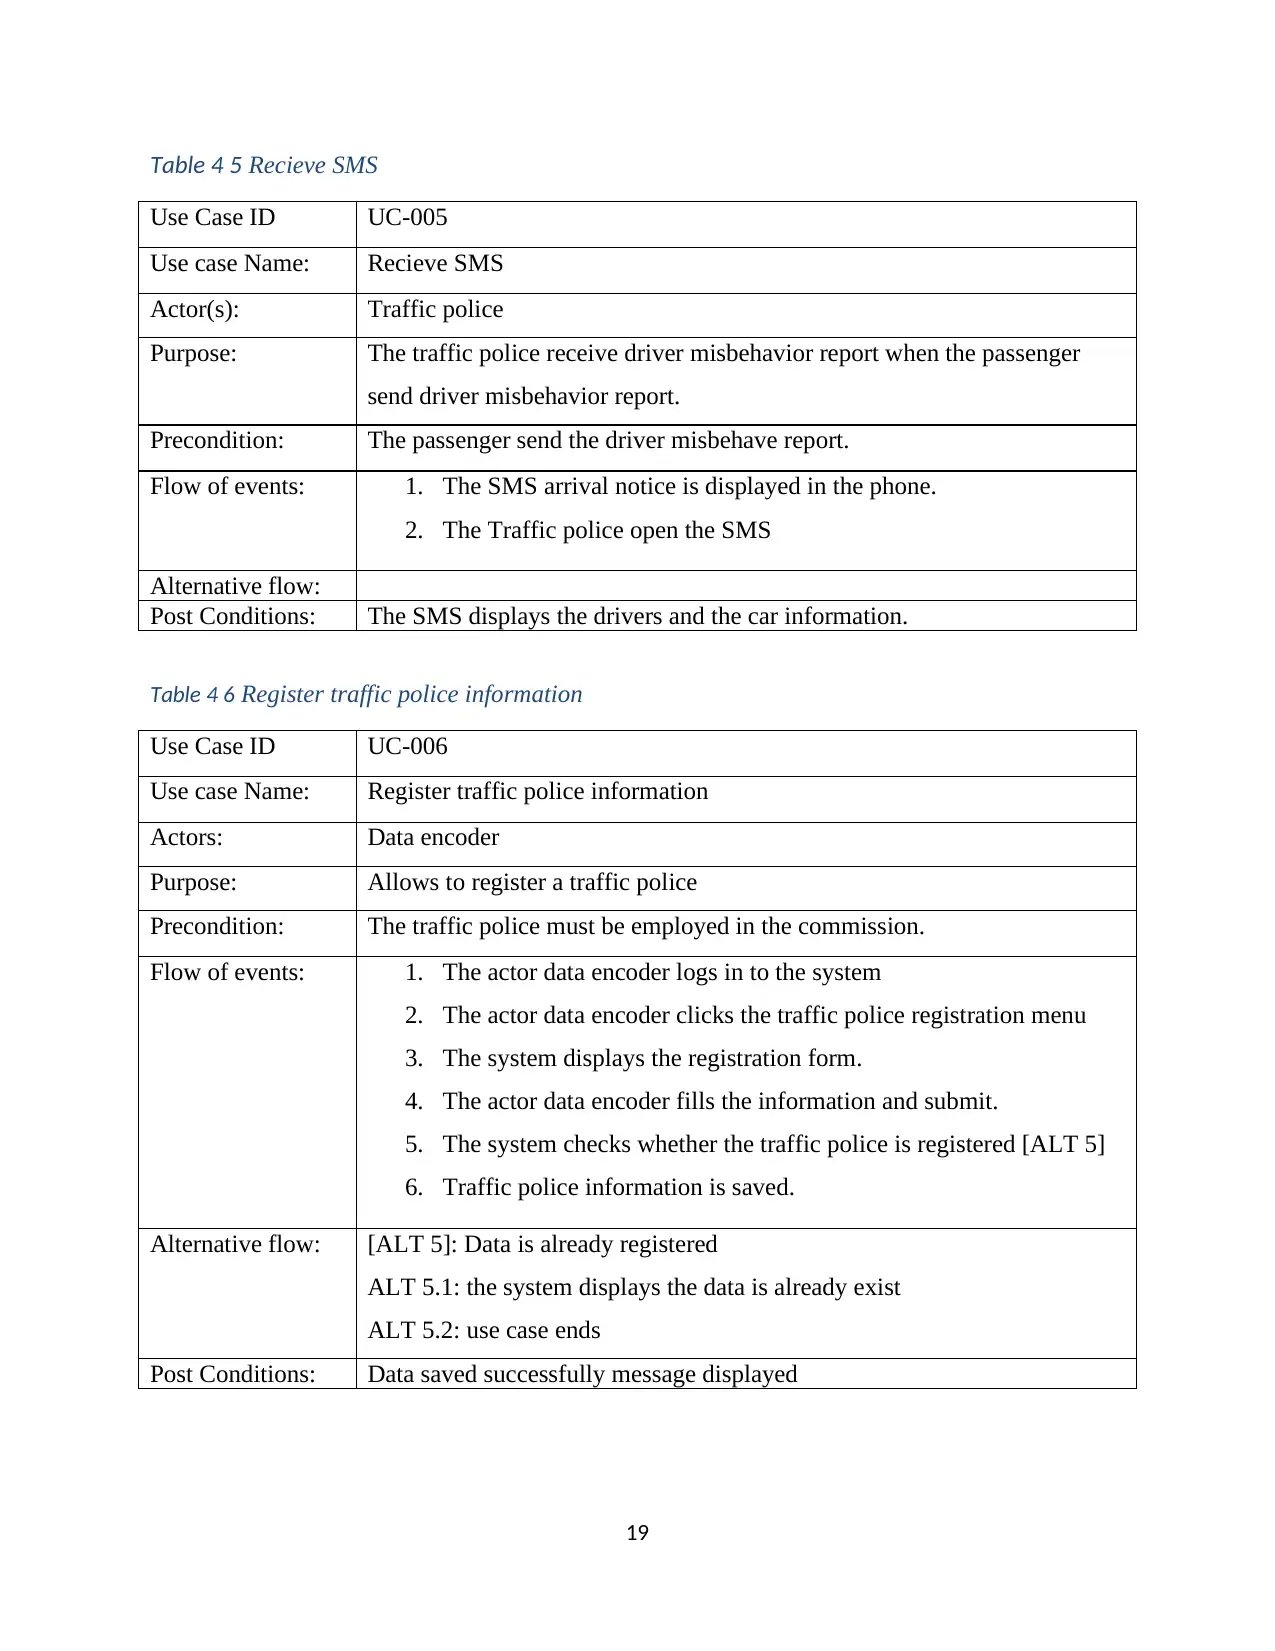
19
Table 4 5 Recieve SMS
Use Case ID UC-005
Use case Name: Recieve SMS
Actor(s): Traffic police
Purpose: The traffic police receive driver misbehavior report when the passenger
send driver misbehavior report.
Precondition: The passenger send the driver misbehave report.
Flow of events: 1. The SMS arrival notice is displayed in the phone.
2. The Traffic police open the SMS
Alternative flow:
Post Conditions: The SMS displays the drivers and the car information.
Table 4 6 Register traffic police information
Use Case ID UC-006
Use case Name: Register traffic police information
Actors: Data encoder
Purpose: Allows to register a traffic police
Precondition: The traffic police must be employed in the commission.
Flow of events: 1. The actor data encoder logs in to the system
2. The actor data encoder clicks the traffic police registration menu
3. The system displays the registration form.
4. The actor data encoder fills the information and submit.
5. The system checks whether the traffic police is registered [ALT 5]
6. Traffic police information is saved.
Alternative flow: [ALT 5]: Data is already registered
ALT 5.1: the system displays the data is already exist
ALT 5.2: use case ends
Post Conditions: Data saved successfully message displayed
Secure Best Marks with AI Grader
Need help grading? Try our AI Grader for instant feedback on your assignments.
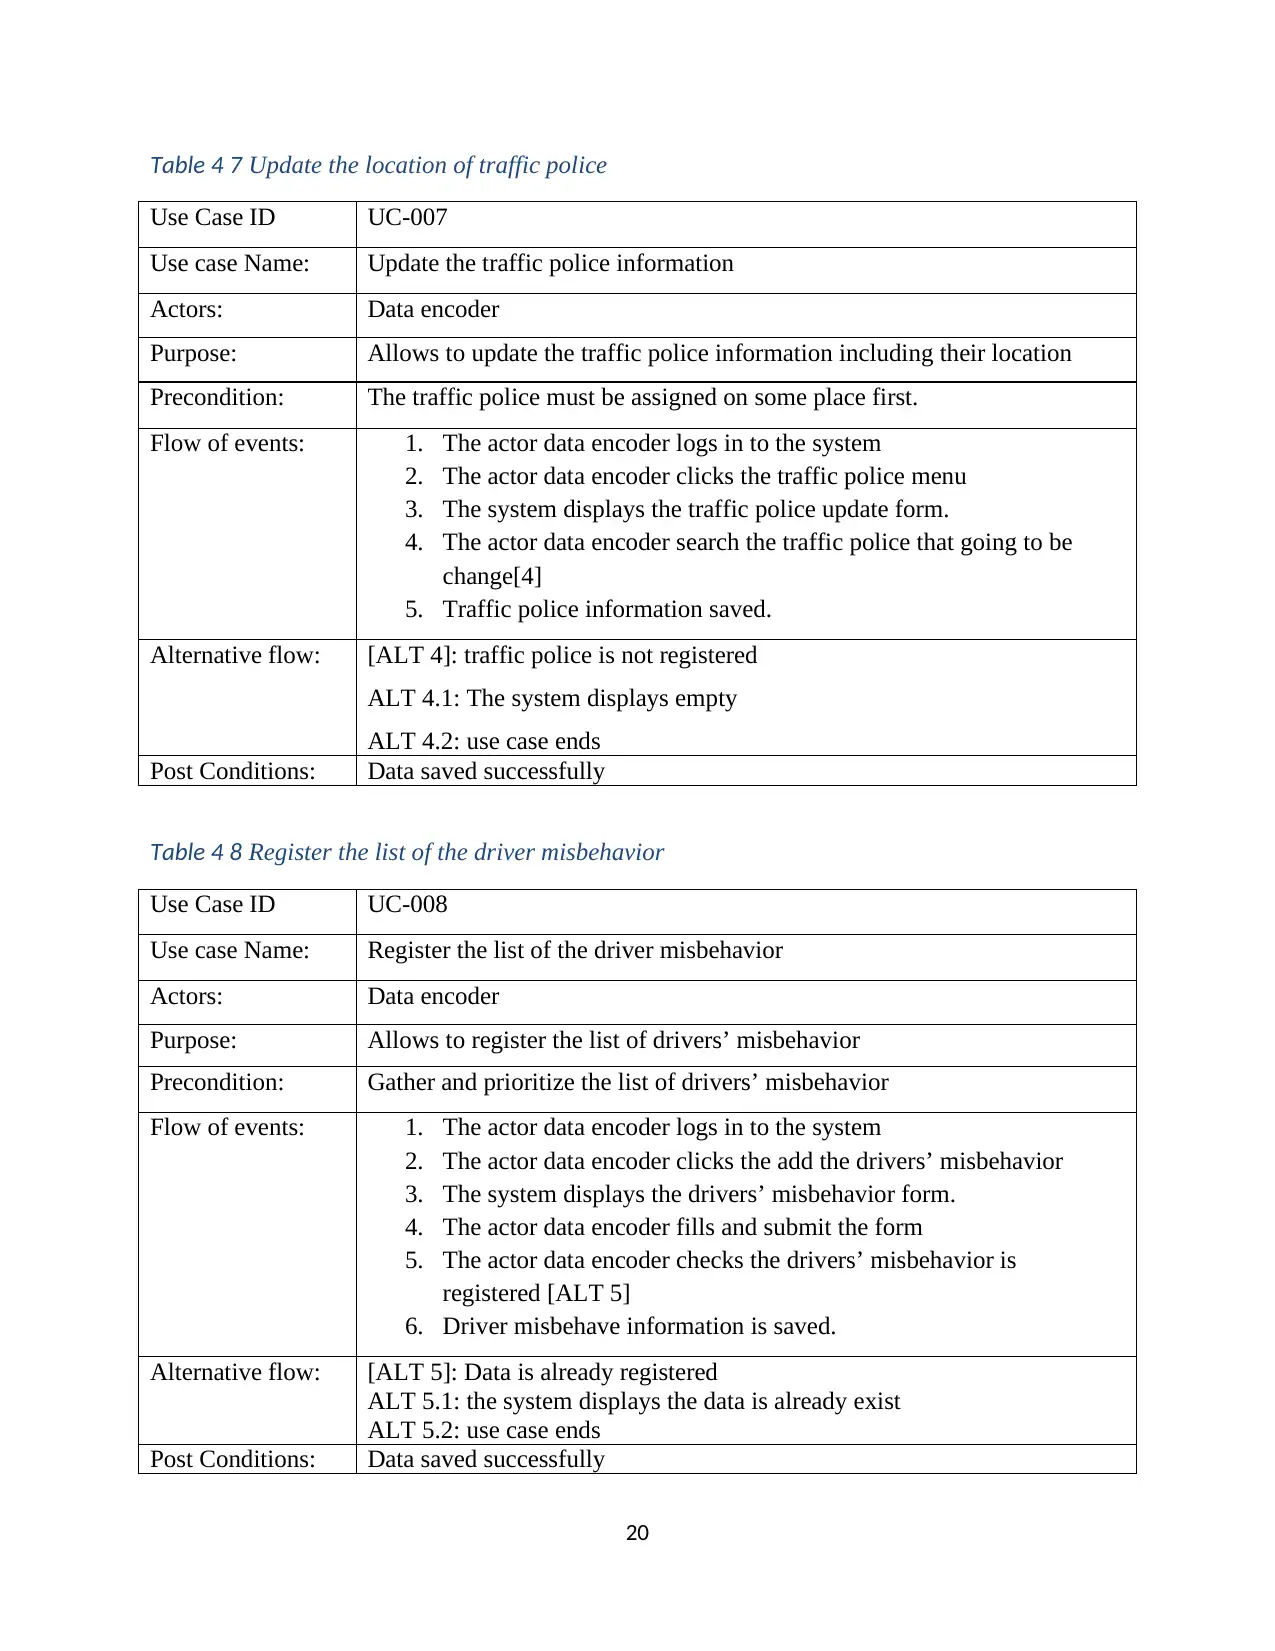
20
Table 4 7 Update the location of traffic police
Use Case ID UC-007
Use case Name: Update the traffic police information
Actors: Data encoder
Purpose: Allows to update the traffic police information including their location
Precondition: The traffic police must be assigned on some place first.
Flow of events: 1. The actor data encoder logs in to the system
2. The actor data encoder clicks the traffic police menu
3. The system displays the traffic police update form.
4. The actor data encoder search the traffic police that going to be
change[4]
5. Traffic police information saved.
Alternative flow: [ALT 4]: traffic police is not registered
ALT 4.1: The system displays empty
ALT 4.2: use case ends
Post Conditions: Data saved successfully
Table 4 8 Register the list of the driver misbehavior
Use Case ID UC-008
Use case Name: Register the list of the driver misbehavior
Actors: Data encoder
Purpose: Allows to register the list of drivers’ misbehavior
Precondition: Gather and prioritize the list of drivers’ misbehavior
Flow of events: 1. The actor data encoder logs in to the system
2. The actor data encoder clicks the add the drivers’ misbehavior
3. The system displays the drivers’ misbehavior form.
4. The actor data encoder fills and submit the form
5. The actor data encoder checks the drivers’ misbehavior is
registered [ALT 5]
6. Driver misbehave information is saved.
Alternative flow: [ALT 5]: Data is already registered
ALT 5.1: the system displays the data is already exist
ALT 5.2: use case ends
Post Conditions: Data saved successfully
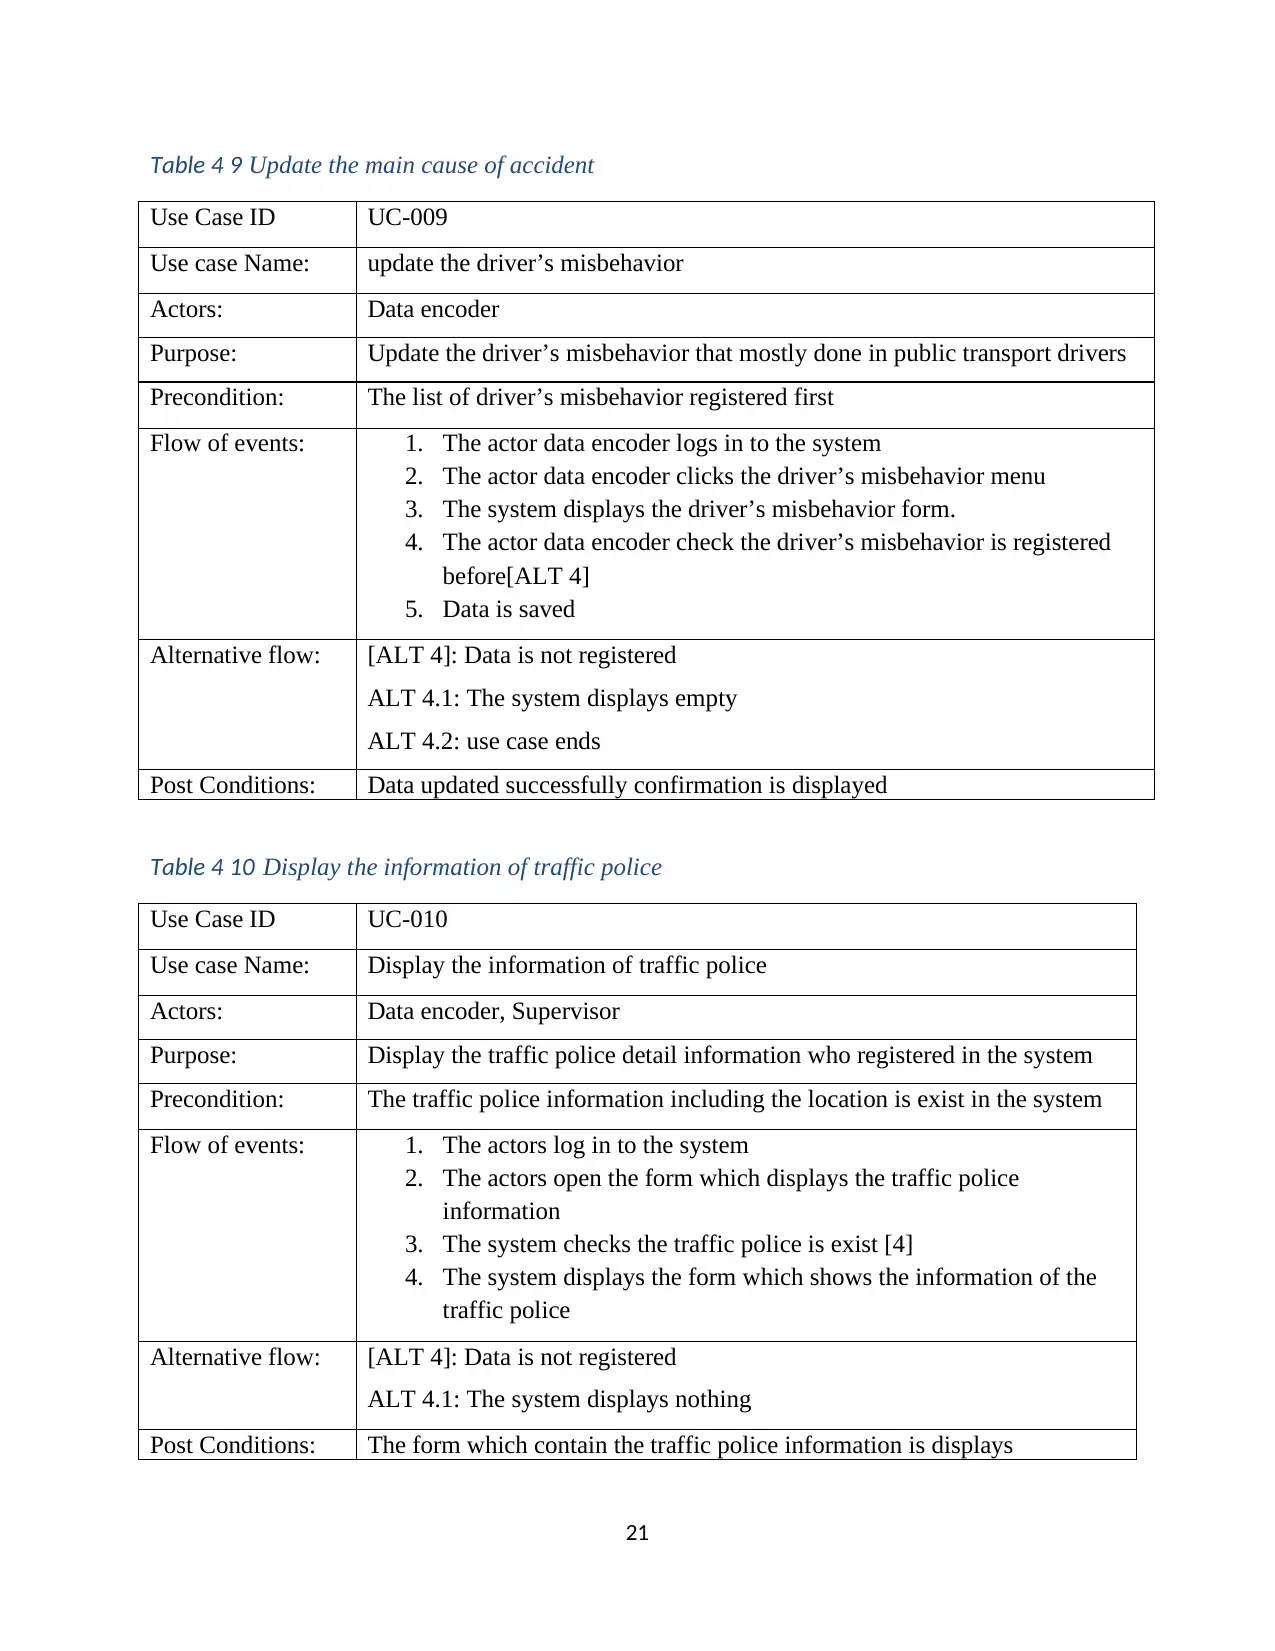
21
Table 4 9 Update the main cause of accident
Use Case ID UC-009
Use case Name: update the driver’s misbehavior
Actors: Data encoder
Purpose: Update the driver’s misbehavior that mostly done in public transport drivers
Precondition: The list of driver’s misbehavior registered first
Flow of events: 1. The actor data encoder logs in to the system
2. The actor data encoder clicks the driver’s misbehavior menu
3. The system displays the driver’s misbehavior form.
4. The actor data encoder check the driver’s misbehavior is registered
before[ALT 4]
5. Data is saved
Alternative flow: [ALT 4]: Data is not registered
ALT 4.1: The system displays empty
ALT 4.2: use case ends
Post Conditions: Data updated successfully confirmation is displayed
Table 4 10 Display the information of traffic police
Use Case ID UC-010
Use case Name: Display the information of traffic police
Actors: Data encoder, Supervisor
Purpose: Display the traffic police detail information who registered in the system
Precondition: The traffic police information including the location is exist in the system
Flow of events: 1. The actors log in to the system
2. The actors open the form which displays the traffic police
information
3. The system checks the traffic police is exist [4]
4. The system displays the form which shows the information of the
traffic police
Alternative flow: [ALT 4]: Data is not registered
ALT 4.1: The system displays nothing
Post Conditions: The form which contain the traffic police information is displays
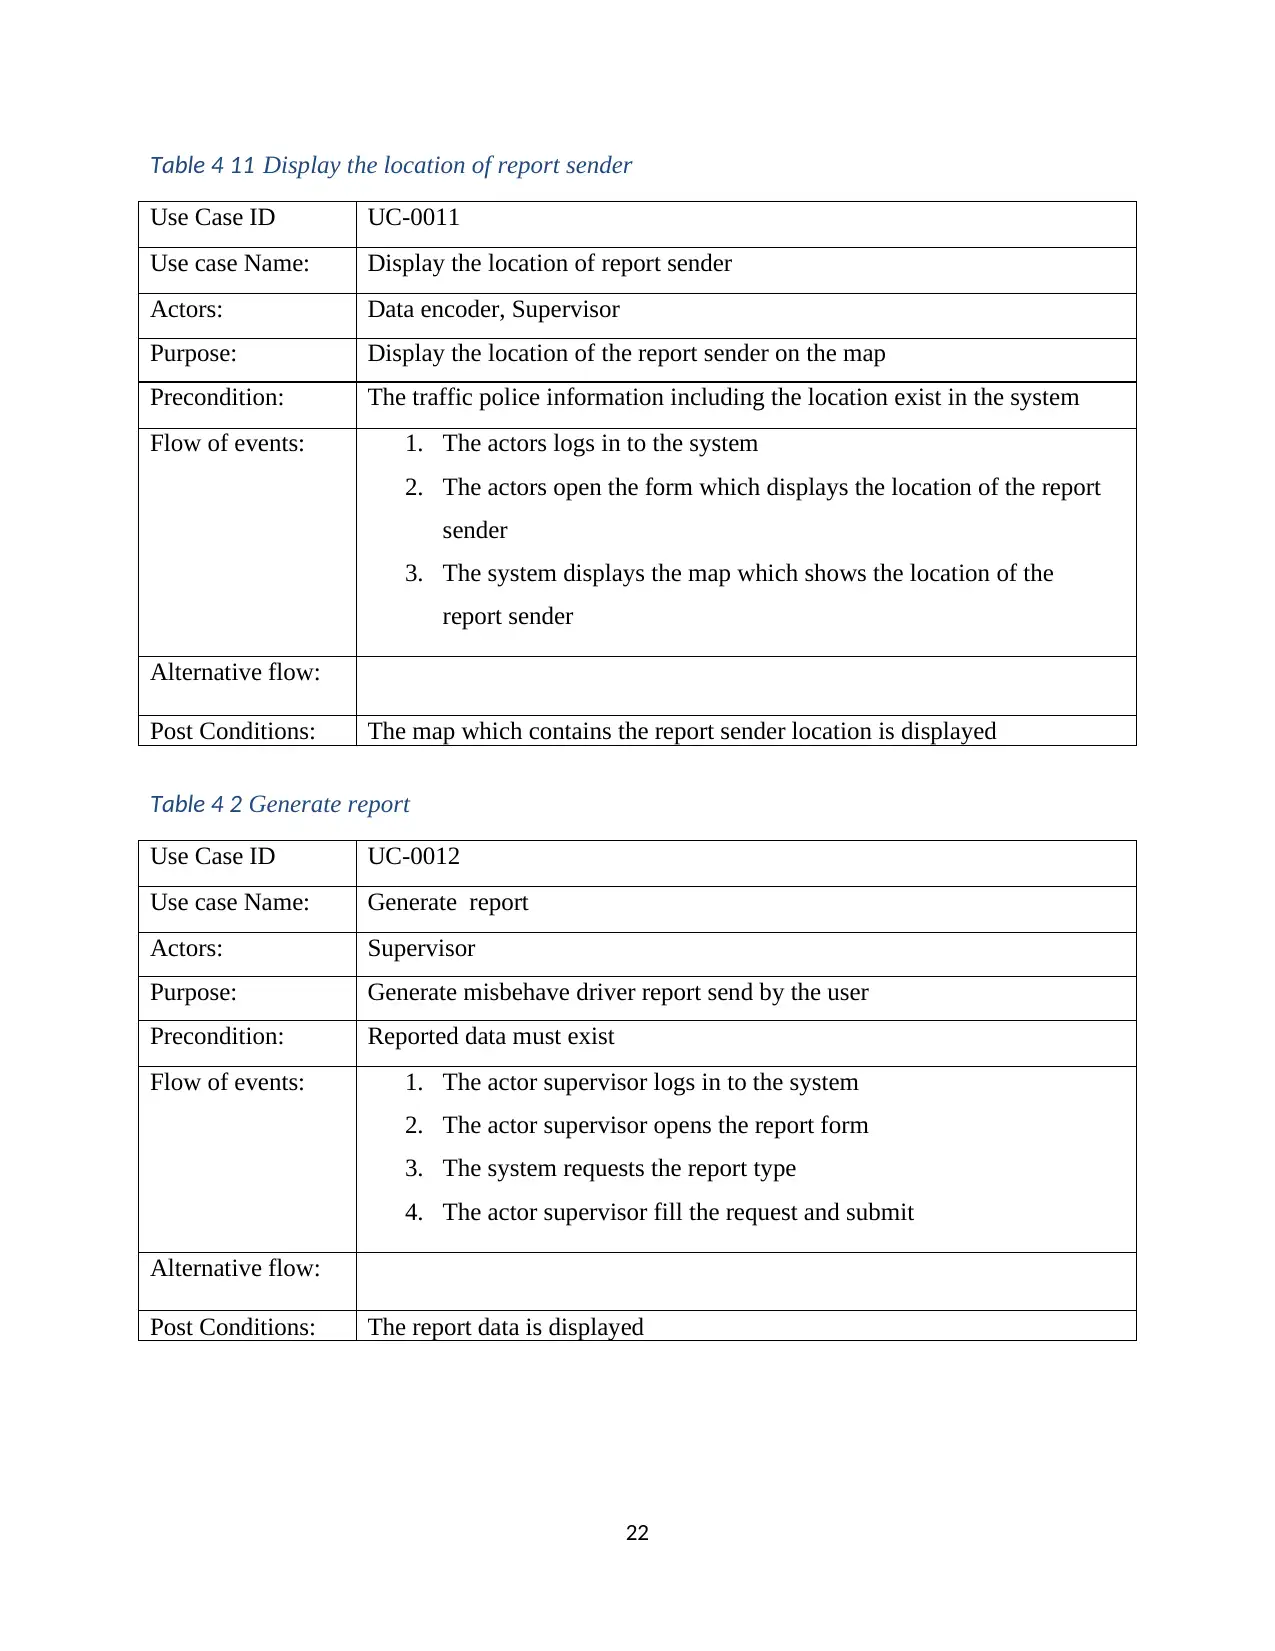
22
Table 4 11 Display the location of report sender
Use Case ID UC-0011
Use case Name: Display the location of report sender
Actors: Data encoder, Supervisor
Purpose: Display the location of the report sender on the map
Precondition: The traffic police information including the location exist in the system
Flow of events: 1. The actors logs in to the system
2. The actors open the form which displays the location of the report
sender
3. The system displays the map which shows the location of the
report sender
Alternative flow:
Post Conditions: The map which contains the report sender location is displayed
Table 4 2 Generate report
Use Case ID UC-0012
Use case Name: Generate report
Actors: Supervisor
Purpose: Generate misbehave driver report send by the user
Precondition: Reported data must exist
Flow of events: 1. The actor supervisor logs in to the system
2. The actor supervisor opens the report form
3. The system requests the report type
4. The actor supervisor fill the request and submit
Alternative flow:
Post Conditions: The report data is displayed
Paraphrase This Document
Need a fresh take? Get an instant paraphrase of this document with our AI Paraphraser
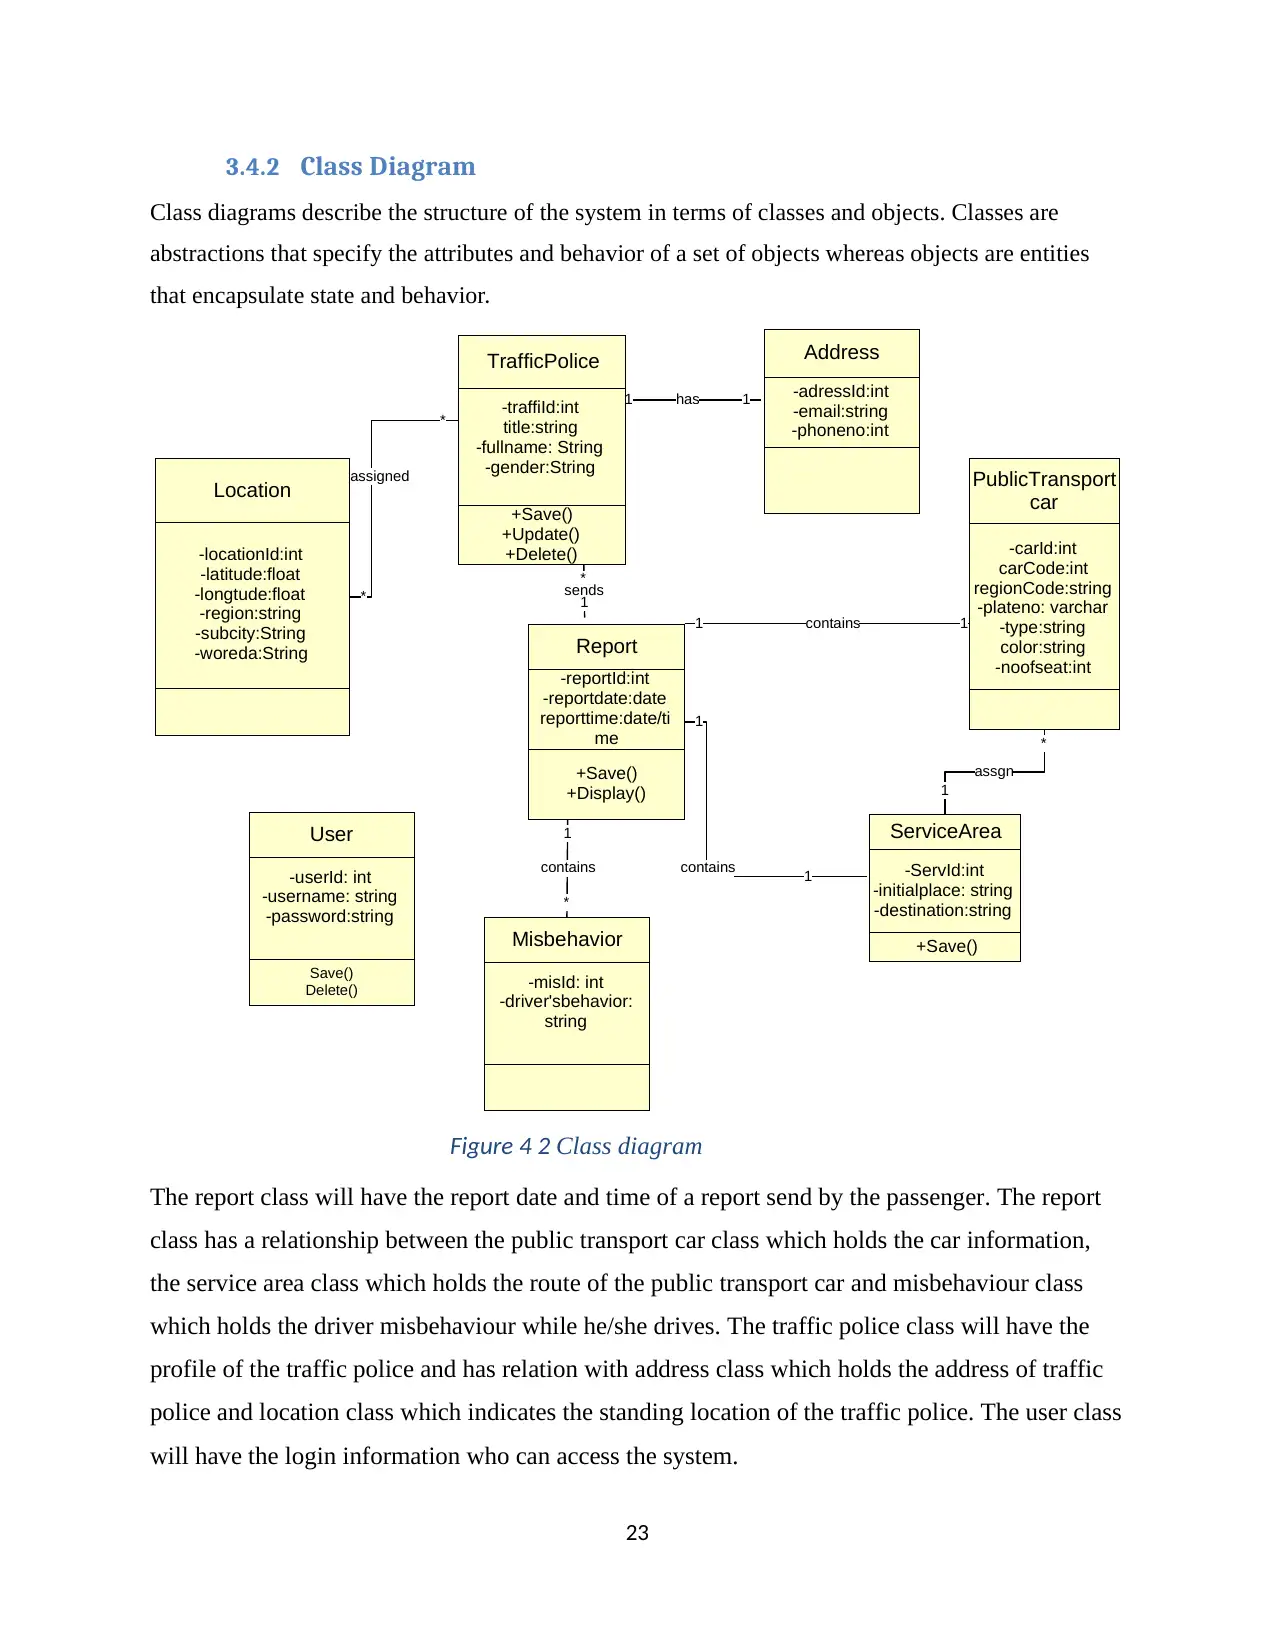
23
3.4.2 Class Diagram
Class diagrams describe the structure of the system in terms of classes and objects. Classes are
abstractions that specify the attributes and behavior of a set of objects whereas objects are entities
that encapsulate state and behavior.
Figure 4 2 Class diagram
The report class will have the report date and time of a report send by the passenger. The report
class has a relationship between the public transport car class which holds the car information,
the service area class which holds the route of the public transport car and misbehaviour class
which holds the driver misbehaviour while he/she drives. The traffic police class will have the
profile of the traffic police and has relation with address class which holds the address of traffic
police and location class which indicates the standing location of the traffic police. The user class
will have the login information who can access the system.
*
is assigned
*
1 has 1
1 contains 1
1
contains 1
1
contains
*
*
assgn
1
1
sends
*
PublicTransport
car
-carId:int
carCode:int
regionCode:string
-plateno: varchar
-type:string
color:string
-noofseat:int
TrafficPolice
-traffiId:int
title:string
-fullname: String
-gender:String
+Save()
+Update()
+Delete()
Location
-locationId:int
-latitude:float
-longtude:float
-region:string
-subcity:String
-woreda:String Report
-reportId:int
-reportdate:date
reporttime:date/ti
me
+Save()
+Display()
Address
-adressId:int
-email:string
-phoneno:int
ServiceArea
-ServId:int
-initialplace: string
-destination:string
+Save()Misbehavior
-misId: int
-driver'sbehavior:
string
User
-userId: int
-username: string
-password:string
Save()
Delete()
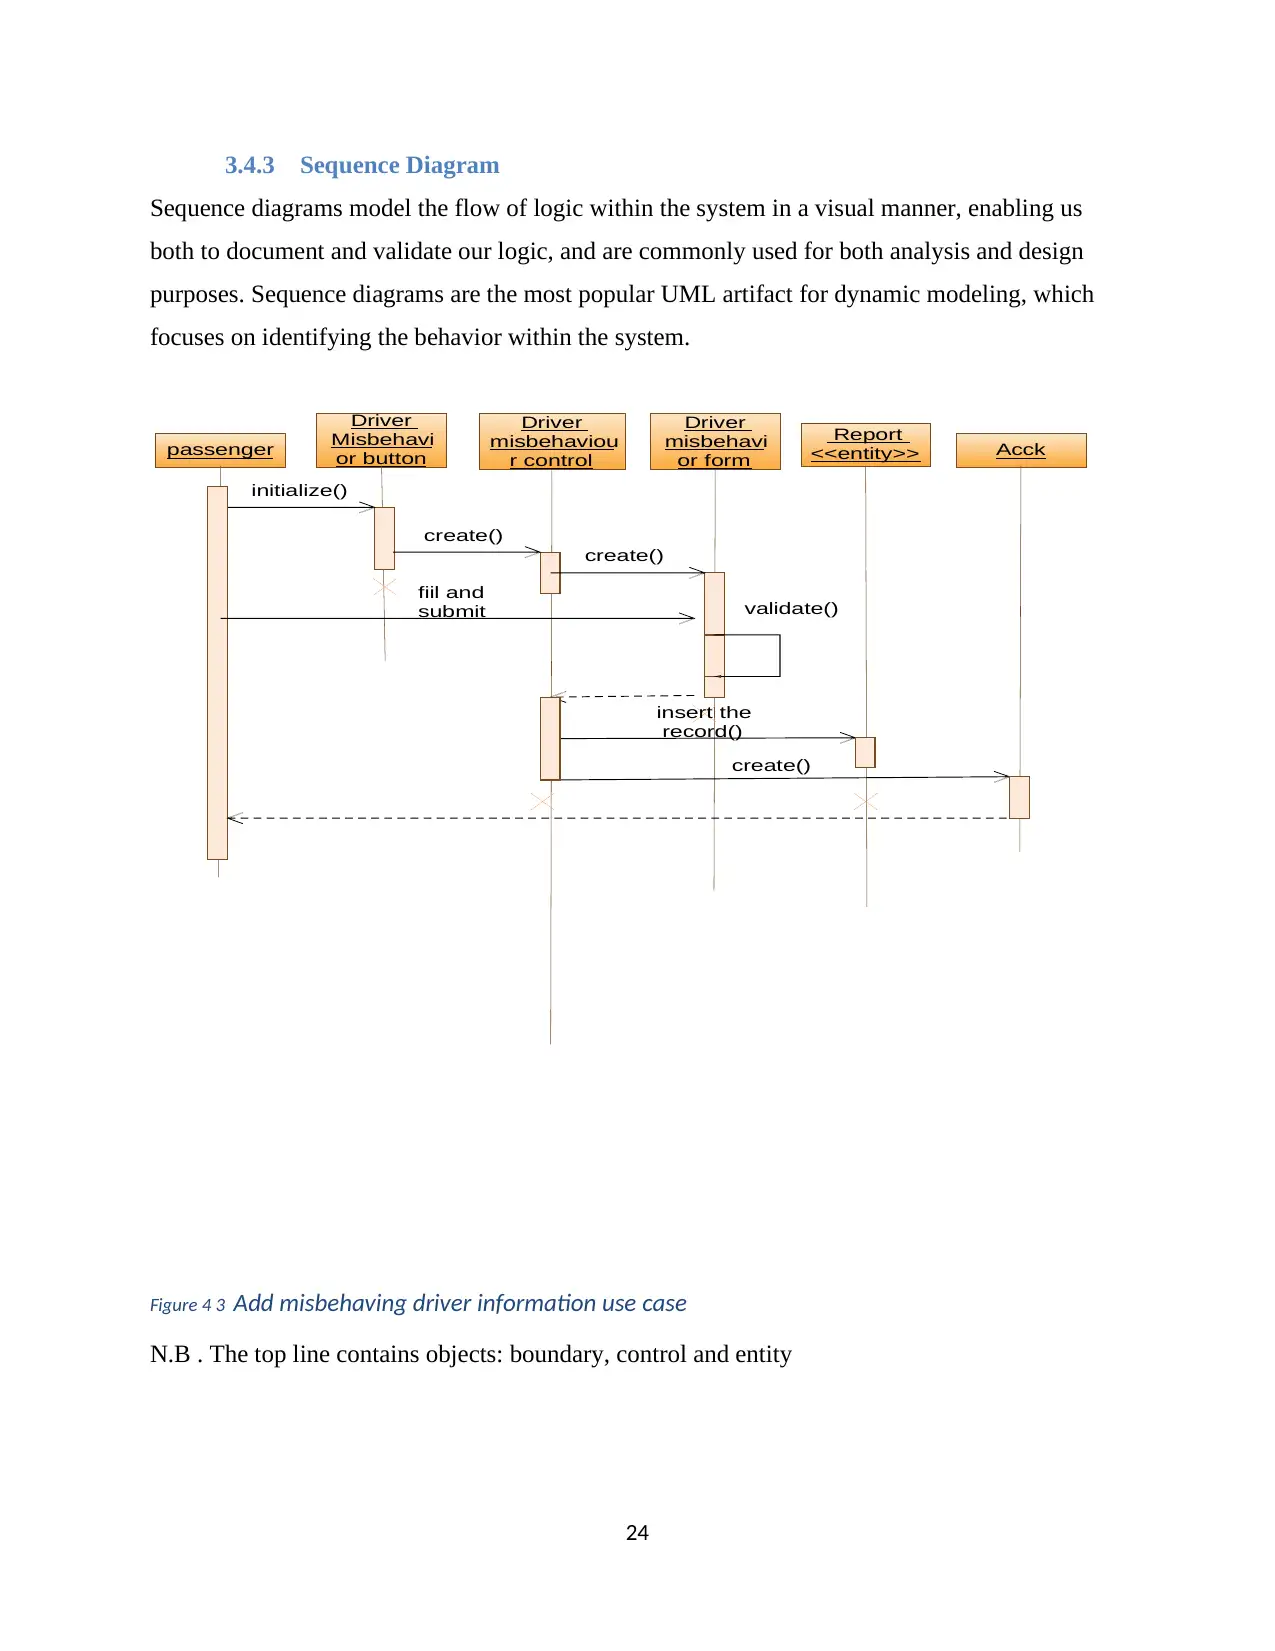
24
3.4.3 Sequence Diagram
Sequence diagrams model the flow of logic within the system in a visual manner, enabling us
both to document and validate our logic, and are commonly used for both analysis and design
purposes. Sequence diagrams are the most popular UML artifact for dynamic modeling, which
focuses on identifying the behavior within the system.
Figure 4 3 Add misbehaving driver information use case
N.B . The top line contains objects: boundary, control and entity
passenger
Driver
Misbehavi
or button
Driver
misbehaviou
r control
Driver
misbehavi
or form
Report
<<entity>>
initialize()
create()
validate()
fiil and
submit
Acck
create()
insert the
record()
create()
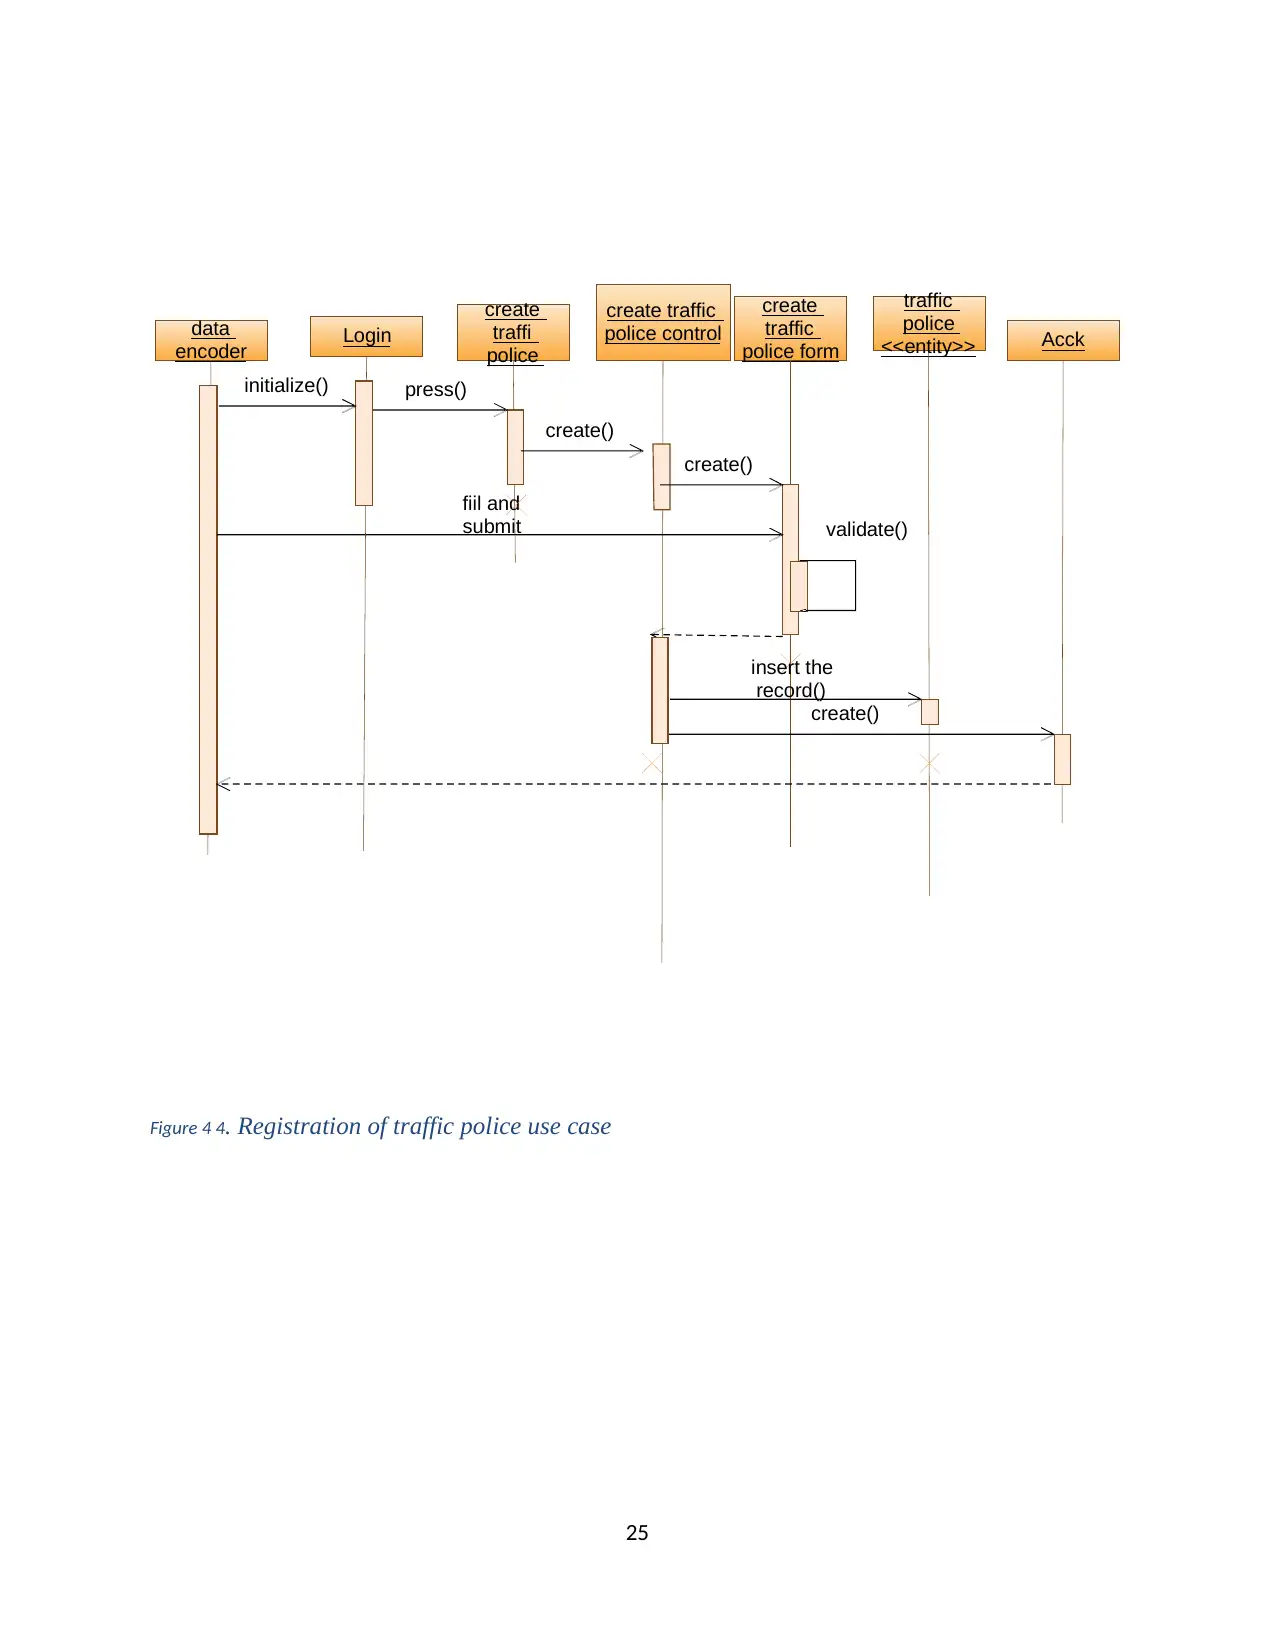
25
Figure 4 4. Registration of traffic police use case
data
encoder
create
traffi
police
create traffic
police control
create
traffic
police form
traffic
police
<<entity>>
press()
create()
validate()
fiil and
submit
Acck
create()
insert the
record()
create()
Login
initialize()
Figure 4 4. Registration of traffic police use case
data
encoder
create
traffi
police
create traffic
police control
create
traffic
police form
traffic
police
<<entity>>
press()
create()
validate()
fiil and
submit
Acck
create()
insert the
record()
create()
Login
initialize()
Secure Best Marks with AI Grader
Need help grading? Try our AI Grader for instant feedback on your assignments.
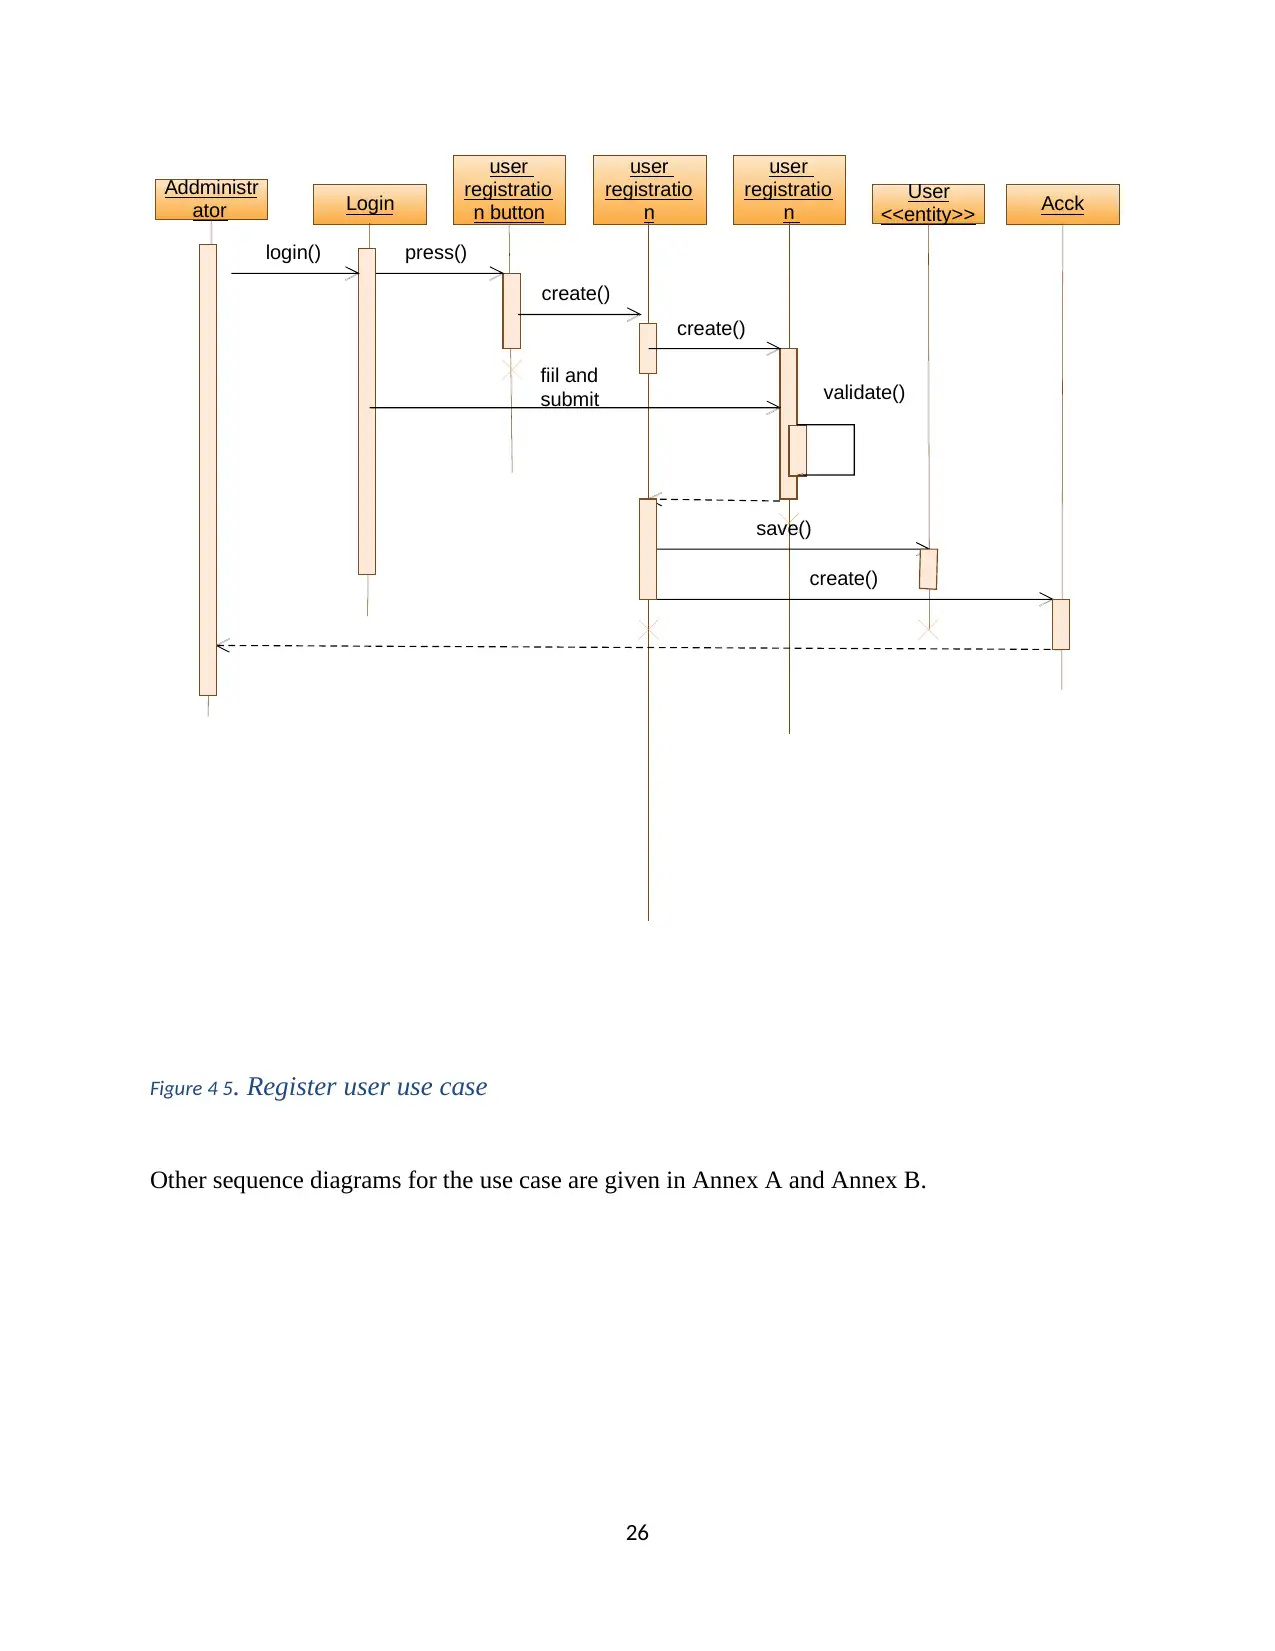
26
Figure 4 5. Register user use case
Other sequence diagrams for the use case are given in Annex A and Annex B.
Login
user
registratio
n button
user
registratio
n
user
registratio
n
User
<<entity>>
press()
create()
validate()
fiil and
submit
Acck
create()
save()
create()
Addministr
ator
login()
Figure 4 5. Register user use case
Other sequence diagrams for the use case are given in Annex A and Annex B.
Login
user
registratio
n button
user
registratio
n
user
registratio
n
User
<<entity>>
press()
create()
validate()
fiil and
submit
Acck
create()
save()
create()
Addministr
ator
login()
27
Chapter Five: System Design
The proposed system is designed based on the functional and non-functional requirements and
analysis models defined in the previous Chapter. Consequently, the design goals, architecture,
subsystem decomposition, deployment diagram, persistent data management of the new system
have been identified, designed and presented in this section.
5.1 Design Goal
Design Goals describe the qualities of the system that developers should optimize. Such goals
are normally derived from the non-functional requirements of the system that are written in the
system analysis document. In this particular project, the following design goal have been
identified to be realistic.
➢ Response Time: The system will provide as fast response as possible, at least before the
public transport car reach to its destination. In order to minimize the time to response,
good internet connection is required.
➢ Throughput: The system will support a number of users at a time using the available
bandwidth of the system. Since the system is using mobile application, it has to demand
minimal memory and reasonable processing power so that any user can access it
simultaneously with available resources unless there are hardware and Internet
connection constraints.
➢ Reliability: To make the system reliable, thorough testing will be done.
➢ Availability: The system will serve the user at any point in time without interruption as
long as there are internet connection and active GPS.
➢ Extensibility: The system needs to be built considering possible mechanisms for expanding
or enhancing the system to gain new capabilities without making major changes to the
system structure.
➢ Portability: The system can be easily portable to different platforms.
➢ User Interface: In order to make the system user friendly and easy to use, easily
navigate-able visual interface and interactive features will be implemented. So, the
system should provide user friendly and self-explanatory graphical user interface that
eases the interaction of the user with the system.
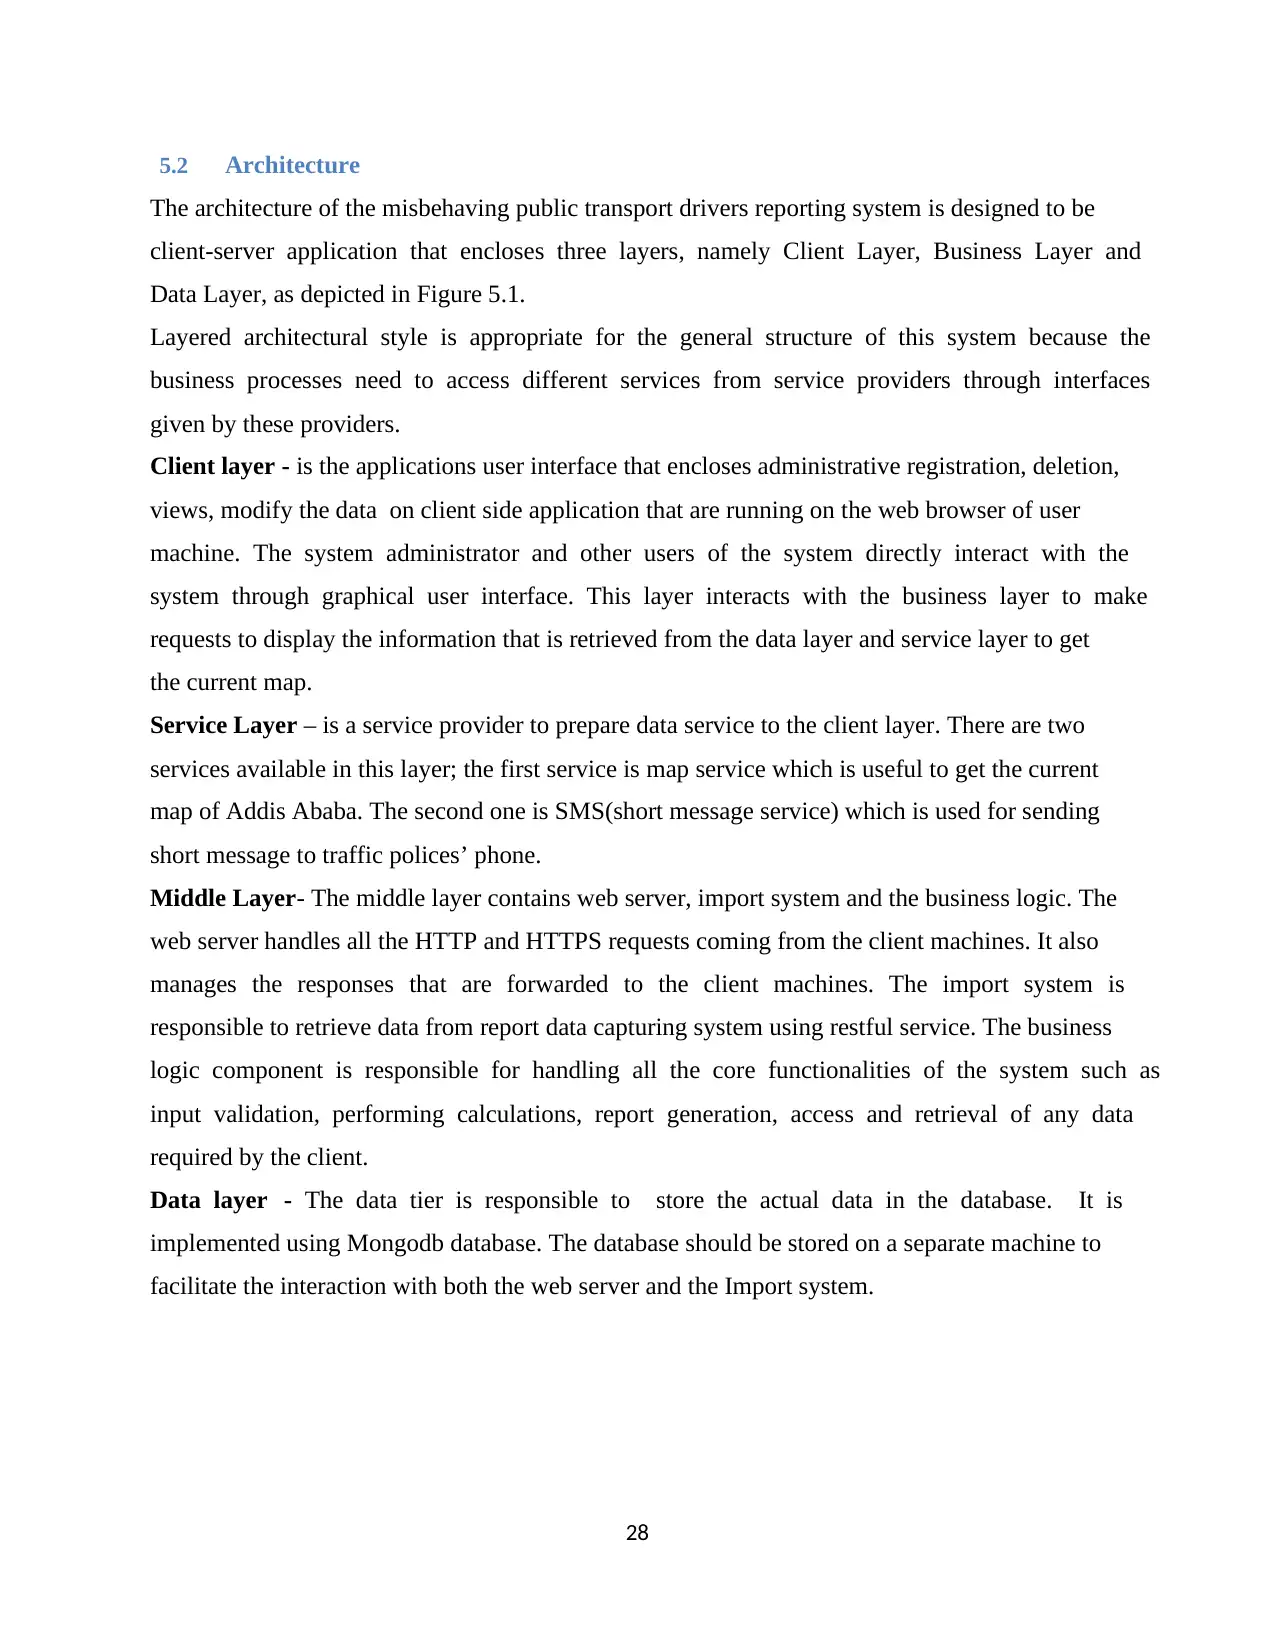
28
5.2 Architecture
The architecture of the misbehaving public transport drivers reporting system is designed to be
client-server application that encloses three layers, namely Client Layer, Business Layer and
Data Layer, as depicted in Figure 5.1.
Layered architectural style is appropriate for the general structure of this system because the
business processes need to access different services from service providers through interfaces
given by these providers.
Client layer - is the applications user interface that encloses administrative registration, deletion,
views, modify the data on client side application that are running on the web browser of user
machine. The system administrator and other users of the system directly interact with the
system through graphical user interface. This layer interacts with the business layer to make
requests to display the information that is retrieved from the data layer and service layer to get
the current map.
Service Layer – is a service provider to prepare data service to the client layer. There are two
services available in this layer; the first service is map service which is useful to get the current
map of Addis Ababa. The second one is SMS(short message service) which is used for sending
short message to traffic polices’ phone.
Middle Layer- The middle layer contains web server, import system and the business logic. The
web server handles all the HTTP and HTTPS requests coming from the client machines. It also
manages the responses that are forwarded to the client machines. The import system is
responsible to retrieve data from report data capturing system using restful service. The business
logic component is responsible for handling all the core functionalities of the system such as
input validation, performing calculations, report generation, access and retrieval of any data
required by the client.
Data layer - The data tier is responsible to store the actual data in the database. It is
implemented using Mongodb database. The database should be stored on a separate machine to
facilitate the interaction with both the web server and the Import system.
Paraphrase This Document
Need a fresh take? Get an instant paraphrase of this document with our AI Paraphraser
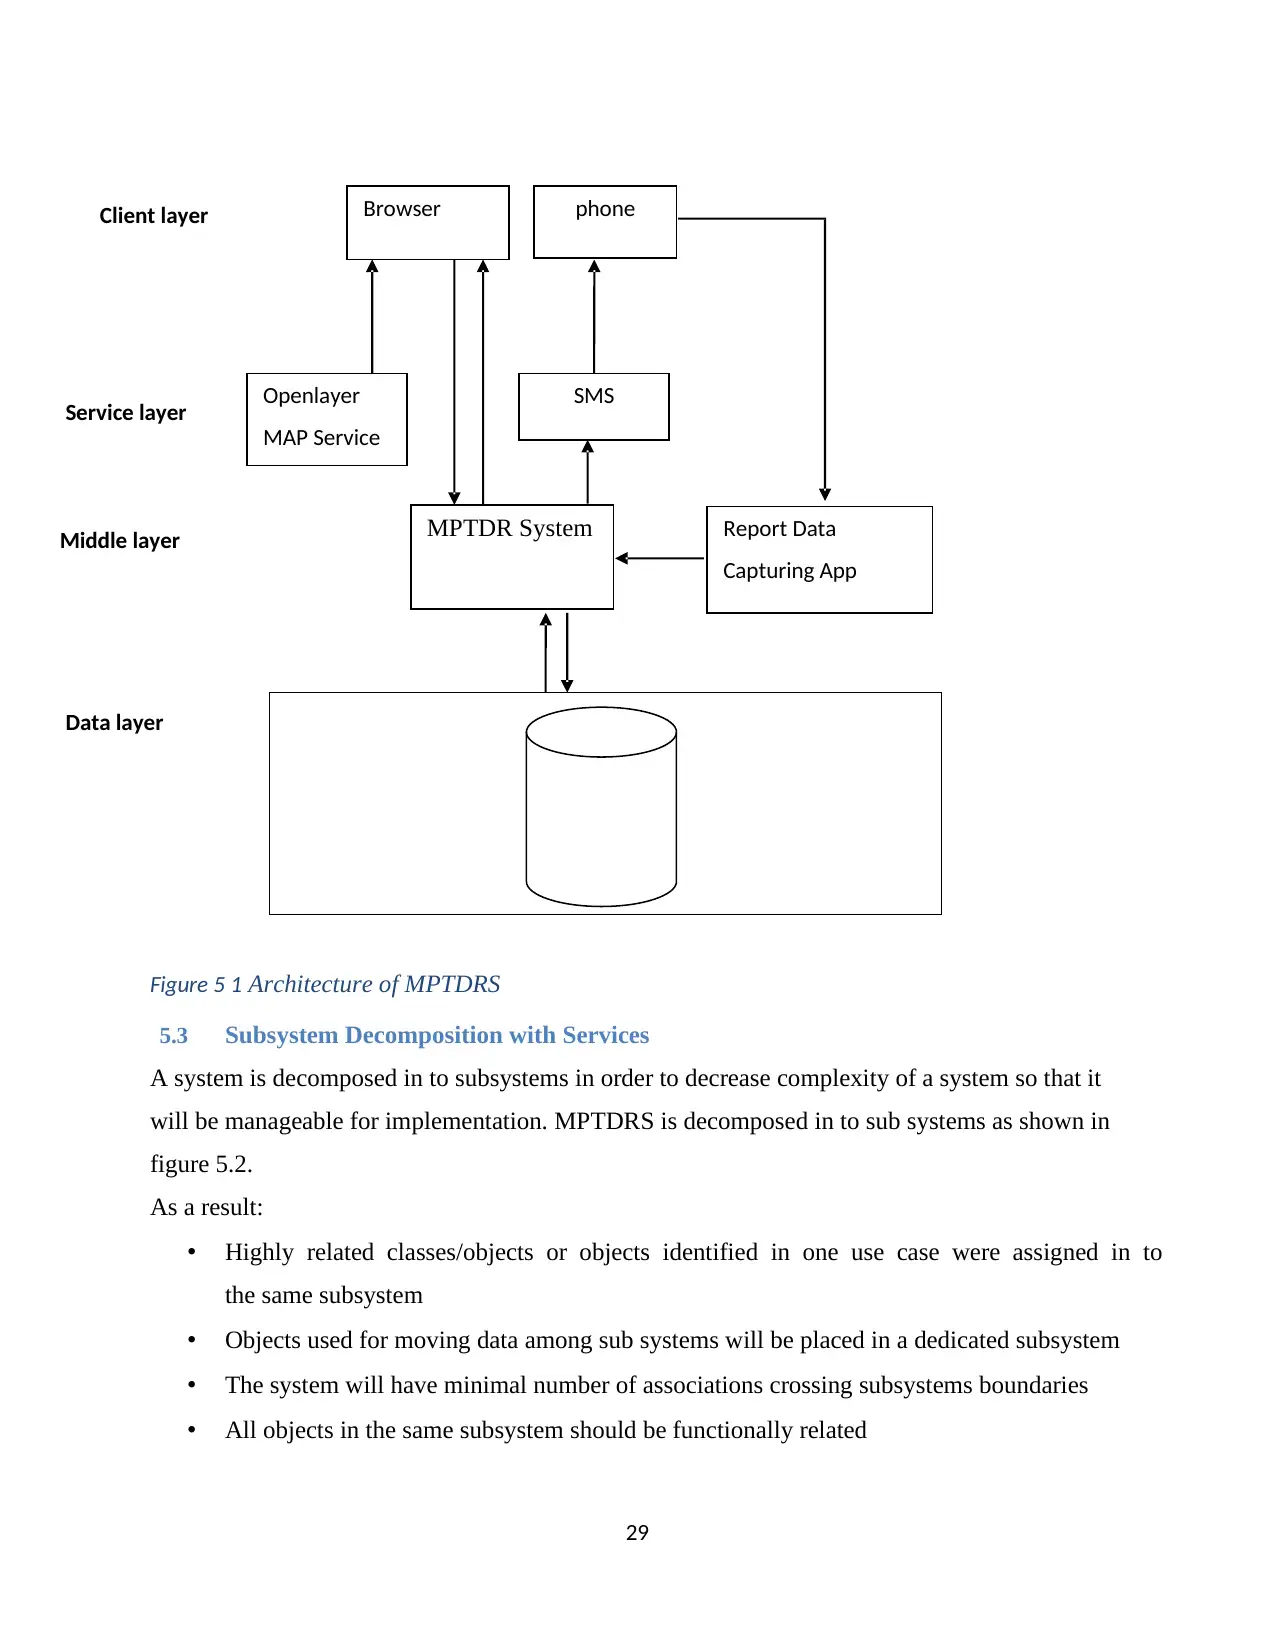
29
Figure 5 1 Architecture of MPTDRS
5.3 Subsystem Decomposition with Services
A system is decomposed in to subsystems in order to decrease complexity of a system so that it
will be manageable for implementation. MPTDRS is decomposed in to sub systems as shown in
figure 5.2.
As a result:
• Highly related classes/objects or objects identified in one use case were assigned in to
the same subsystem
• Objects used for moving data among sub systems will be placed in a dedicated subsystem
• The system will have minimal number of associations crossing subsystems boundaries
• All objects in the same subsystem should be functionally related
Browser
Report Data
Capturing App
SMS
MPTDR System
Openlayer
MAP Service
Client layer
Service layer
Middle layer
Data layer
phone
30
Traffic
Police Address Location
Report
Capture Location
Subsystem
User Interface
Subsystem
Traffic Police
Registration Subsystem
Map Service
Misbehavior
ServiceArea
Misbehave drivers management
Subsystem
PublicTrans
portCar
User management
Subsystem
User
These criteria in general bring high cohesion and low coupling which enhances performance of
the system. The sub systems are: Registration Subsystem, User Interface, Capture/calculate
location Subsystem, Report data capturing Subsystem, Misbehave drivers’ management
Subsystem, Report Subsystem.
Figure 5 2 Subsystem decomposition
Traffic Police Registration Subsystem – The subsystem responsible to manage the information
about the traffic polices and their address.
User Interface Subsystem– the subsystem provides UI components for displaying and editing
contents. It enables the user to see the traffic police location and the information sent by the
passenger/user on the map using browser.
Capture Location Subsystem - The subsystem is responsible to get the location of the report
sender and compare the sender location against the nearest traffic police location.
31
Misbehave Drivers’ Management Subsystem – the subsystem is responsible to retrieve data
from report data capturing subsystem and manage the information of misbehave public transport
drivers and their dangerous action while they drive.
User management Subsystem - The sub system manages information about user registration and
assign role to the user. It provides methods to add update and search information for the mentioned
activities.
5.4 Hardware/Software Mapping
This section shows the relationship among the nodes and the components in the system. The
system contains three hardware components; the client machine, the application server machine
and the database server machine. The client machine contains the web browser that enables
system users to access the application server according to their privilege through HTTP/HTTPs.
The application server or the web server contains the application logic and uses Nodejs to handle
requests send from users through HTTP/s. And finally there is the database server that is used to
perform tasks such as data analysis, storage, data manipulation, archiving, and other non-user
specific tasks. The database server uses document database which is Mongodb. The data access
from the database server using the application server is performed by using server side
javascript. Figure 5.3 depicts the deployment diagram of MPTDRS.
Secure Best Marks with AI Grader
Need help grading? Try our AI Grader for instant feedback on your assignments.
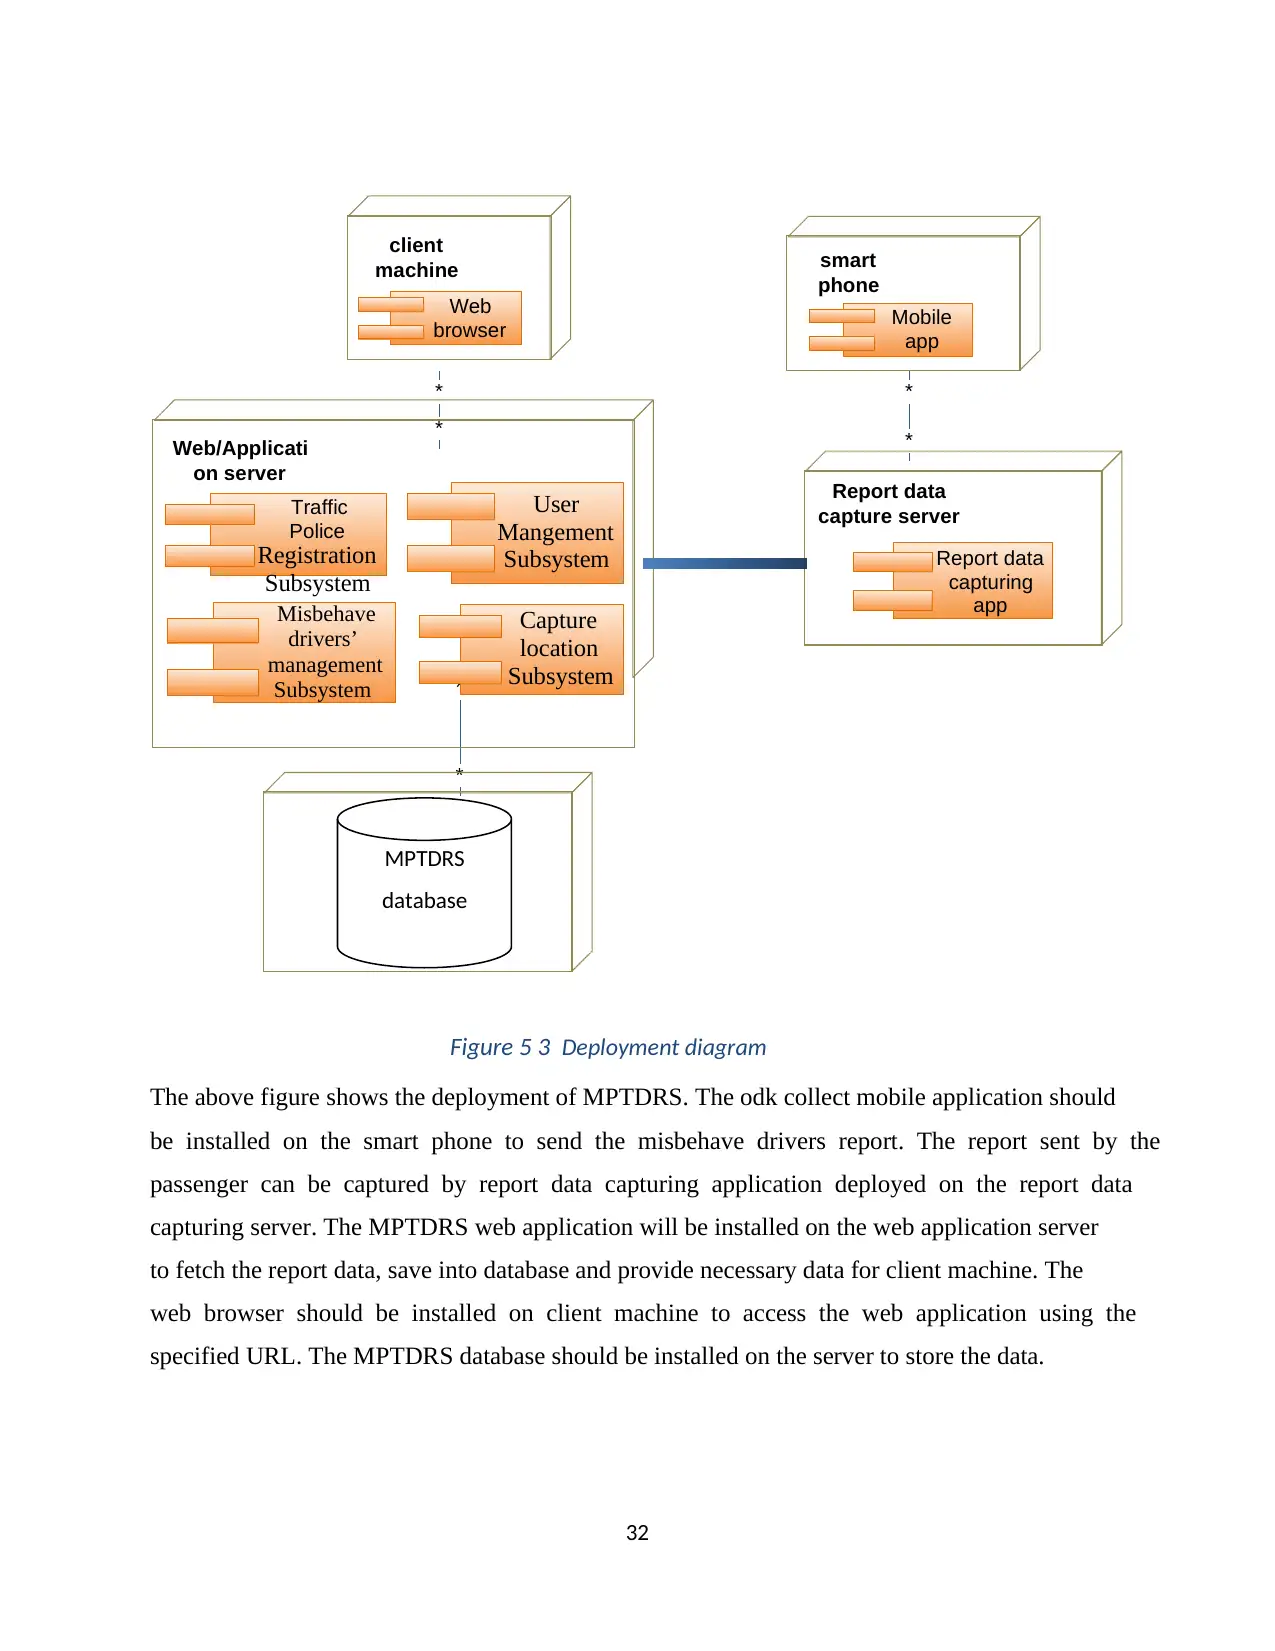
32
Figure 5 3 Deployment diagram
The above figure shows the deployment of MPTDRS. The odk collect mobile application should
be installed on the smart phone to send the misbehave drivers report. The report sent by the
passenger can be captured by report data capturing application deployed on the report data
capturing server. The MPTDRS web application will be installed on the web application server
to fetch the report data, save into database and provide necessary data for client machine. The
web browser should be installed on client machine to access the web application using the
specified URL. The MPTDRS database should be installed on the server to store the data.
*
*
*
*
*
*
Web
browser
User
Mangement
Subsystem
Traffic
Police
Registration
Subsystem
Misbehave
drivers’
management
Subsystem
Report data
capturing
app
client
machine
Web/Applicati
on server Report data
capture server
Mobile
app
smart
phone
Capture
location
Subsystem
MPTDRS
database
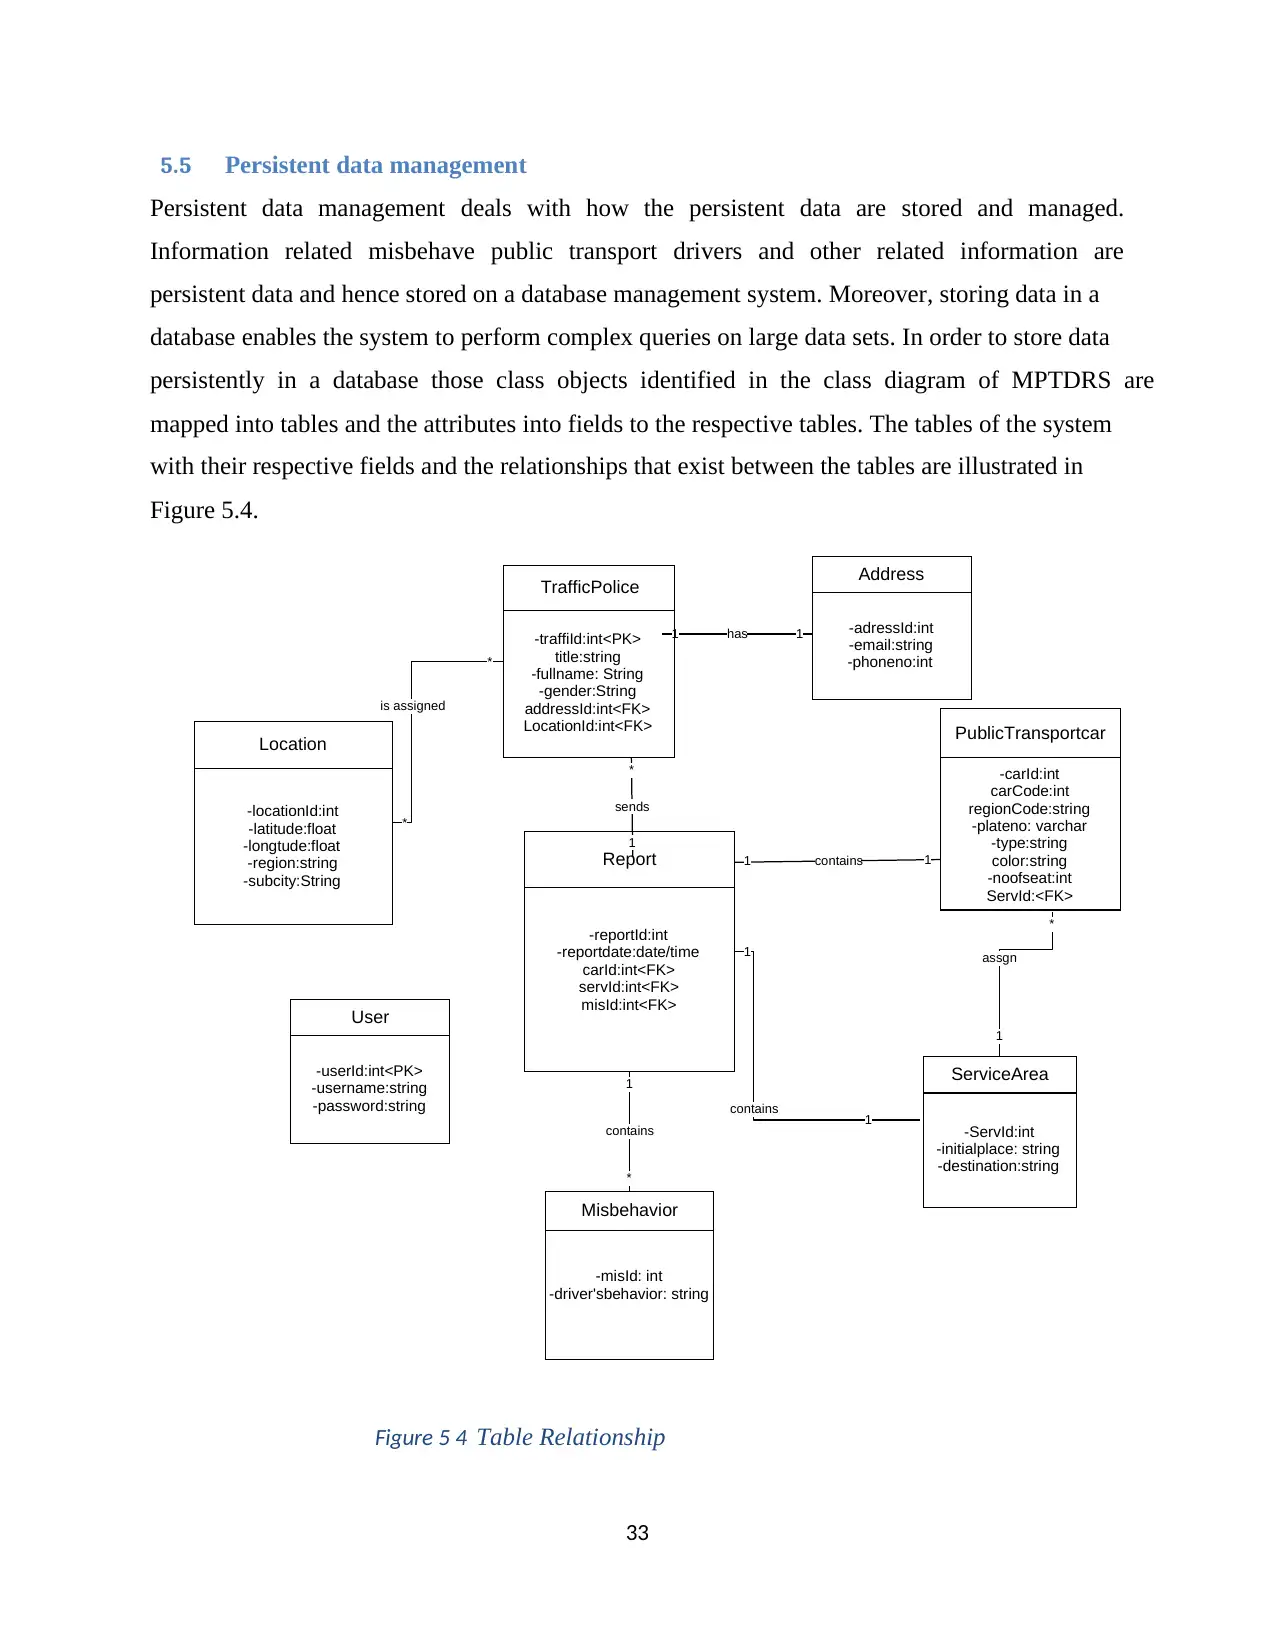
33
5.5 Persistent data management
Persistent data management deals with how the persistent data are stored and managed.
Information related misbehave public transport drivers and other related information are
persistent data and hence stored on a database management system. Moreover, storing data in a
database enables the system to perform complex queries on large data sets. In order to store data
persistently in a database those class objects identified in the class diagram of MPTDRS are
mapped into tables and the attributes into fields to the respective tables. The tables of the system
with their respective fields and the relationships that exist between the tables are illustrated in
Figure 5.4.
Figure 5 4 Table Relationship
*
is assigned
*
1 has 1
1 contains 1
1
contains 1
1
contains
*
*
assgn
1
1
sends
*
PublicTransportcar
-carId:int
carCode:int
regionCode:string
-plateno: varchar
-type:string
color:string
-noofseat:int
ServId:<FK>
TrafficPolice
-traffiId:int<PK>
title:string
-fullname: String
-gender:String
addressId:int<FK>
LocationId:int<FK>
Location
-locationId:int
-latitude:float
-longtude:float
-region:string
-subcity:String
Report
-reportId:int
-reportdate:date/time
carId:int<FK>
servId:int<FK>
misId:int<FK>
Address
-adressId:int
-email:string
-phoneno:int
ServiceArea
-ServId:int
-initialplace: string
-destination:string
Misbehavior
-misId: int
-driver'sbehavior: string
User
-userId:int<PK>
-username:string
-password:string
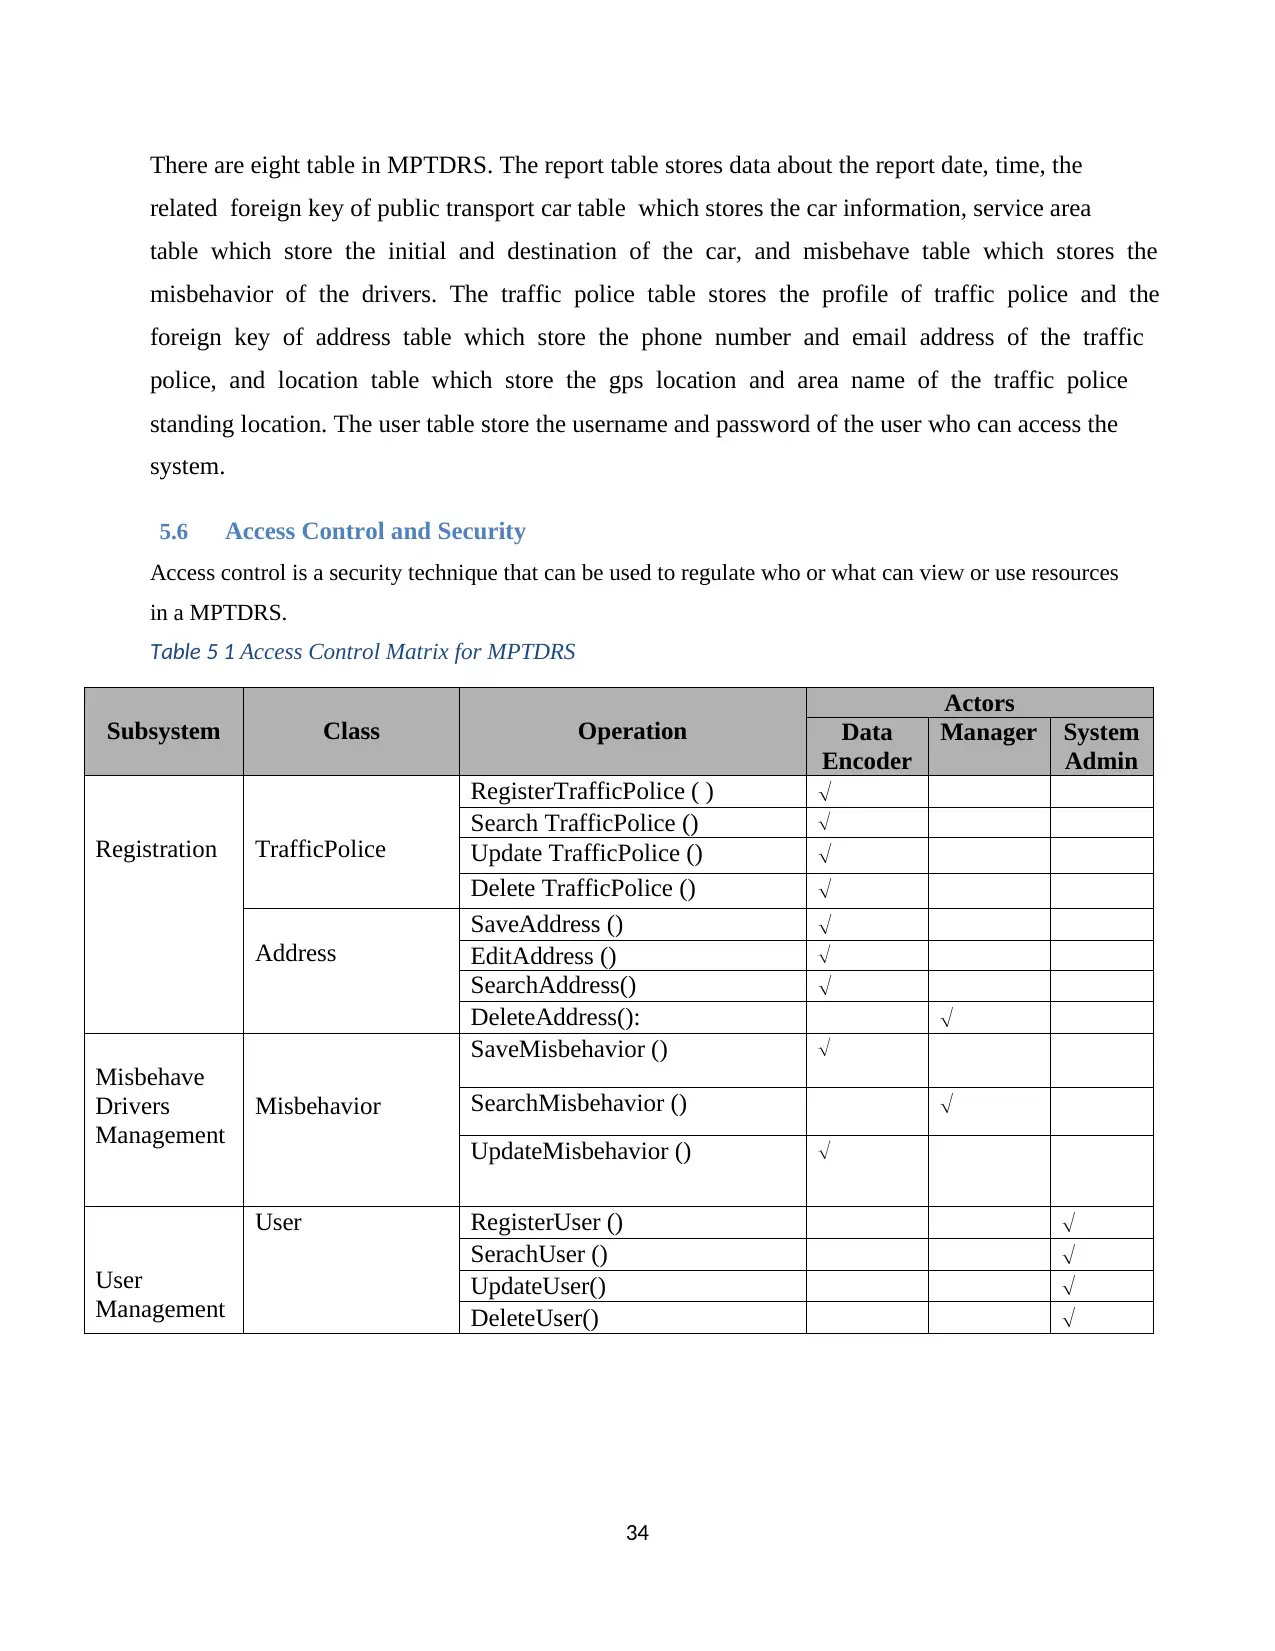
34
There are eight table in MPTDRS. The report table stores data about the report date, time, the
related foreign key of public transport car table which stores the car information, service area
table which store the initial and destination of the car, and misbehave table which stores the
misbehavior of the drivers. The traffic police table stores the profile of traffic police and the
foreign key of address table which store the phone number and email address of the traffic
police, and location table which store the gps location and area name of the traffic police
standing location. The user table store the username and password of the user who can access the
system.
5.6 Access Control and Security
Access control is a security technique that can be used to regulate who or what can view or use resources
in a MPTDRS.
Table 5 1 Access Control Matrix for MPTDRS
Subsystem Class Operation
Actors
Data
Encoder
Manager System
Admin
Registration TrafficPolice
RegisterTrafficPolice ( )
Search TrafficPolice ()
Update TrafficPolice ()
Delete TrafficPolice ()
Address
SaveAddress ()
EditAddress ()
SearchAddress()
DeleteAddress():
Misbehave
Drivers
Management
Misbehavior
SaveMisbehavior ()
SearchMisbehavior ()
UpdateMisbehavior ()
User
Management
User RegisterUser ()
SerachUser ()
UpdateUser()
DeleteUser()
Paraphrase This Document
Need a fresh take? Get an instant paraphrase of this document with our AI Paraphraser
35
Chapter six: Implementation
This chapter discusses the System Development Environment and Tools, System Presentation
and Testing and Evaluation of the system.
6.1 Development Environment and Tools
To develop the prototype which can meet the design goals of MPTDRS, different tools and
platforms have been used.
✓ Node.js - is server side java script programming used for accessing data from data
collection application and the development of MPTDRS. It is mostly used for this kind
of real time application.
✓ MongoDB - is used as a database management system to store data of MPTDRS.
MongoDB is no-sql database or document oriented database.
✓ Formhub –is open source and used widely to collected data from anywhere. We used this
data collection application to collect submitted data from passenger.
✓ ODK Collect- is a mobile application used to download, fill and submit the report to the
formhub.
✓ MS-Excell – is used for designing the questions to be uploaded in to formhub. The
passengers will later download from formhub to fill and submit the drivers bad
behaviors.
6.2 Screenshots of the Web application
Login Page: is the first page when we access the MPTDRS using the domain name or the IP
address. Figure 6.1 shows the Login page of the system.
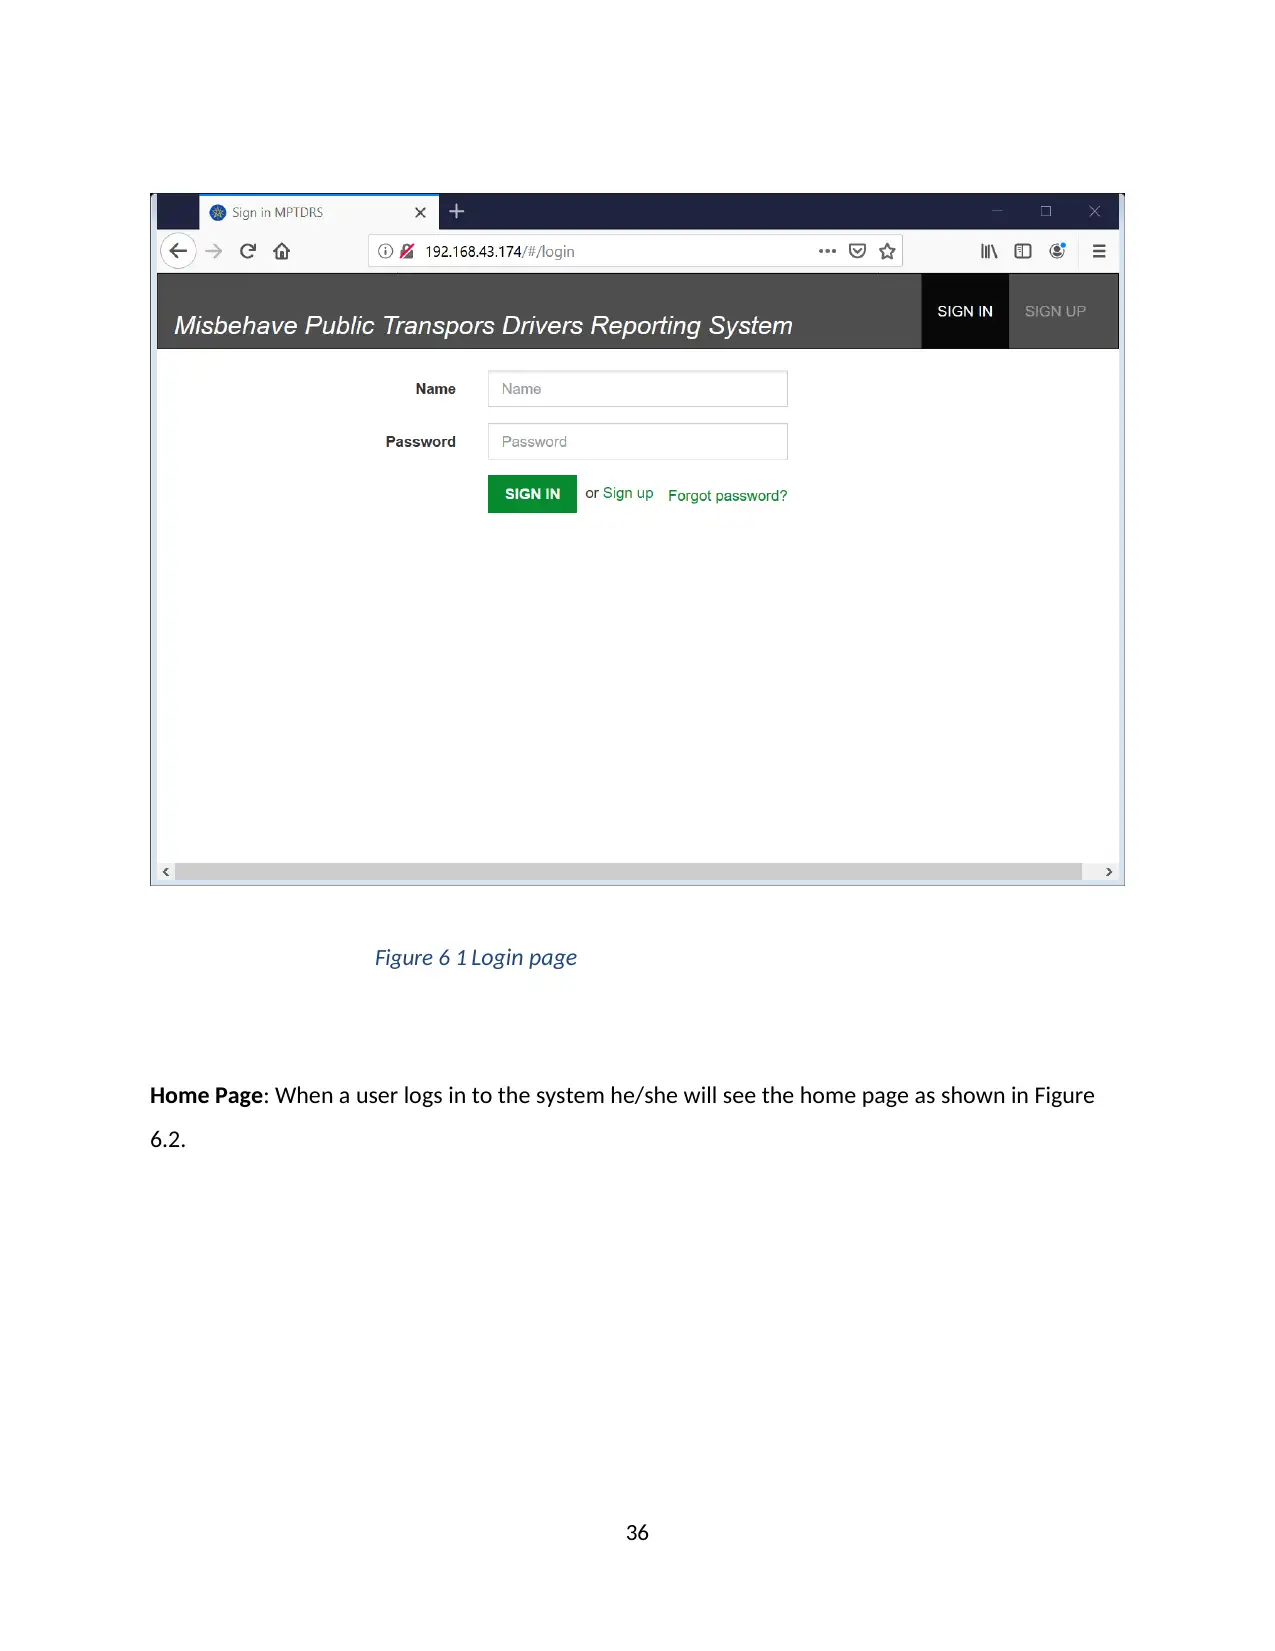
36
Figure 6 1 Login page
Home Page: When a user logs in to the system he/she will see the home page as shown in Figure
6.2.
Figure 6 1 Login page
Home Page: When a user logs in to the system he/she will see the home page as shown in Figure
6.2.
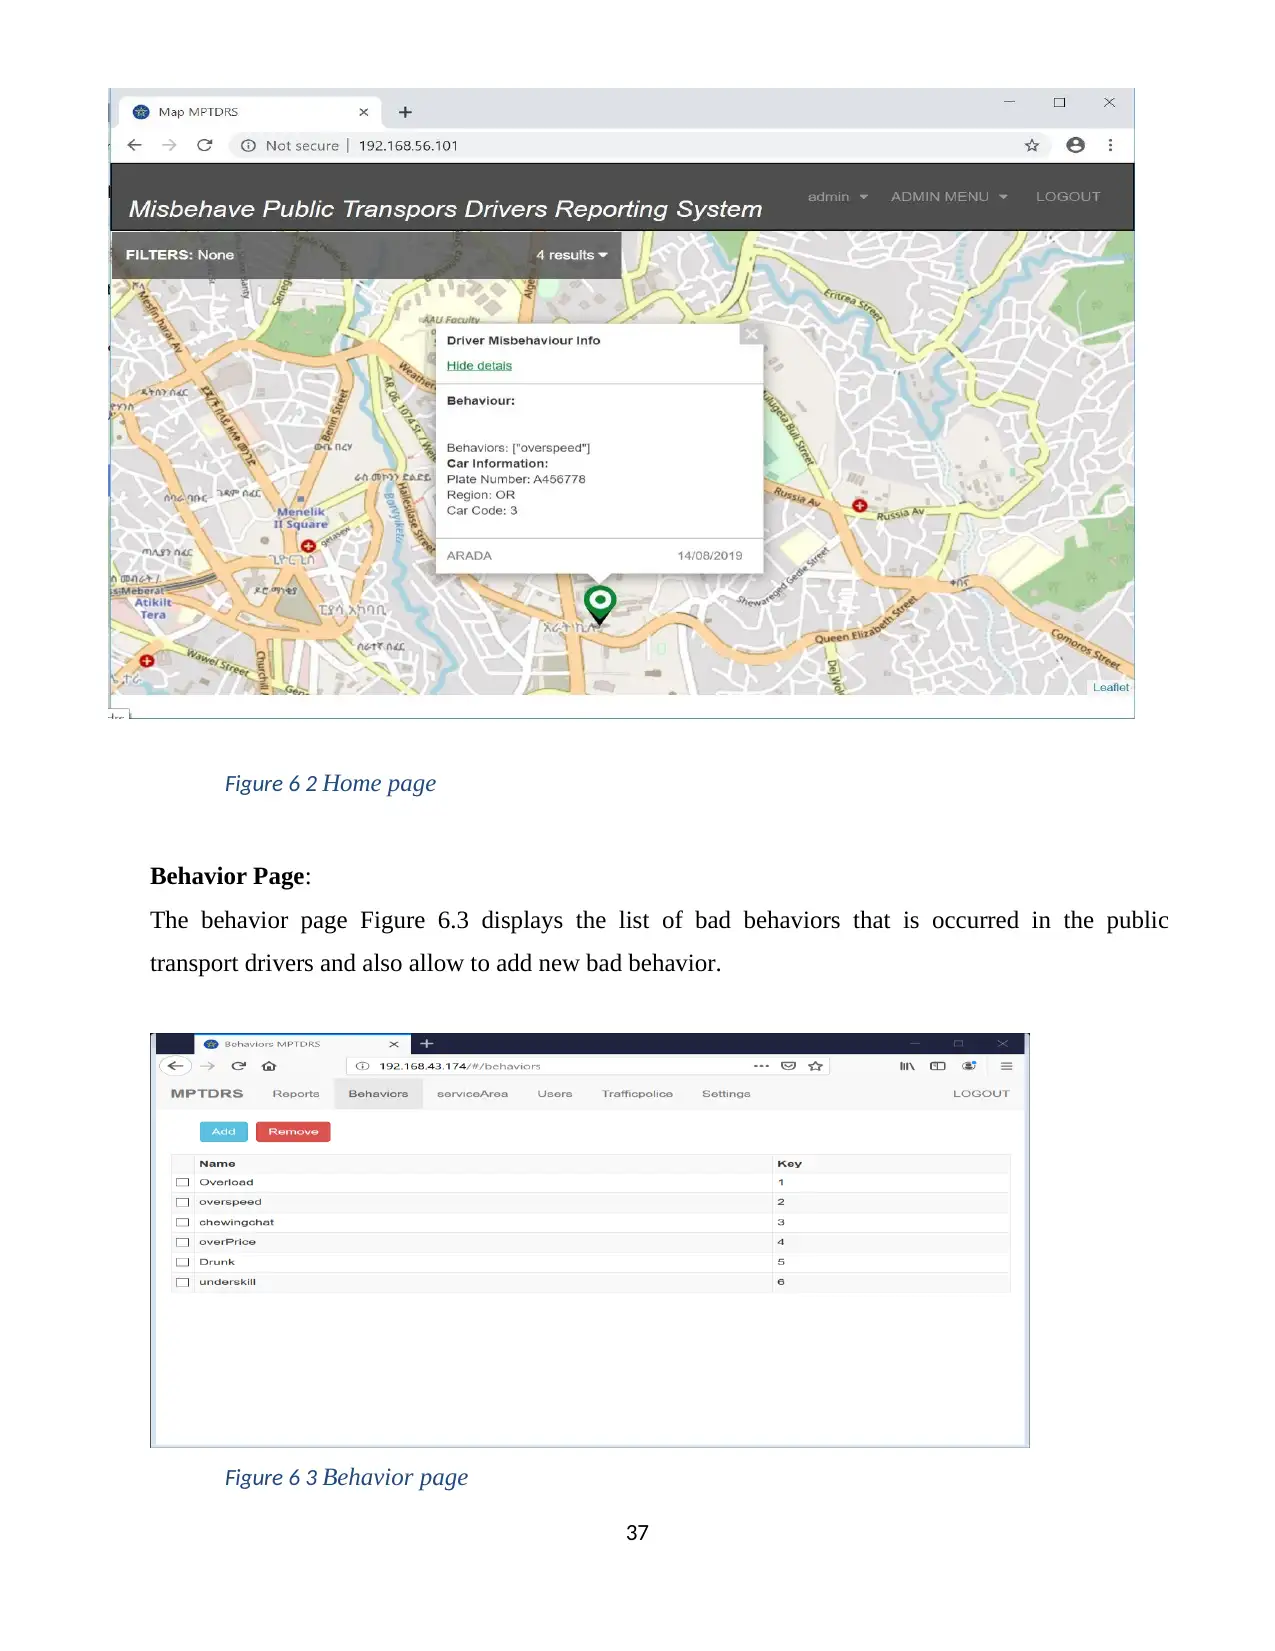
37
Figure 6 2 Home page
Behavior Page:
The behavior page Figure 6.3 displays the list of bad behaviors that is occurred in the public
transport drivers and also allow to add new bad behavior.
Figure 6 3 Behavior page
Figure 6 2 Home page
Behavior Page:
The behavior page Figure 6.3 displays the list of bad behaviors that is occurred in the public
transport drivers and also allow to add new bad behavior.
Figure 6 3 Behavior page
Secure Best Marks with AI Grader
Need help grading? Try our AI Grader for instant feedback on your assignments.
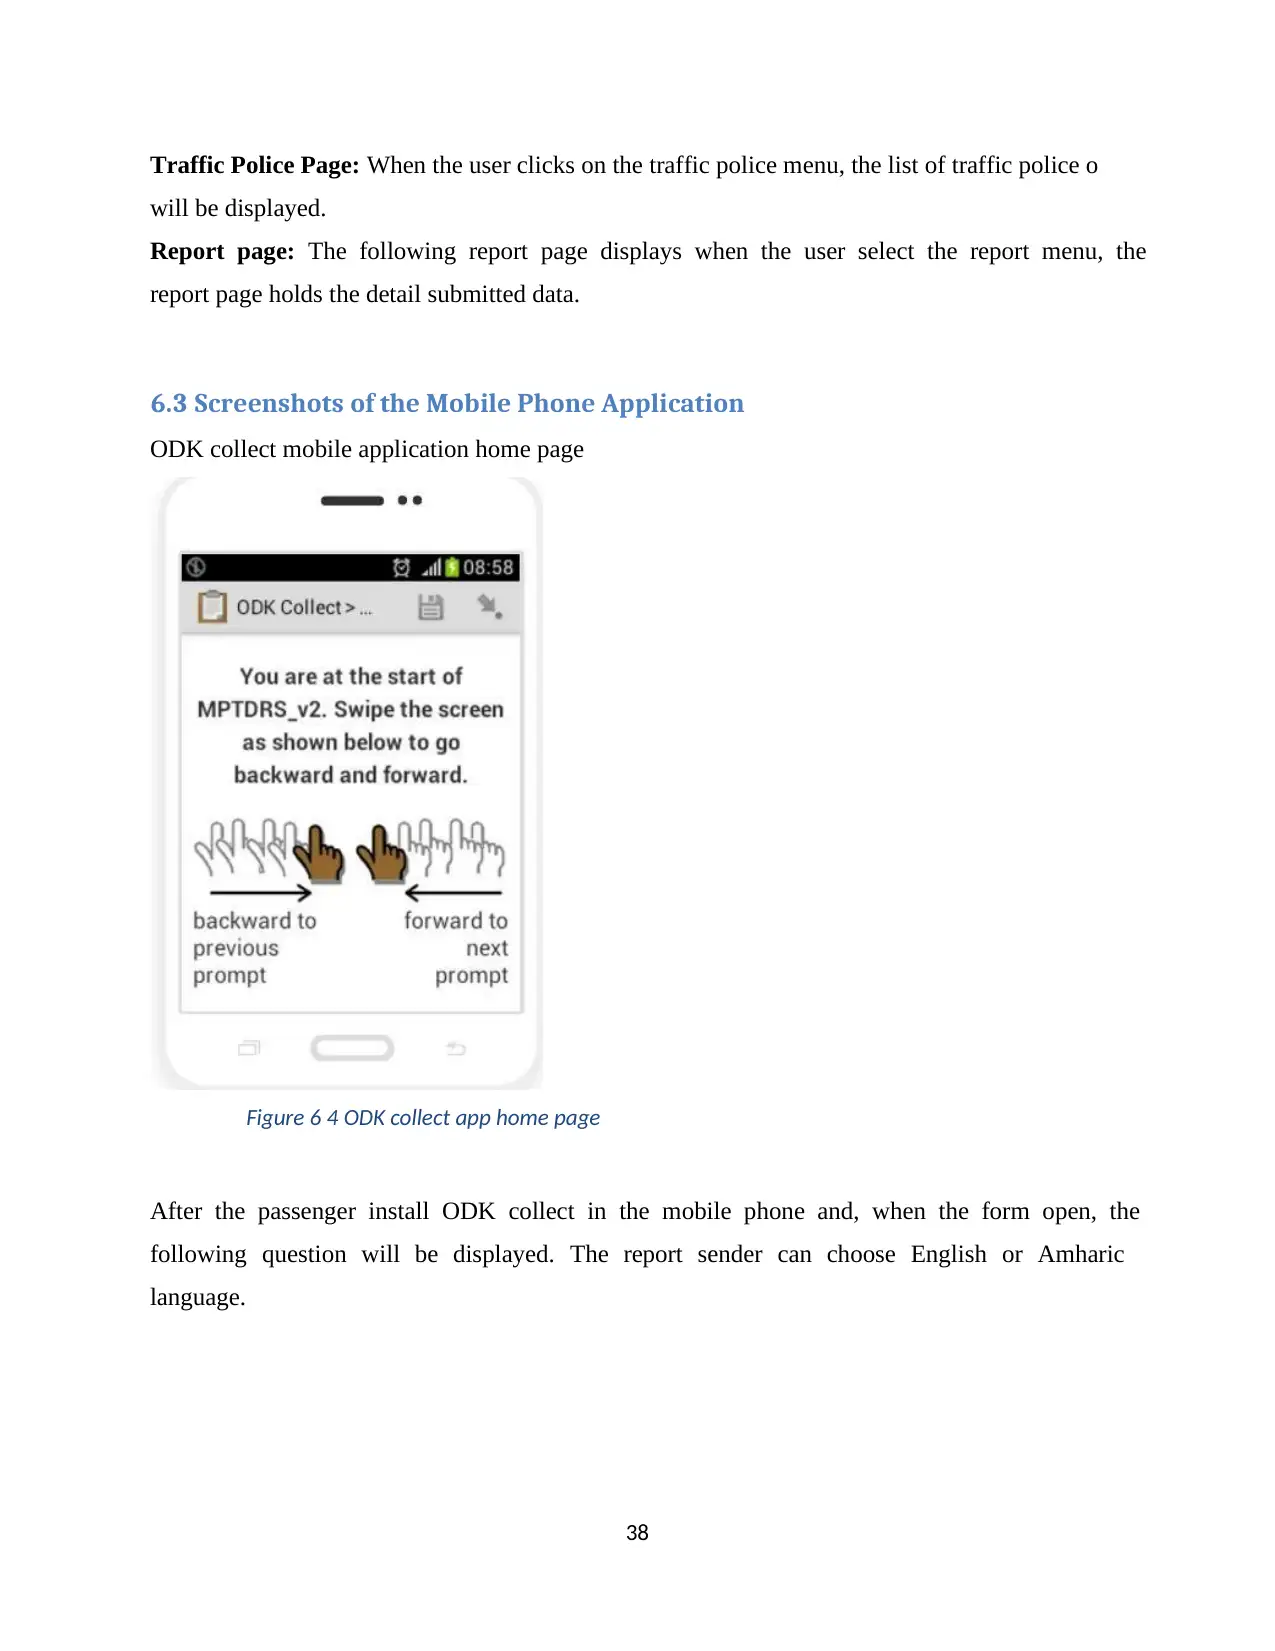
38
Traffic Police Page: When the user clicks on the traffic police menu, the list of traffic police o
will be displayed.
Report page: The following report page displays when the user select the report menu, the
report page holds the detail submitted data.
6.3 Screenshots of the Mobile Phone Application
ODK collect mobile application home page
Figure 6 4 ODK collect app home page
After the passenger install ODK collect in the mobile phone and, when the form open, the
following question will be displayed. The report sender can choose English or Amharic
language.
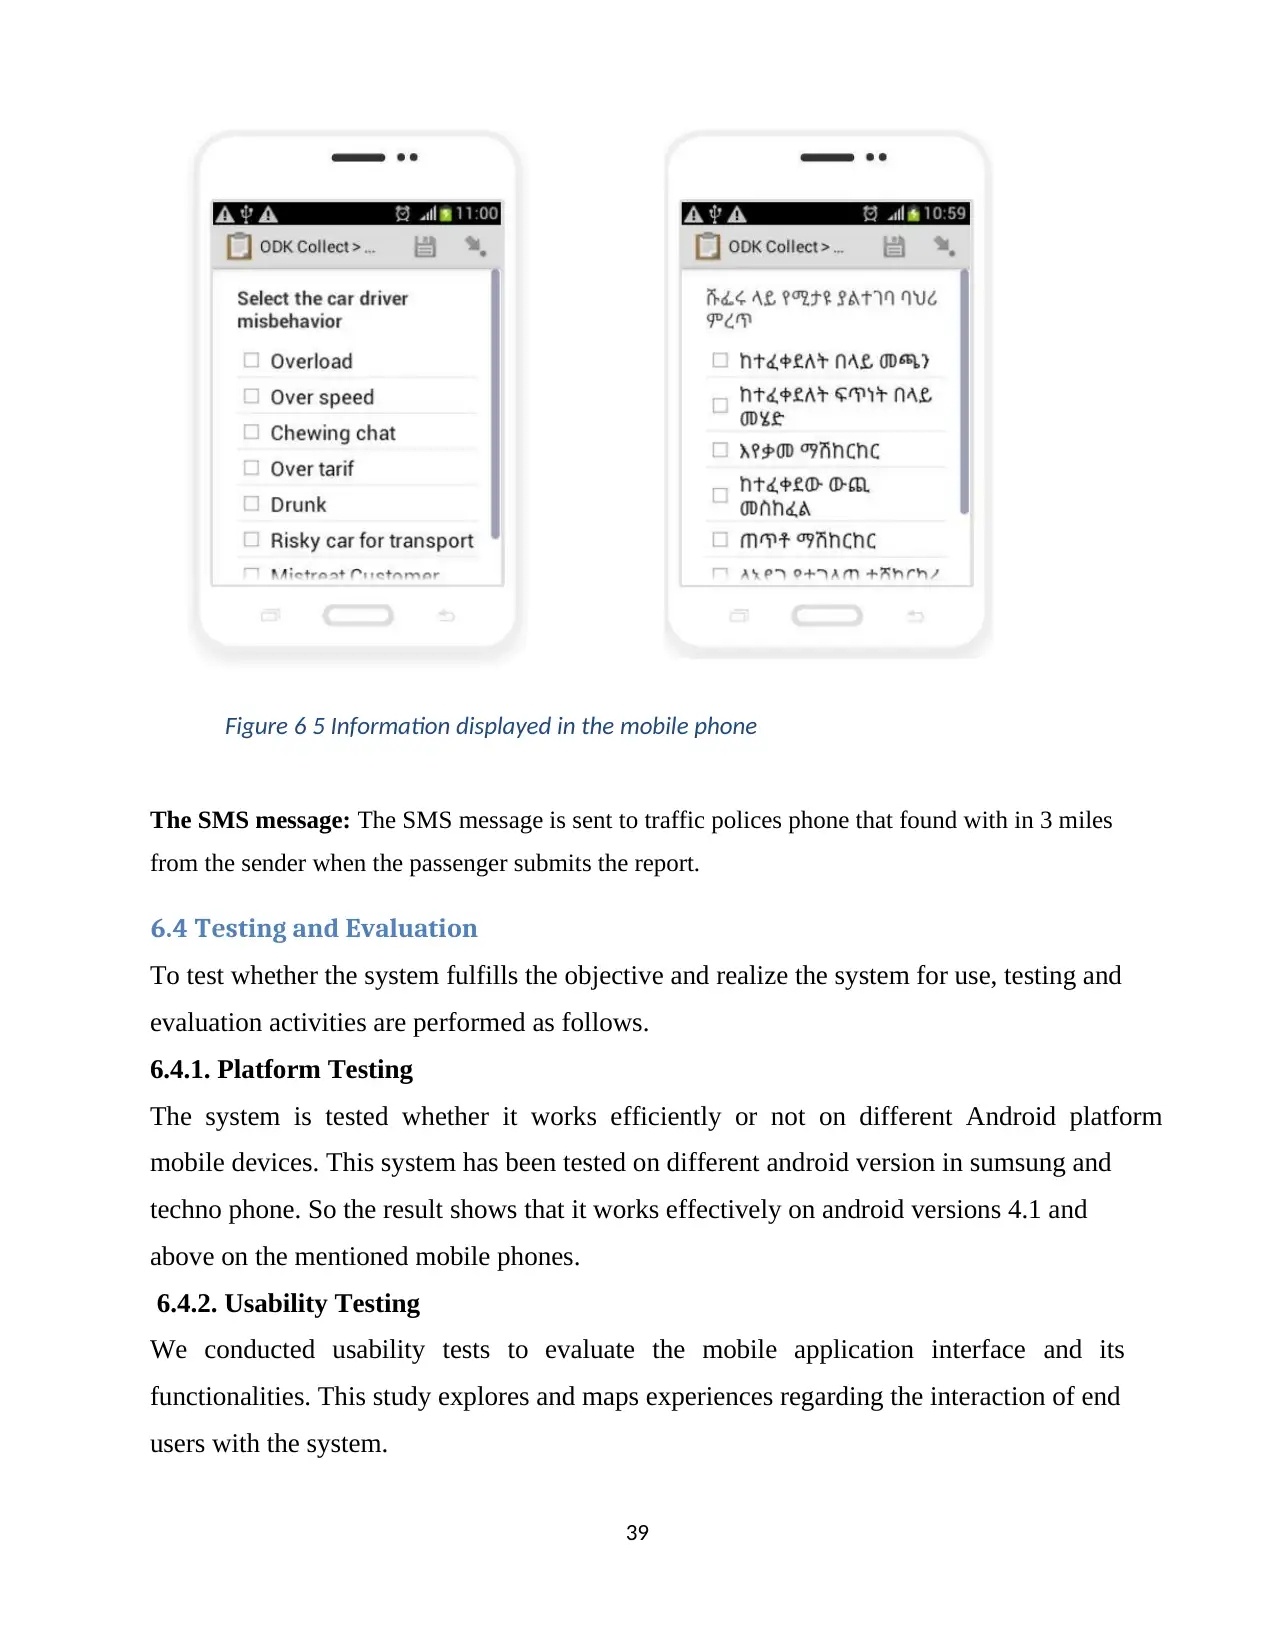
39
Figure 6 5 Information displayed in the mobile phone
The SMS message: The SMS message is sent to traffic polices phone that found with in 3 miles
from the sender when the passenger submits the report.
6.4 Testing and Evaluation
To test whether the system fulfills the objective and realize the system for use, testing and
evaluation activities are performed as follows.
6.4.1. Platform Testing
The system is tested whether it works efficiently or not on different Android platform
mobile devices. This system has been tested on different android version in sumsung and
techno phone. So the result shows that it works effectively on android versions 4.1 and
above on the mentioned mobile phones.
6.4.2. Usability Testing
We conducted usability tests to evaluate the mobile application interface and its
functionalities. This study explores and maps experiences regarding the interaction of end
users with the system.
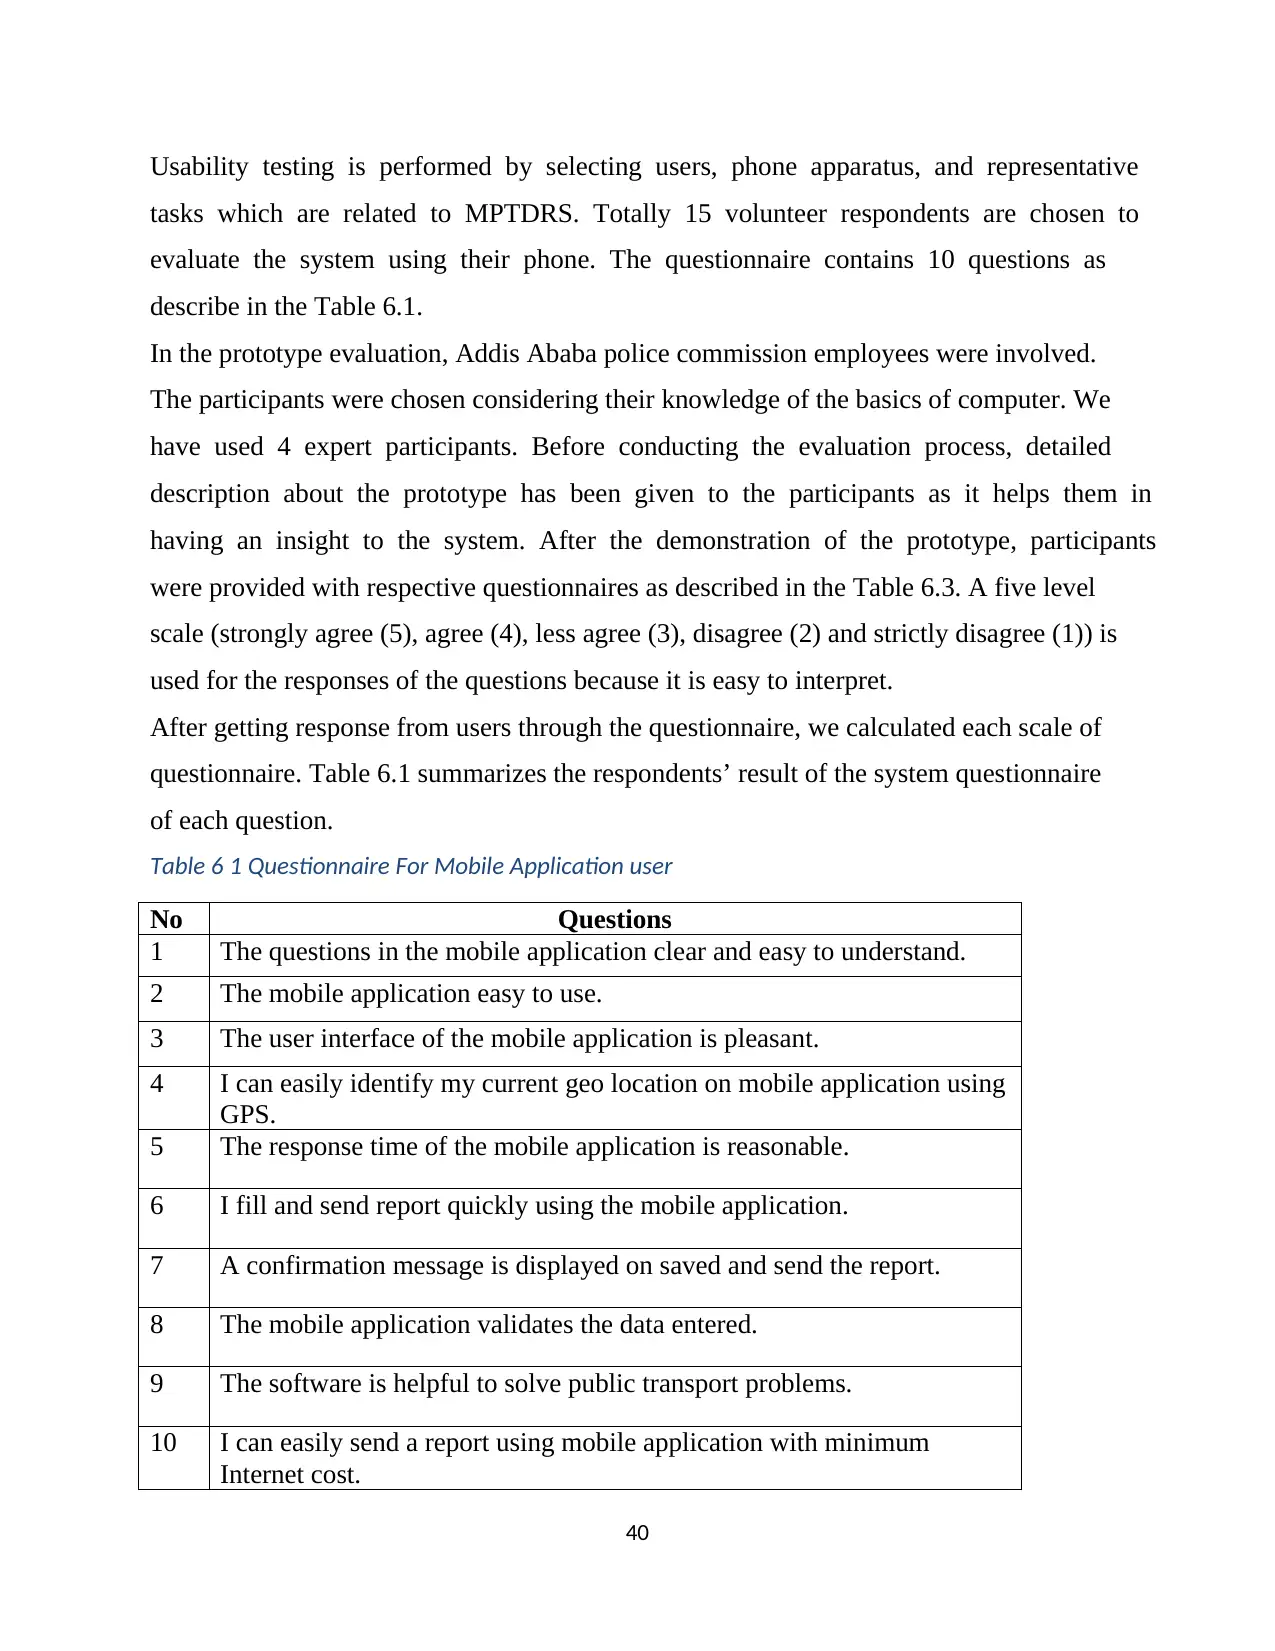
40
Usability testing is performed by selecting users, phone apparatus, and representative
tasks which are related to MPTDRS. Totally 15 volunteer respondents are chosen to
evaluate the system using their phone. The questionnaire contains 10 questions as
describe in the Table 6.1.
In the prototype evaluation, Addis Ababa police commission employees were involved.
The participants were chosen considering their knowledge of the basics of computer. We
have used 4 expert participants. Before conducting the evaluation process, detailed
description about the prototype has been given to the participants as it helps them in
having an insight to the system. After the demonstration of the prototype, participants
were provided with respective questionnaires as described in the Table 6.3. A five level
scale (strongly agree (5), agree (4), less agree (3), disagree (2) and strictly disagree (1)) is
used for the responses of the questions because it is easy to interpret.
After getting response from users through the questionnaire, we calculated each scale of
questionnaire. Table 6.1 summarizes the respondents’ result of the system questionnaire
of each question.
Table 6 1 Questionnaire For Mobile Application user
No Questions
1 The questions in the mobile application clear and easy to understand.
2 The mobile application easy to use.
3 The user interface of the mobile application is pleasant.
4 I can easily identify my current geo location on mobile application using
GPS.
5 The response time of the mobile application is reasonable.
6 I fill and send report quickly using the mobile application.
7 A confirmation message is displayed on saved and send the report.
8 The mobile application validates the data entered.
9 The software is helpful to solve public transport problems.
10 I can easily send a report using mobile application with minimum
Internet cost.
Paraphrase This Document
Need a fresh take? Get an instant paraphrase of this document with our AI Paraphraser
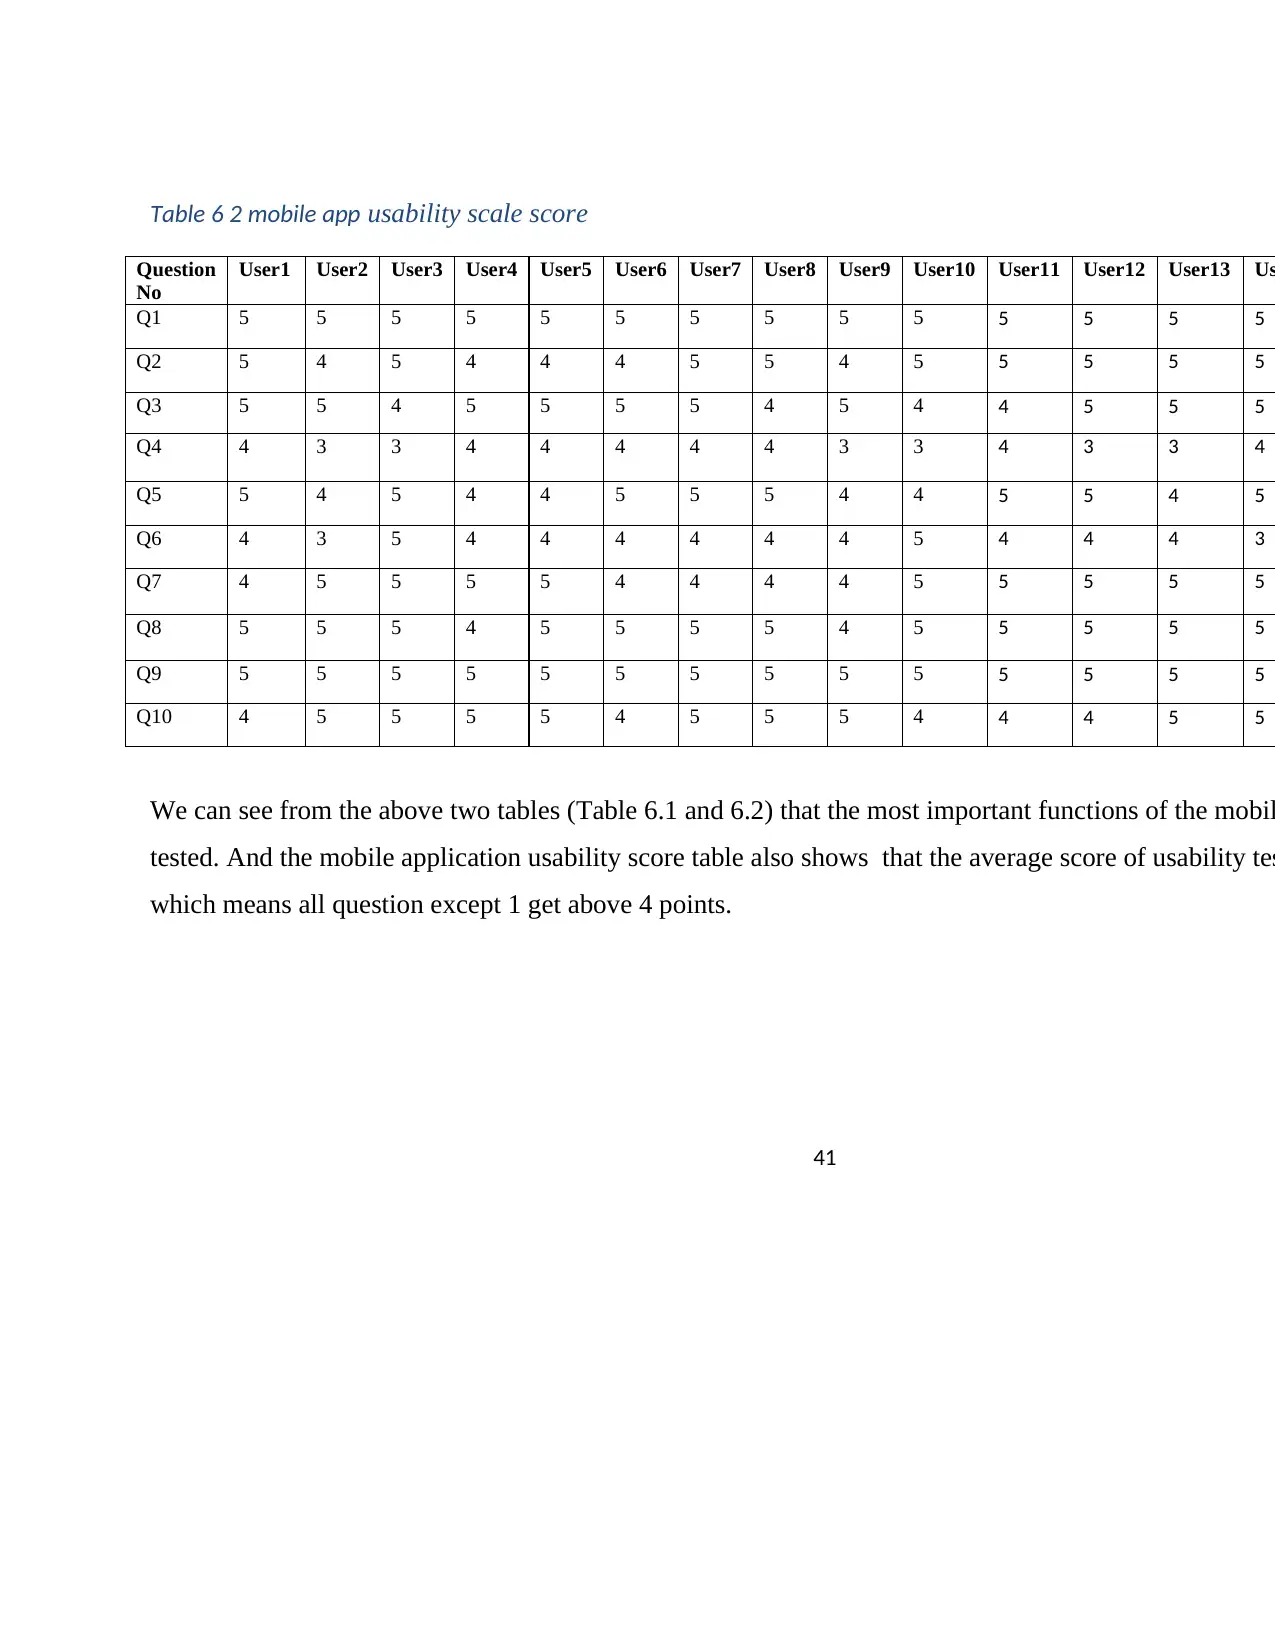
41
Table 6 2 mobile app usability scale score
We can see from the above two tables (Table 6.1 and 6.2) that the most important functions of the mobil
tested. And the mobile application usability score table also shows that the average score of usability tes
which means all question except 1 get above 4 points.
Question
No
User1 User2 User3 User4 User5 User6 User7 User8 User9 User10 User11 User12 User13 Us
Q1 5 5 5 5 5 5 5 5 5 5 5 5 5 5
Q2 5 4 5 4 4 4 5 5 4 5 5 5 5 5
Q3 5 5 4 5 5 5 5 4 5 4 4 5 5 5
Q4 4 3 3 4 4 4 4 4 3 3 4 3 3 4
Q5 5 4 5 4 4 5 5 5 4 4 5 5 4 5
Q6 4 3 5 4 4 4 4 4 4 5 4 4 4 3
Q7 4 5 5 5 5 4 4 4 4 5 5 5 5 5
Q8 5 5 5 4 5 5 5 5 4 5 5 5 5 5
Q9 5 5 5 5 5 5 5 5 5 5 5 5 5 5
Q10 4 5 5 5 5 4 5 5 5 4 4 4 5 5
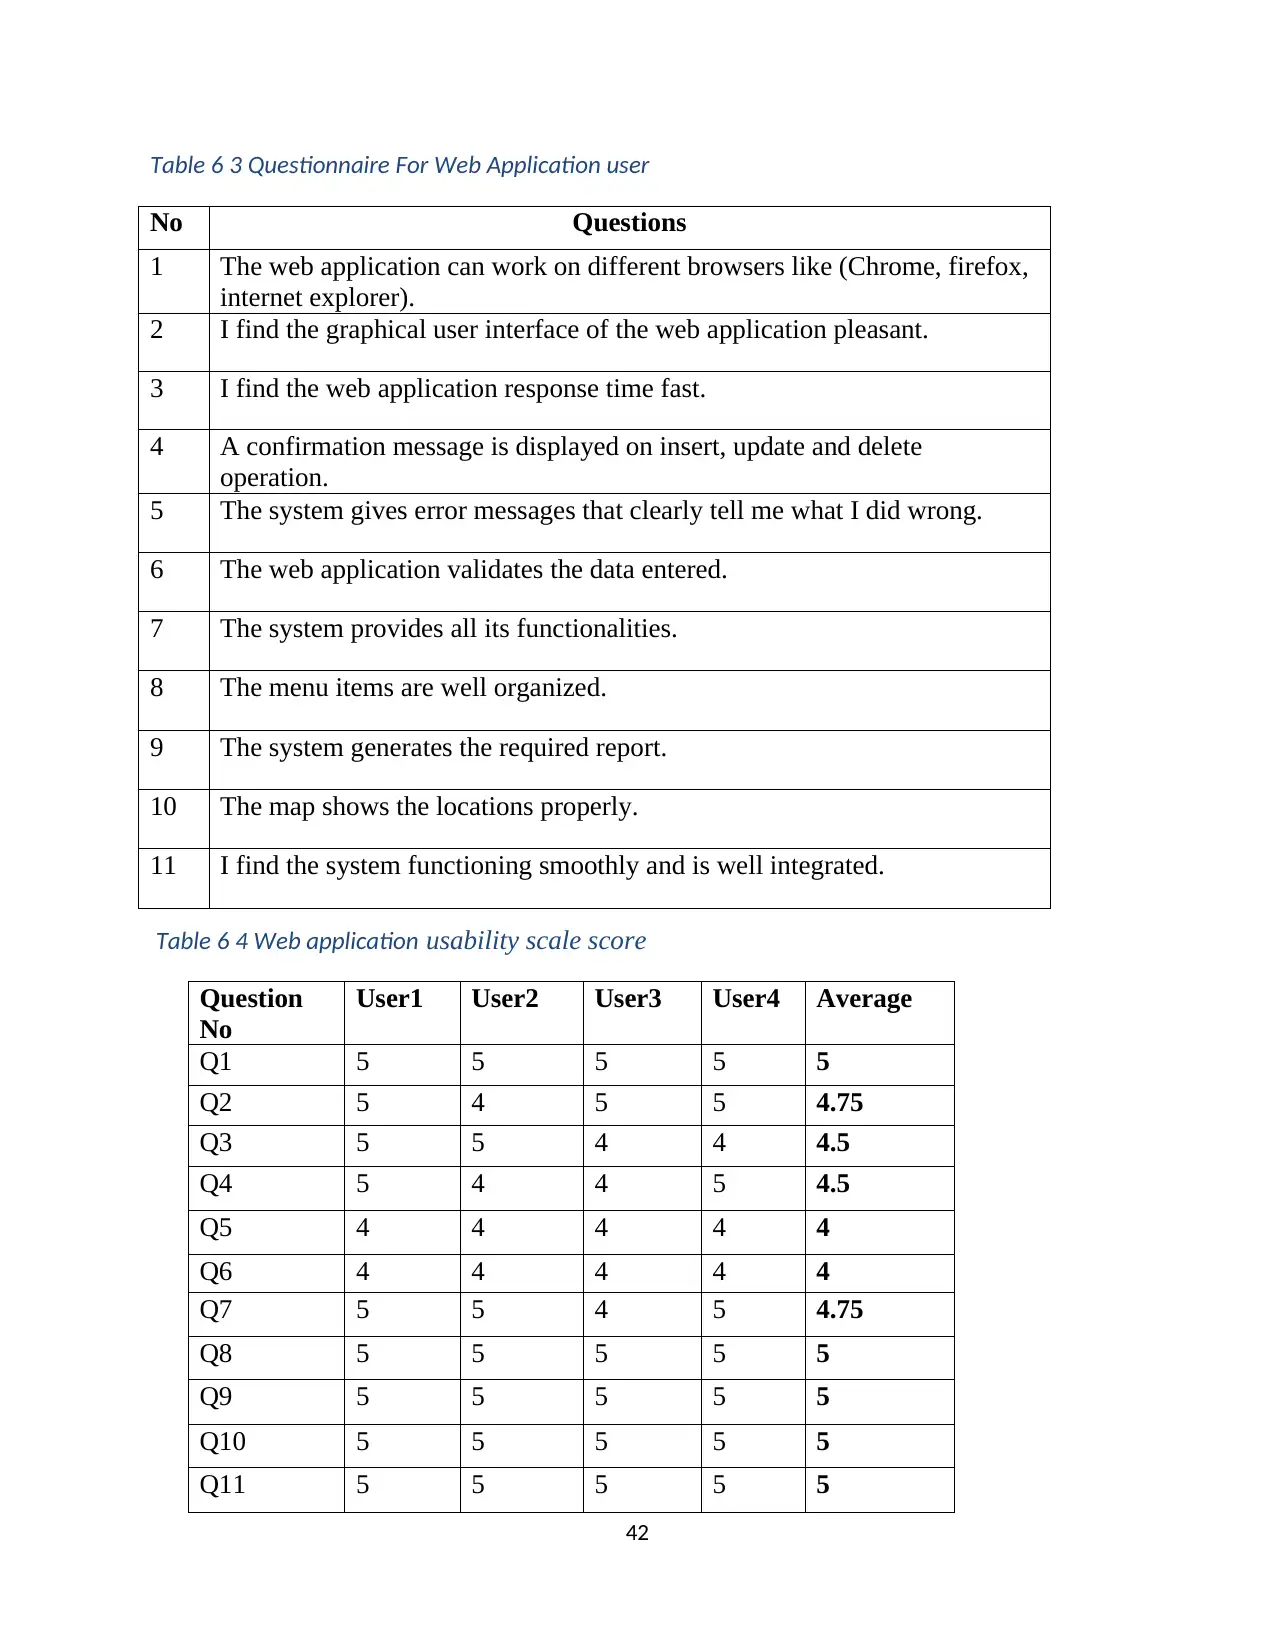
42
Table 6 3 Questionnaire For Web Application user
Table 6 4 Web application usability scale score
No Questions
1 The web application can work on different browsers like (Chrome, firefox,
internet explorer).
2 I find the graphical user interface of the web application pleasant.
3 I find the web application response time fast.
4 A confirmation message is displayed on insert, update and delete
operation.
5 The system gives error messages that clearly tell me what I did wrong.
6 The web application validates the data entered.
7 The system provides all its functionalities.
8 The menu items are well organized.
9 The system generates the required report.
10 The map shows the locations properly.
11 I find the system functioning smoothly and is well integrated.
Question
No
User1 User2 User3 User4 Average
Q1 5 5 5 5 5
Q2 5 4 5 5 4.75
Q3 5 5 4 4 4.5
Q4 5 4 4 5 4.5
Q5 4 4 4 4 4
Q6 4 4 4 4 4
Q7 5 5 4 5 4.75
Q8 5 5 5 5 5
Q9 5 5 5 5 5
Q10 5 5 5 5 5
Q11 5 5 5 5 5
43
We can see from the above two tables (Table 6.3 and 6.4) that the most important
functions of the web application are tested. And the web application usability score table
also shows that the average score of usability test is more than satisfactory.
We can see from the above two tables (Table 6.3 and 6.4) that the most important
functions of the web application are tested. And the web application usability score table
also shows that the average score of usability test is more than satisfactory.
Secure Best Marks with AI Grader
Need help grading? Try our AI Grader for instant feedback on your assignments.
44
Chapter Seven: Conclusion and Future Work
7.1 Conclusion
The people who use the smart phone are grow up in Ethiopia because the latest smart phone
functions are almost similar to computes. These smart phones make peoples life easier on their
day to day activity. Some of the feature of this smart phone are, built-in GPS (Global positioning
system) device which use to determine the current position, sensors, internet access and have the
ability to download and use different free applications.
In Addis Ababa city, passenger mentions different problems of public transport drivers’ bad
behavior while they are travel from one place to another. In addition to inappropriate behavior of
the drivers, the passenger may face to accidents because of the drivers’ fault.
In this project, the problem is identified, performed requirement analysis and we have developed
a system. The developed system reduces the problem and accident of public transport users by
providing the platform on the smart phone to help them to report bad behaviors of the public
transport drivers to traffic police while they travel from one place to another.
The prototype of this project has been tested on different android apparatus with different users
and the web application also tested by Addis Ababa police Commission IT experts. The result
shows that the project can reduce the problem of passengers as well as traffic accidents if the
user submit the data on actual problems.
According to Addis Ababa Police Commission expert opinion the system should include roads
and transport bureau because they have officers who controls public transport drivers like traffic
police. They also mention some of the drivers misbehaving actions are difficult to control, like
Over speed, the drivers can only be questioned when the speed can be captured on that moment,
or the evidence may be needed.
Except the mentioned behaviors, the project can solve the problem of the people who uses public
transport according to the expert’s opinions.
Users of public transport said that, they face different problems every day on public transport
drivers specially on minibus taxi. If such kind of system implemented, it can reduce our daily
problems as well as accidents.
45
7.2. Future Work
The proposed misbehave public transport drivers reporting system can be enhanced by including
the following feature for better benefits and efficiency.
✓ Integrate with penalty system
✓ Including cars other than public transport
✓ Extended in all regions
7.2. Future Work
The proposed misbehave public transport drivers reporting system can be enhanced by including
the following feature for better benefits and efficiency.
✓ Integrate with penalty system
✓ Including cars other than public transport
✓ Extended in all regions
46
References
[1] A.Persson, “Road traffic accidents in Ethiopia: Magnitude, causes and possible
Interventions”, ResearchGate, Jan, 2008.
[2] D. Haripriya, Puthanial. M, and Dr. P. C. Kishore Raja.” Accident Prevention System and
Security for Vehicles”, International Journal of Computer Trends and Technology (IJCTT) –
volume 12 number 5 – Jun 2014.
[3] Getu S. Tulu, Simon Washington and Mark J. King, “Characteristics of Police-reported Road
Traffic Crashes in Ethiopia over a Six Year Period”, Australasian Road Safety Research,
Policing & Education Conference, 2013.
[4] Masayoshi Tanishita and Bert vanWee. “Impact of vehicle speeds and changes in mean
speeds on per vehicle-kilometer traffic accident rates in Japan”, International Association of
Traffic and Safety Sciences, 2016.
[5] Emi j. “Best Android GPS Smartphone”, Retrieved from https://www.connectedwiki.com/
best-gps-smartphone/ on December 11, 2018
[6] WHO, “Ethiopia STEPS Survey 2015, Road Traffic Accident Fact Sheet”, Retrieved from
http://www.who.int/ncds/surveillance/steps/Ethiopia_2015_STEPS_Report.pdf on September
6, 2018.
[7] I. Richard, “Public Transport in Developing Countries”, London: Elsevier, 2005.
[8] World Bank, Scoping Study Urban Mobility in Three Cities, Washington DC: World Bank,
2002.
[9] Tesema, T. B., Abraham, A. & Grosan, C. “Rule mining and classification of road traffic
accidents using adaptive regression trees”.International Journal of Simulation 6, no. 10-11
(2005): 80-94.
[10] News: Amidst Increasing Fatal Accidents Addis Abeba Releases First Ever Status Report
On Road Safety. Retrieved from
http://addisstandard.com/news-amidst-increasing-fatal-accidents-addis-abeba-releases-first-
ever-status-report-on-road-safety/ on December 31,2017.
[11] Pavil Jose. “A Comparative study of the paper based error reporting system and an
electronic error reporting system”, Unpublished Masters Thesis, Department of
Computer Science, Vanderbilt University, 2005.
[12] Jerry Hildenbrand, “How does GPS work on my phone”, Retrieved from
Paraphrase This Document
Need a fresh take? Get an instant paraphrase of this document with our AI Paraphraser
47
https://www.androidcentral.com/how-does-gps-work-my-phone on December 19, 2018.
[13] How Internet Works on Mobile Devices. Retrieved from
https://www.engineersgarage.com/mygarage/how-internet-works-on-mobile-devices on
December 21, 2018.
[14] What is SMS. Retrieved from https://www.lenovo.com/us/en/faqs/pc-life-faqs/what-is-sms-
and-does-my-phone-or-tablet-need-it/ on December 21, 2018.
[15] ODK Collect, Retrieved from https://docs.opendatakit.org/collect-intro/ on December 19,
2018.
[16] What is OpenStreetMap? Retrieved from https://derickrethans.nl/what-isopenstreetmap.html
on December 21, 2018.
[17] Chalermpol Saiprasert and Wasan Pattara-Atikom. “Smartphone Enabled Dangerous
Driving Report System”, 46th Hawaii International Conference on System Sciences, 2013.
[18] Tilahun Meshesha. “Demands for Urban Public Transportation in Addis Ababa”,
Journal of Intelligent Transportation and Urban Planning, Jul. 2014.
[19] Derick A. Johnson and Mohan M. Trivedi. “Driving Style Recognition Using a Smartphone
as a Sensor Platform”, 14th International IEEE Conference on Intelligent Transportation
Systems Washington, DC, USA. October 5-7, 2011.
[20] Chalermpol Saiprasert, Thunyasit Pholprasit and Wasan Pattara-Atikom. “Detecting
Driving Events Using Smartphone”, 20th ITS World Congress Conference, October 2013.
[21] Mohamed Fazeen, Brandon Gozick, Ram Dantu, Moiz Bhukhiya, and Marta C. González.
“Safe Driving Using Mobile Phones”, IEEE Transactions on Intelligent Transportation
Systems, September 2012.
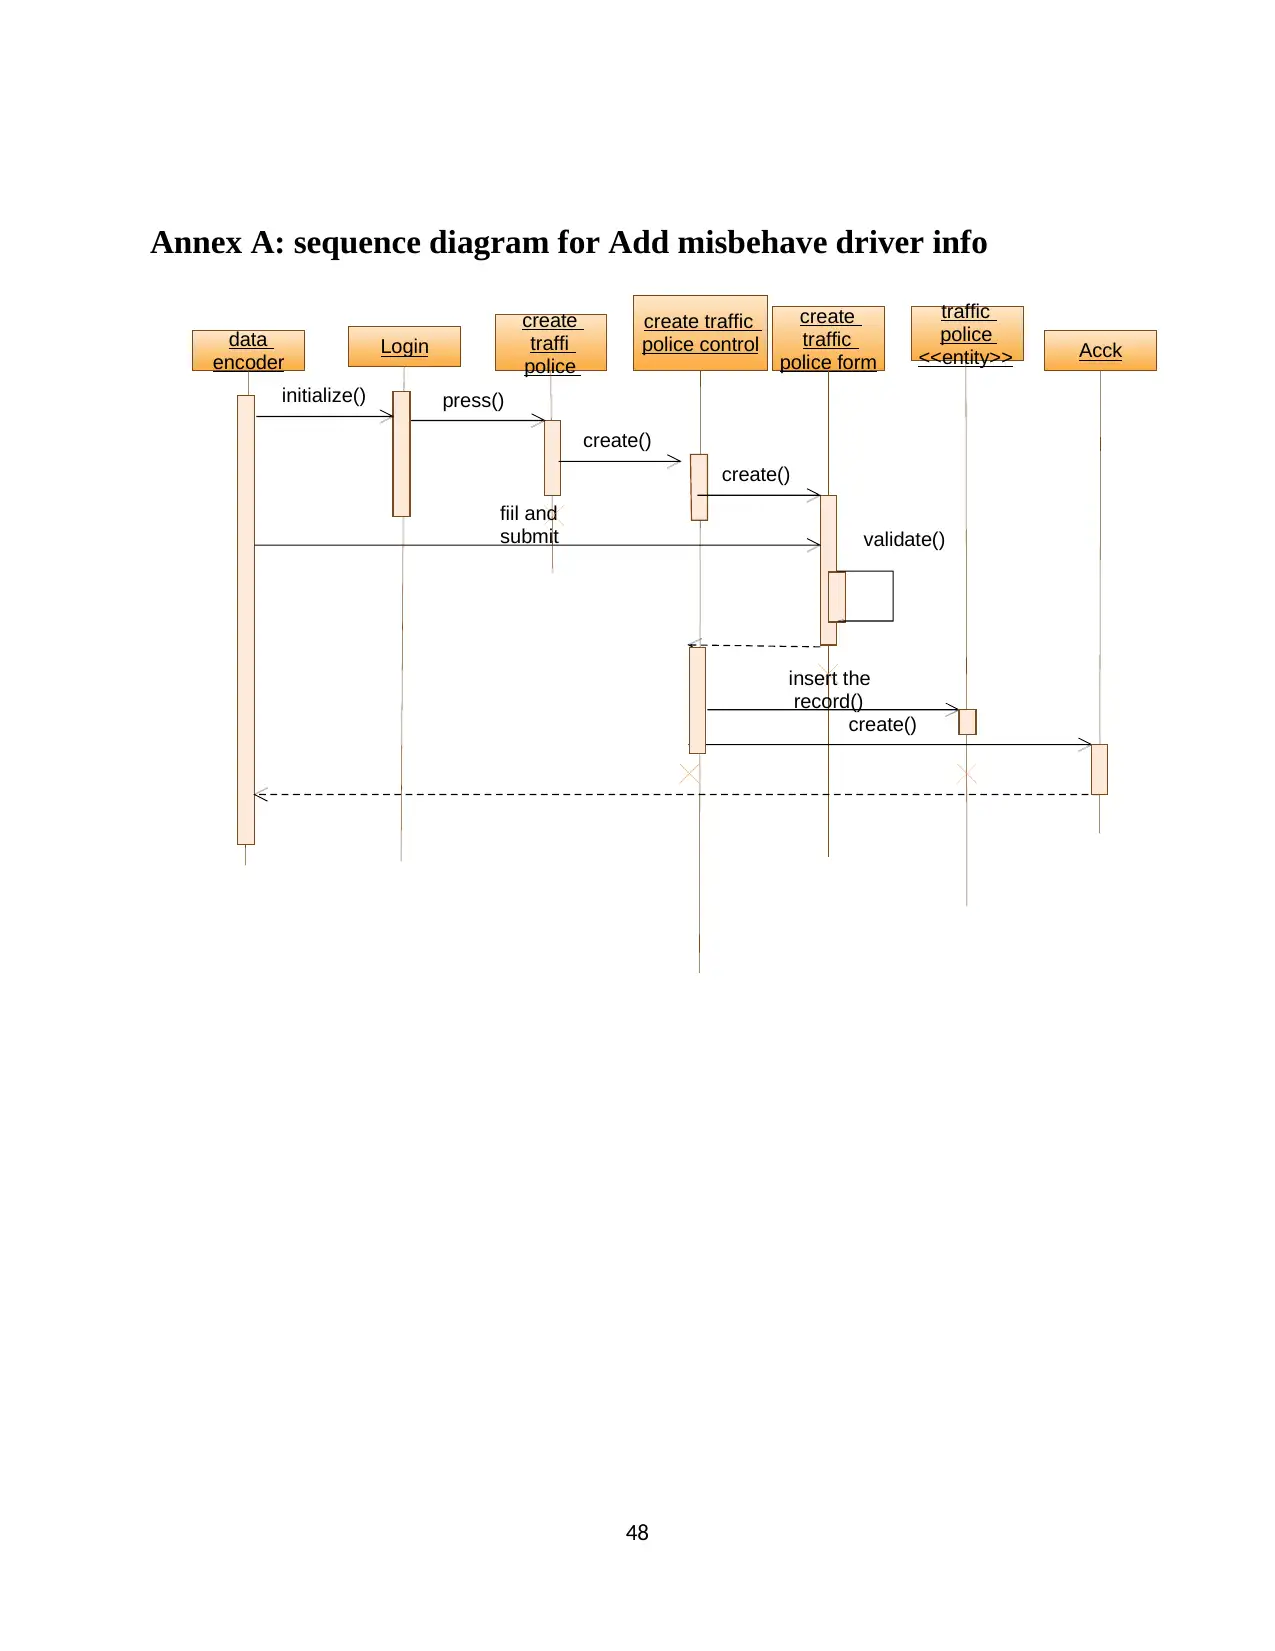
48
Annex A: sequence diagram for Add misbehave driver info
data
encoder
create
traffi
police
create traffic
police control
create
traffic
police form
traffic
police
<<entity>>
press()
create()
validate()
fiil and
submit
Acck
create()
insert the
record()
create()
Login
initialize()
Annex A: sequence diagram for Add misbehave driver info
data
encoder
create
traffi
police
create traffic
police control
create
traffic
police form
traffic
police
<<entity>>
press()
create()
validate()
fiil and
submit
Acck
create()
insert the
record()
create()
Login
initialize()
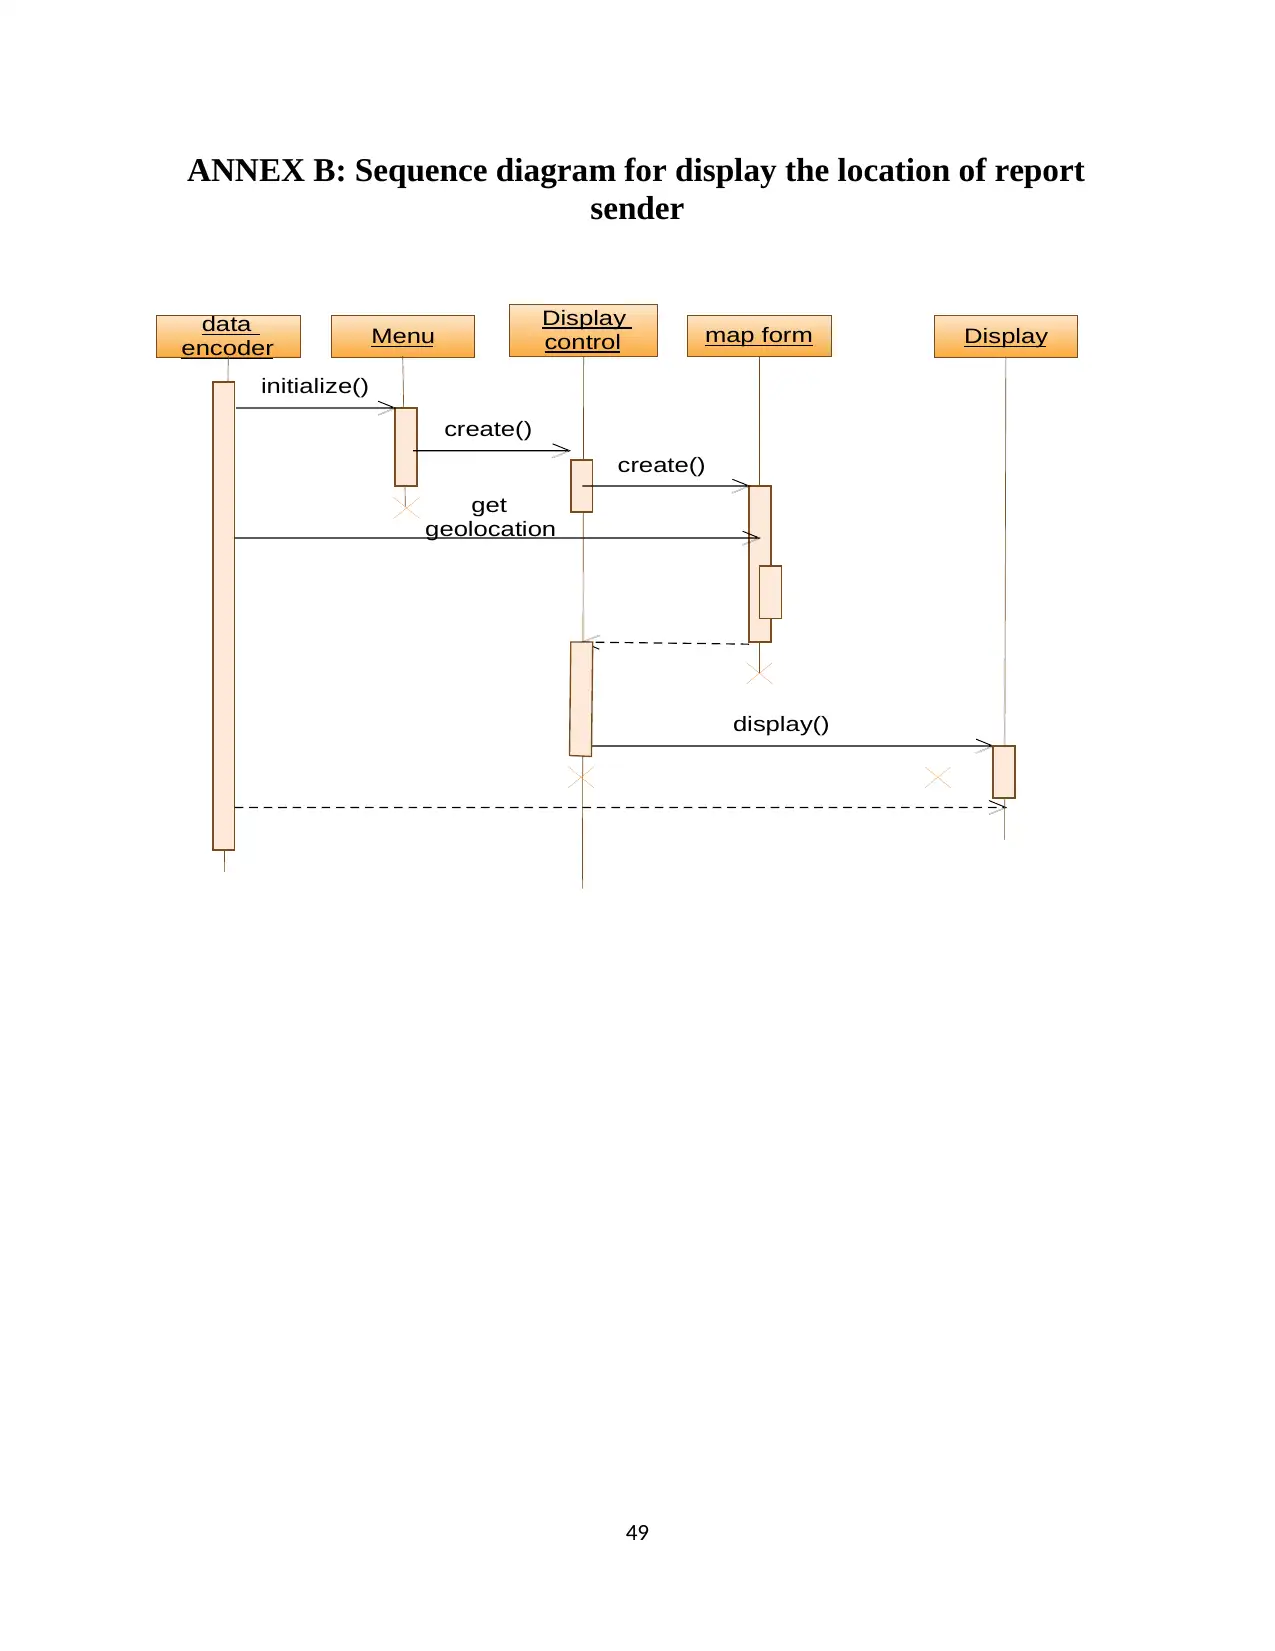
49
ANNEX B: Sequence diagram for display the location of report
sender
data
encoder Menu Display
control map form
initialize()
create()
get
geolocation
Display
create()
display()
ANNEX B: Sequence diagram for display the location of report
sender
data
encoder Menu Display
control map form
initialize()
create()
get
geolocation
Display
create()
display()
Secure Best Marks with AI Grader
Need help grading? Try our AI Grader for instant feedback on your assignments.
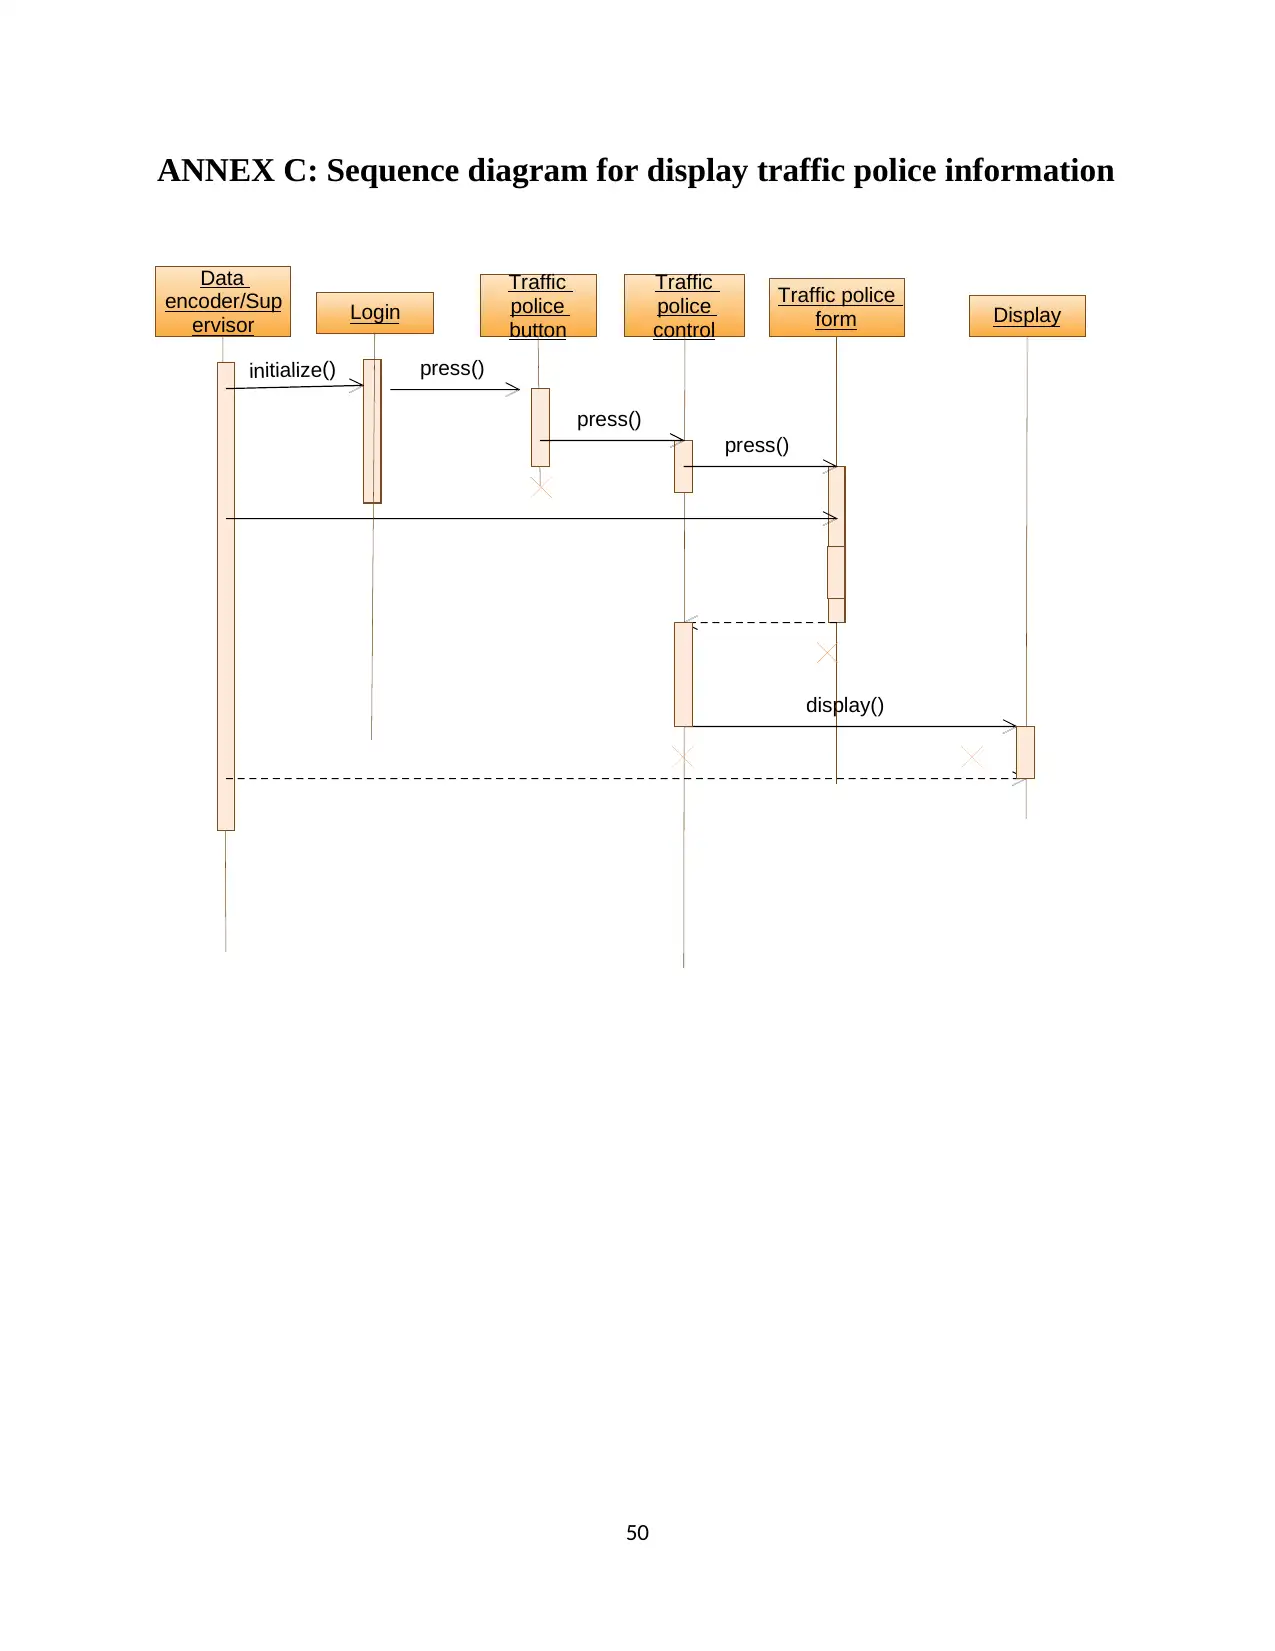
50
ANNEX C: Sequence diagram for display traffic police information
Data
encoder/Sup
ervisor
Traffic
police
button
Traffic
police
control
Traffic police
form
press()
press()
Display
press()
display()
Login
initialize()
ANNEX C: Sequence diagram for display traffic police information
Data
encoder/Sup
ervisor
Traffic
police
button
Traffic
police
control
Traffic police
form
press()
press()
Display
press()
display()
Login
initialize()
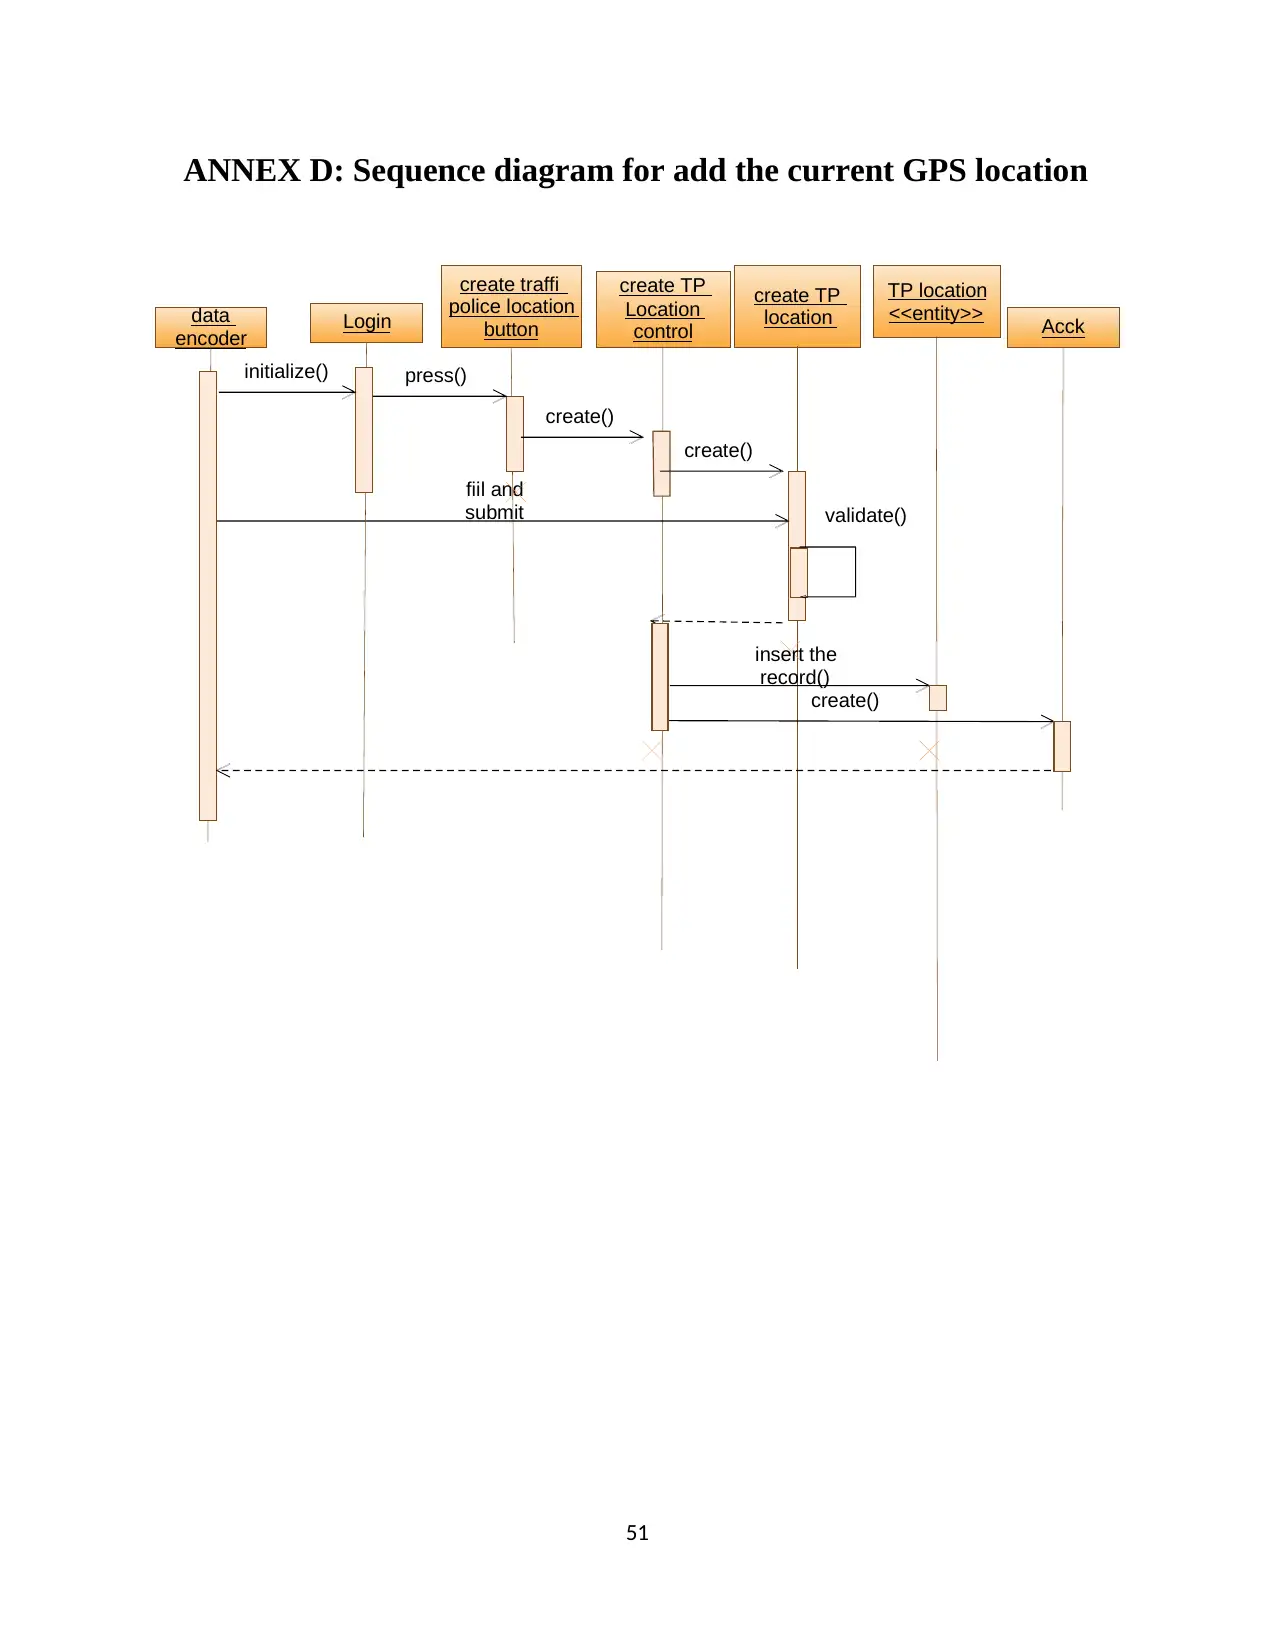
51
ANNEX D: Sequence diagram for add the current GPS location
data
encoder
create traffi
police location
button
create TP
Location
control
create TP
location
TP location
<<entity>>
press()
create()
validate()
fiil and
submit
Acck
create()
insert the
record()
create()
Login
initialize()
ANNEX D: Sequence diagram for add the current GPS location
data
encoder
create traffi
police location
button
create TP
Location
control
create TP
location
TP location
<<entity>>
press()
create()
validate()
fiil and
submit
Acck
create()
insert the
record()
create()
Login
initialize()
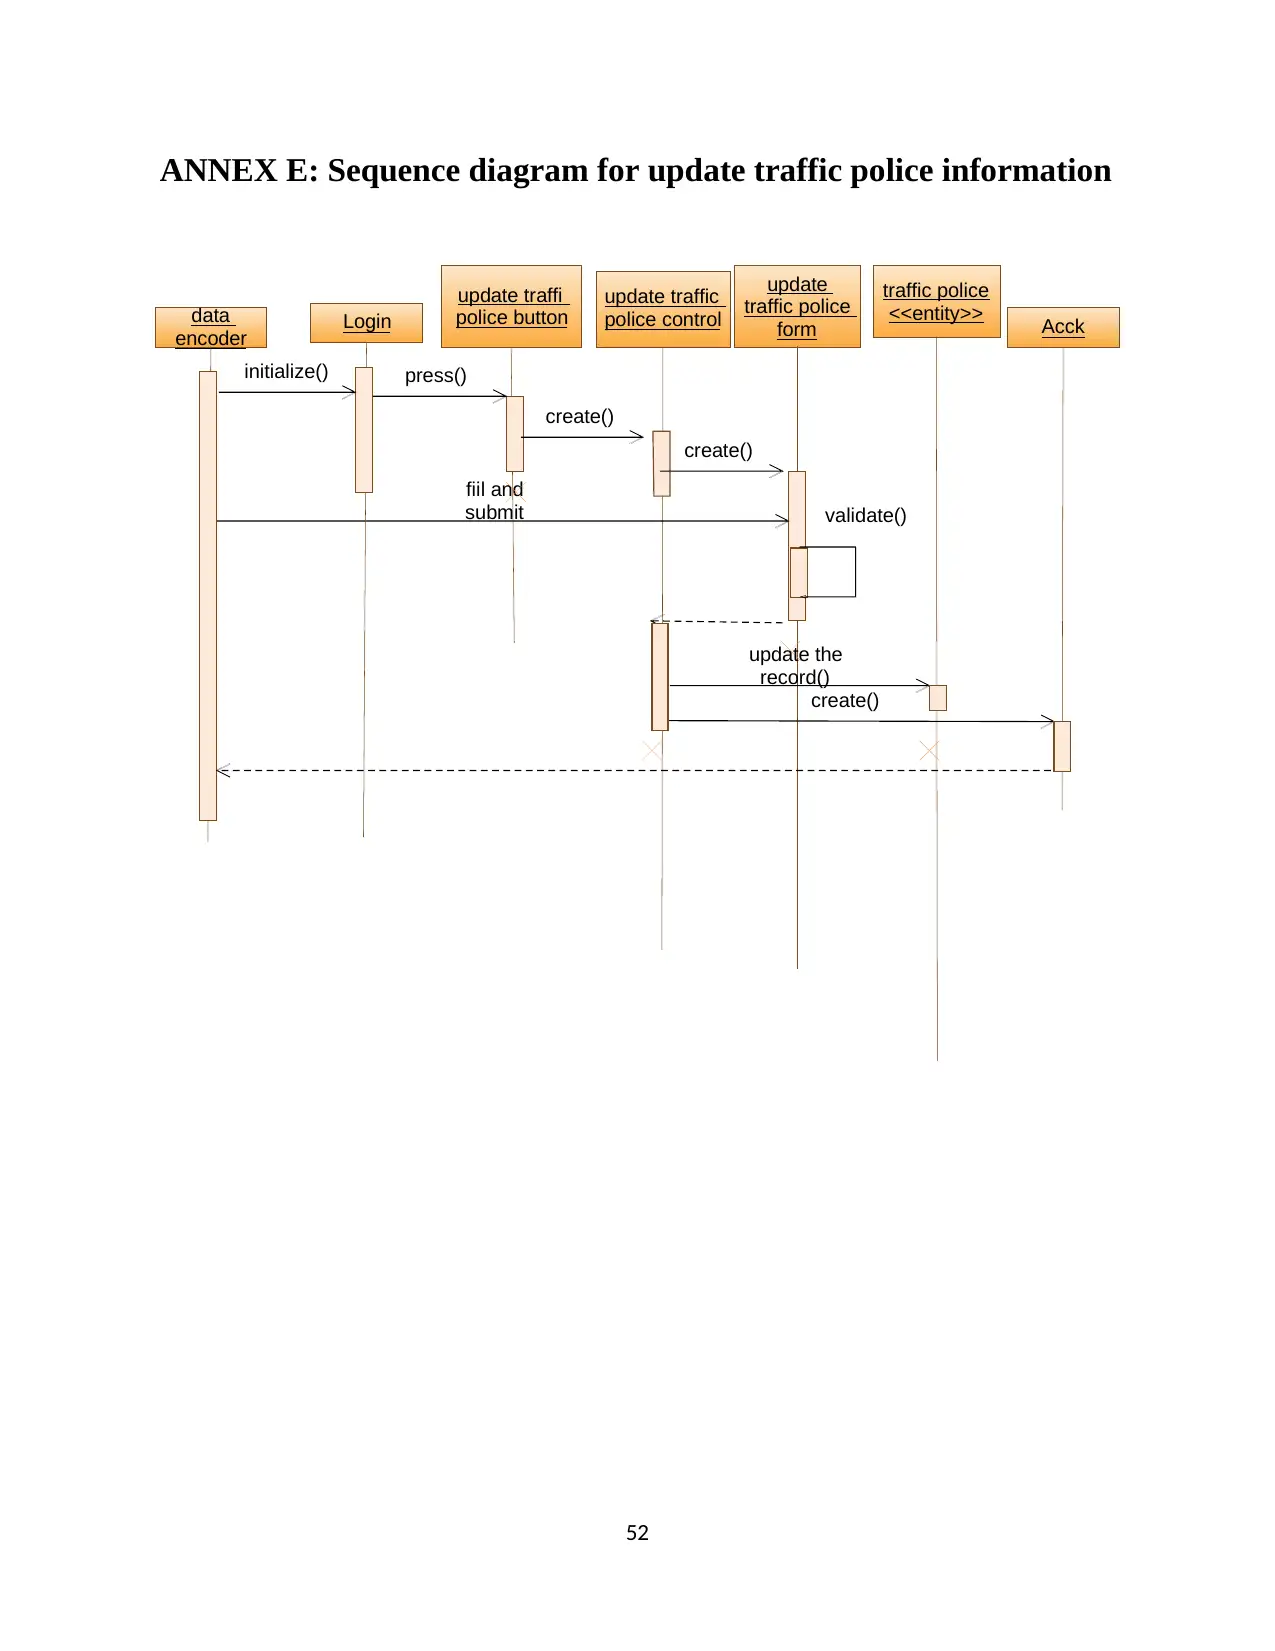
52
ANNEX E: Sequence diagram for update traffic police information
data
encoder
update traffi
police button
update traffic
police control
update
traffic police
form
traffic police
<<entity>>
press()
create()
validate()
fiil and
submit
Acck
create()
update the
record()
create()
Login
initialize()
ANNEX E: Sequence diagram for update traffic police information
data
encoder
update traffi
police button
update traffic
police control
update
traffic police
form
traffic police
<<entity>>
press()
create()
validate()
fiil and
submit
Acck
create()
update the
record()
create()
Login
initialize()
Paraphrase This Document
Need a fresh take? Get an instant paraphrase of this document with our AI Paraphraser
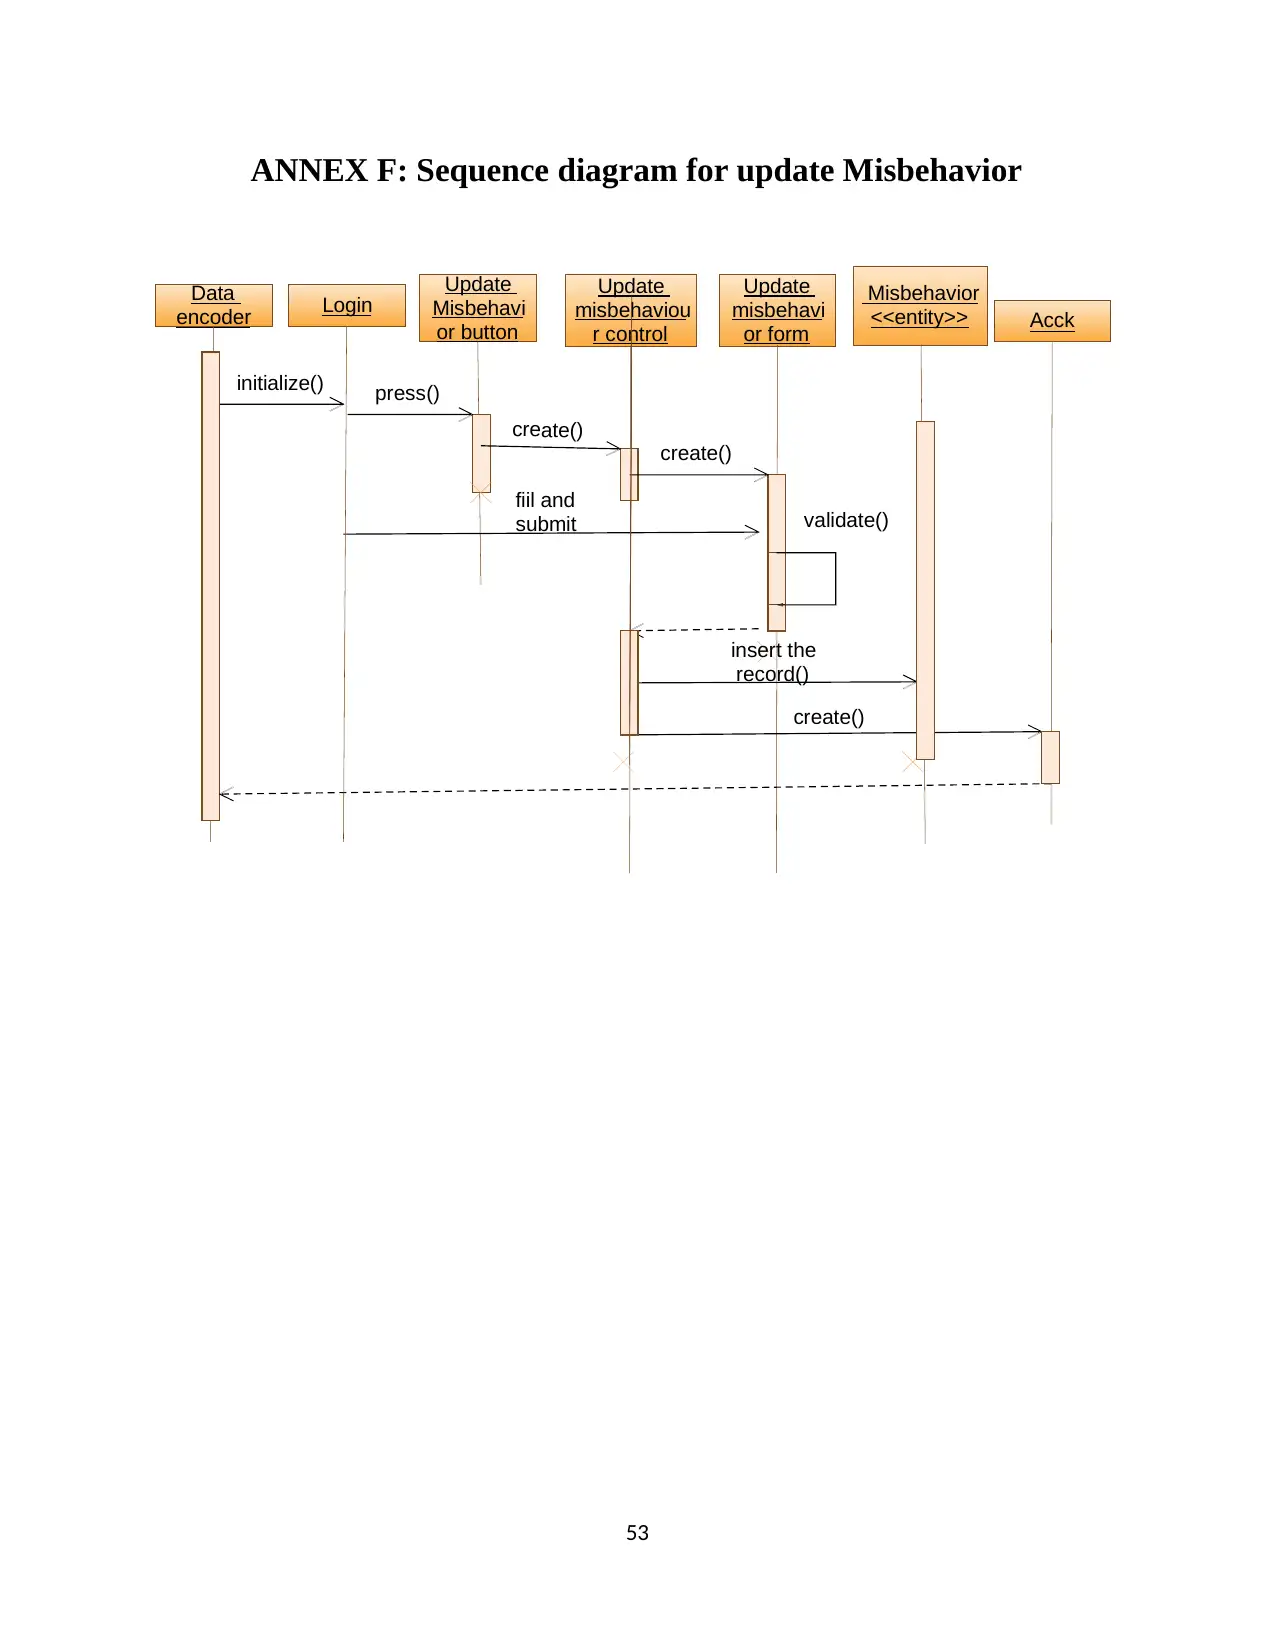
53
ANNEX F: Sequence diagram for update Misbehavior
Data
encoder
Update
Misbehavi
or button
Update
misbehaviou
r control
Update
misbehavi
or form
Misbehavior
<<entity>>
initialize()
create()
validate()
fiil and
submit
Acck
create()
insert the
record()
create()
Login
press()
ANNEX F: Sequence diagram for update Misbehavior
Data
encoder
Update
Misbehavi
or button
Update
misbehaviou
r control
Update
misbehavi
or form
Misbehavior
<<entity>>
initialize()
create()
validate()
fiil and
submit
Acck
create()
insert the
record()
create()
Login
press()
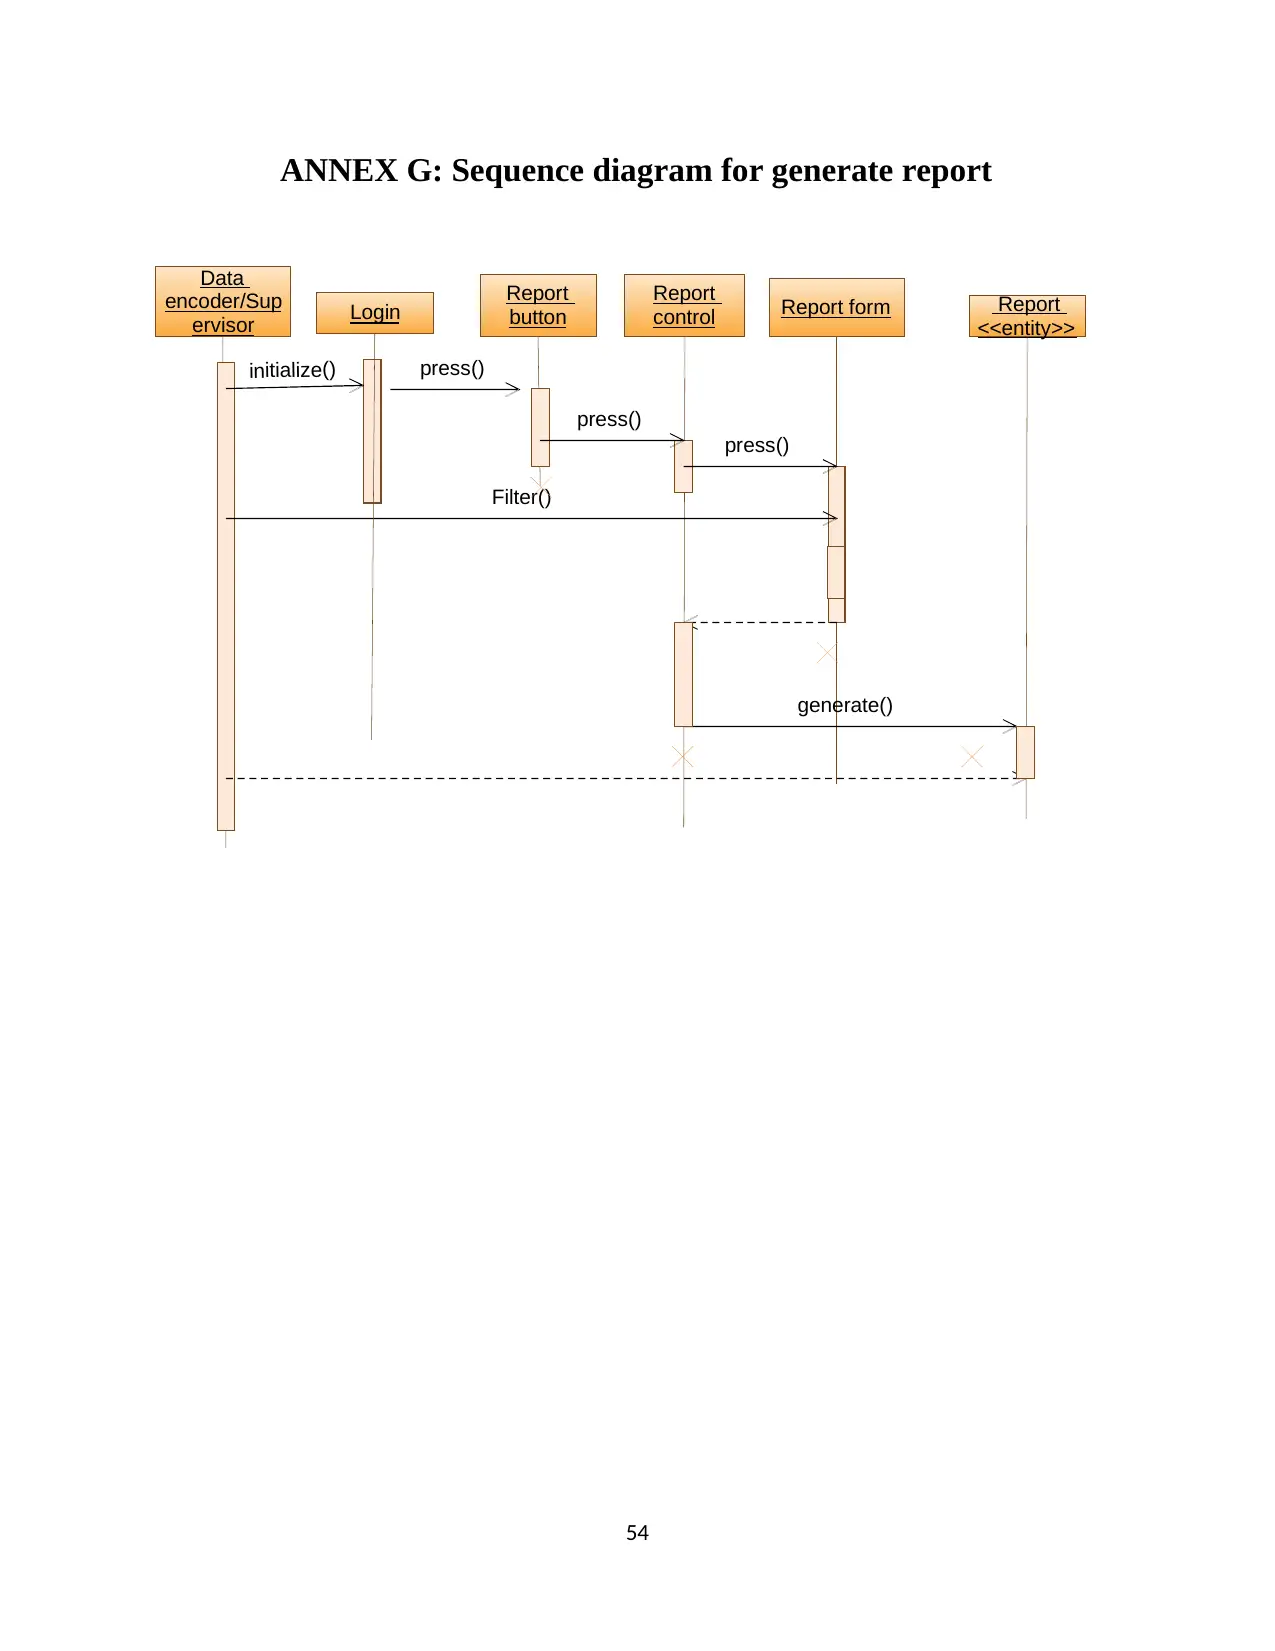
54
ANNEX G: Sequence diagram for generate report
Data
encoder/Sup
ervisor
Report
button
Report
control Report form
press()
press()
Filter()
Report
<<entity>>
press()
generate()
Login
initialize()
ANNEX G: Sequence diagram for generate report
Data
encoder/Sup
ervisor
Report
button
Report
control Report form
press()
press()
Filter()
Report
<<entity>>
press()
generate()
Login
initialize()
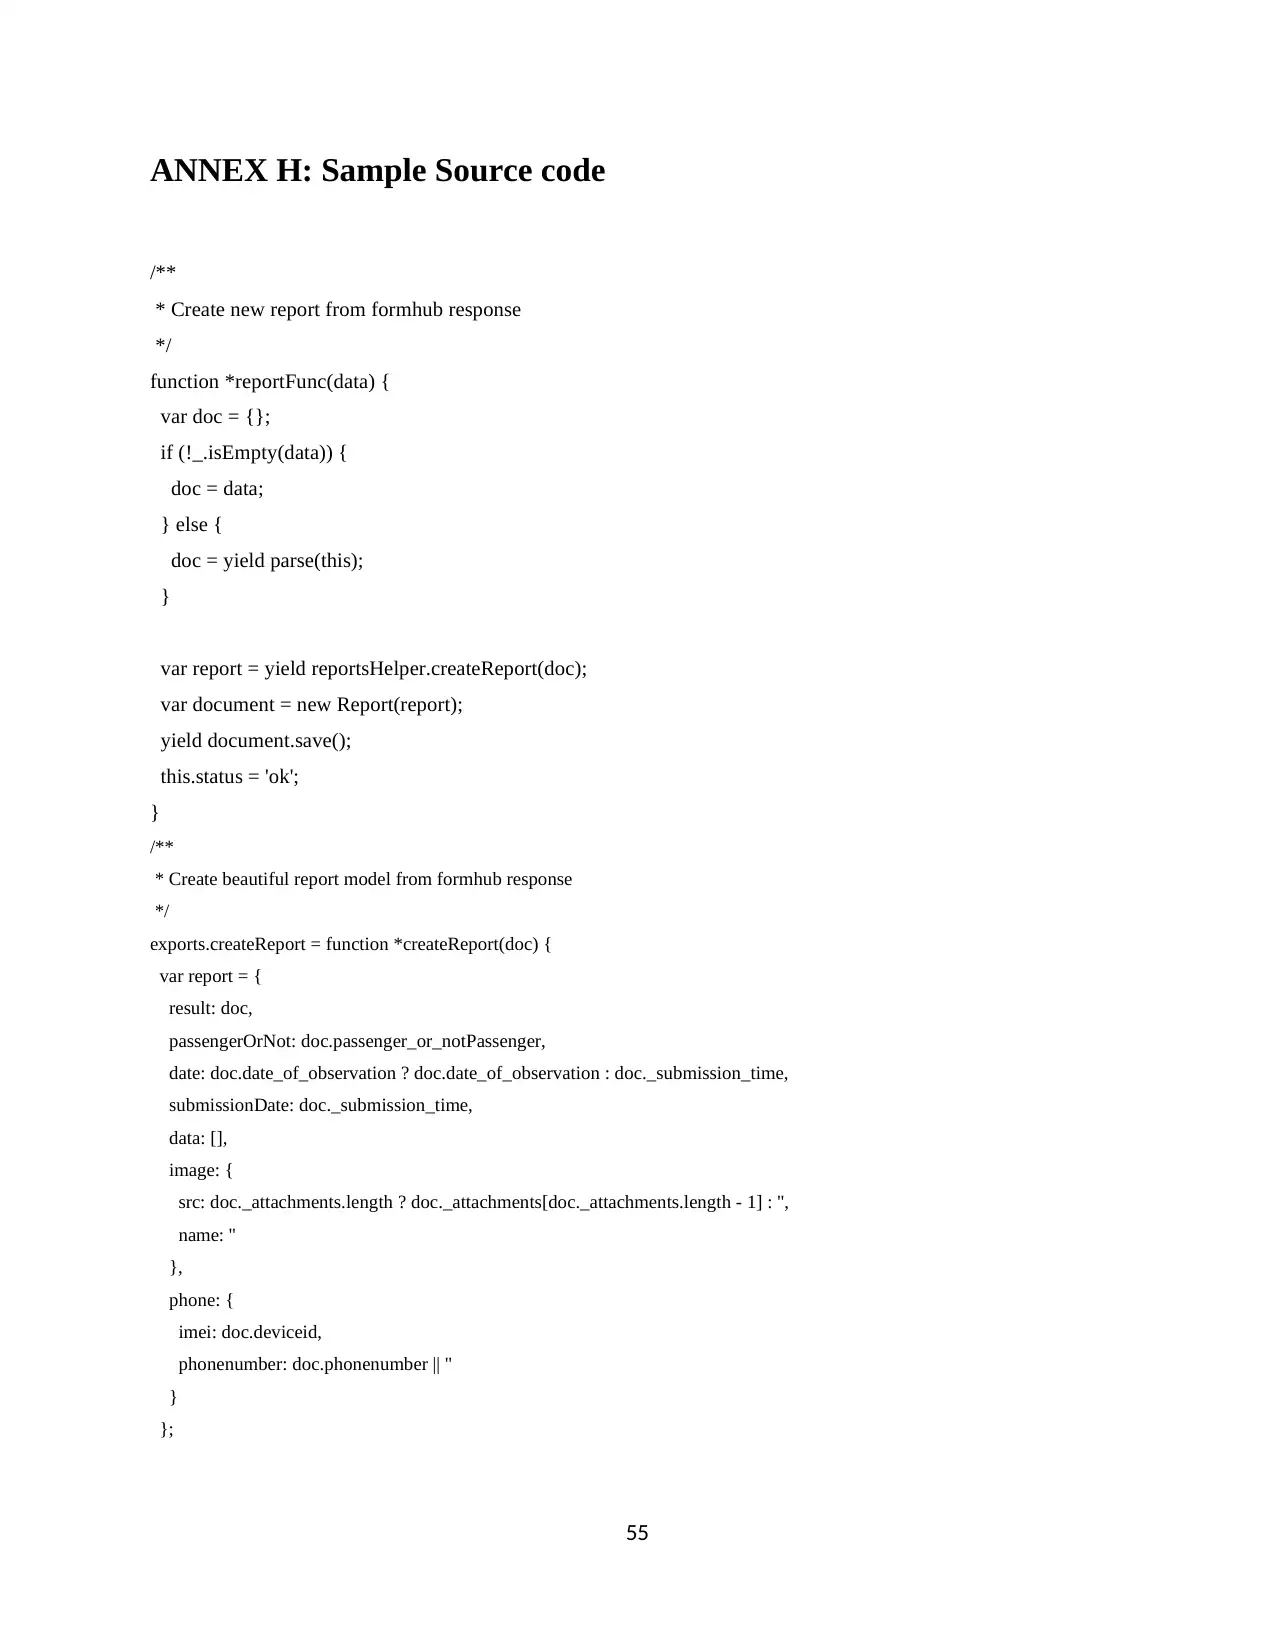
55
ANNEX H: Sample Source code
/**
* Create new report from formhub response
*/
function *reportFunc(data) {
var doc = {};
if (!_.isEmpty(data)) {
doc = data;
} else {
doc = yield parse(this);
}
var report = yield reportsHelper.createReport(doc);
var document = new Report(report);
yield document.save();
this.status = 'ok';
}
/**
* Create beautiful report model from formhub response
*/
exports.createReport = function *createReport(doc) {
var report = {
result: doc,
passengerOrNot: doc.passenger_or_notPassenger,
date: doc.date_of_observation ? doc.date_of_observation : doc._submission_time,
submissionDate: doc._submission_time,
data: [],
image: {
src: doc._attachments.length ? doc._attachments[doc._attachments.length - 1] : '',
name: ''
},
phone: {
imei: doc.deviceid,
phonenumber: doc.phonenumber || ''
}
};
Secure Best Marks with AI Grader
Need help grading? Try our AI Grader for instant feedback on your assignments.
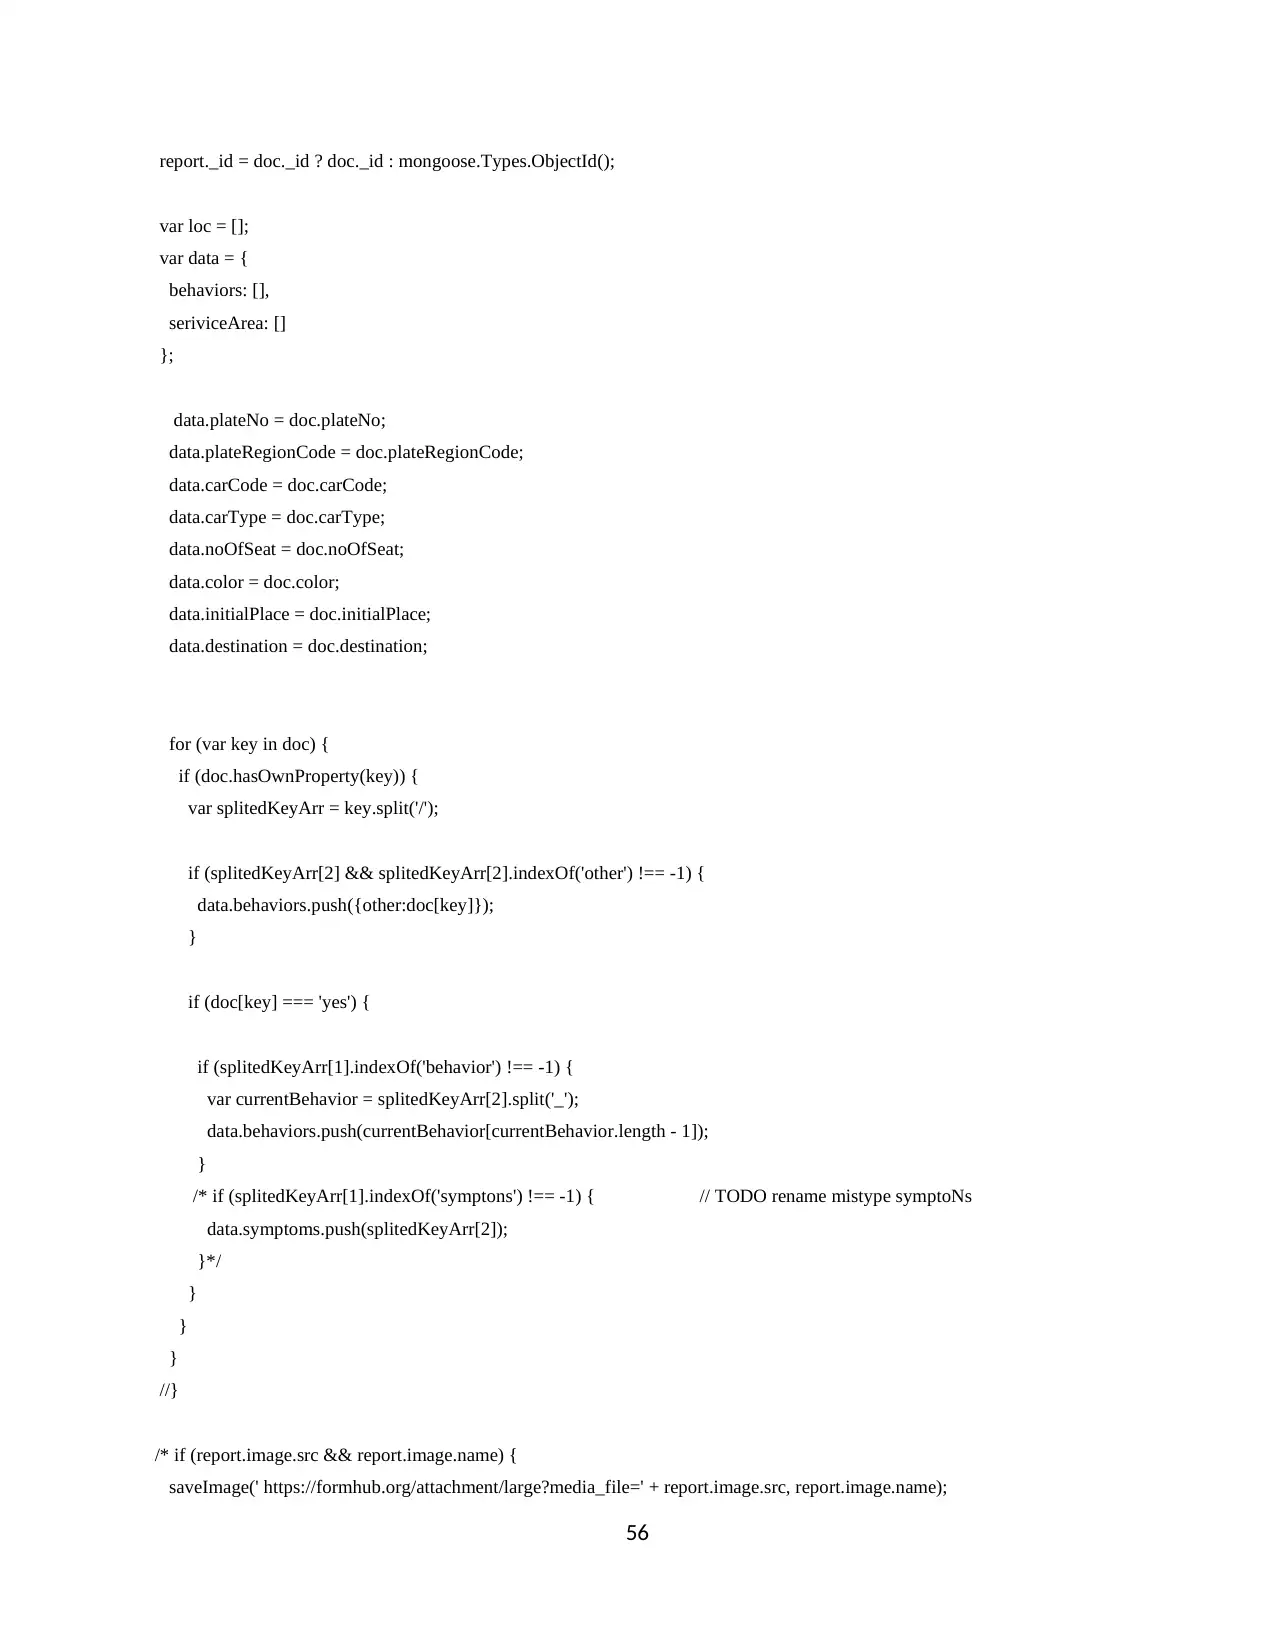
56
report._id = doc._id ? doc._id : mongoose.Types.ObjectId();
var loc = [];
var data = {
behaviors: [],
seriviceArea: []
};
data.plateNo = doc.plateNo;
data.plateRegionCode = doc.plateRegionCode;
data.carCode = doc.carCode;
data.carType = doc.carType;
data.noOfSeat = doc.noOfSeat;
data.color = doc.color;
data.initialPlace = doc.initialPlace;
data.destination = doc.destination;
for (var key in doc) {
if (doc.hasOwnProperty(key)) {
var splitedKeyArr = key.split('/');
if (splitedKeyArr[2] && splitedKeyArr[2].indexOf('other') !== -1) {
data.behaviors.push({other:doc[key]});
}
if (doc[key] === 'yes') {
if (splitedKeyArr[1].indexOf('behavior') !== -1) {
var currentBehavior = splitedKeyArr[2].split('_');
data.behaviors.push(currentBehavior[currentBehavior.length - 1]);
}
/* if (splitedKeyArr[1].indexOf('symptons') !== -1) { // TODO rename mistype symptoNs
data.symptoms.push(splitedKeyArr[2]);
}*/
}
}
}
//}
/* if (report.image.src && report.image.name) {
saveImage(' https://formhub.org/attachment/large?media_file=' + report.image.src, report.image.name);
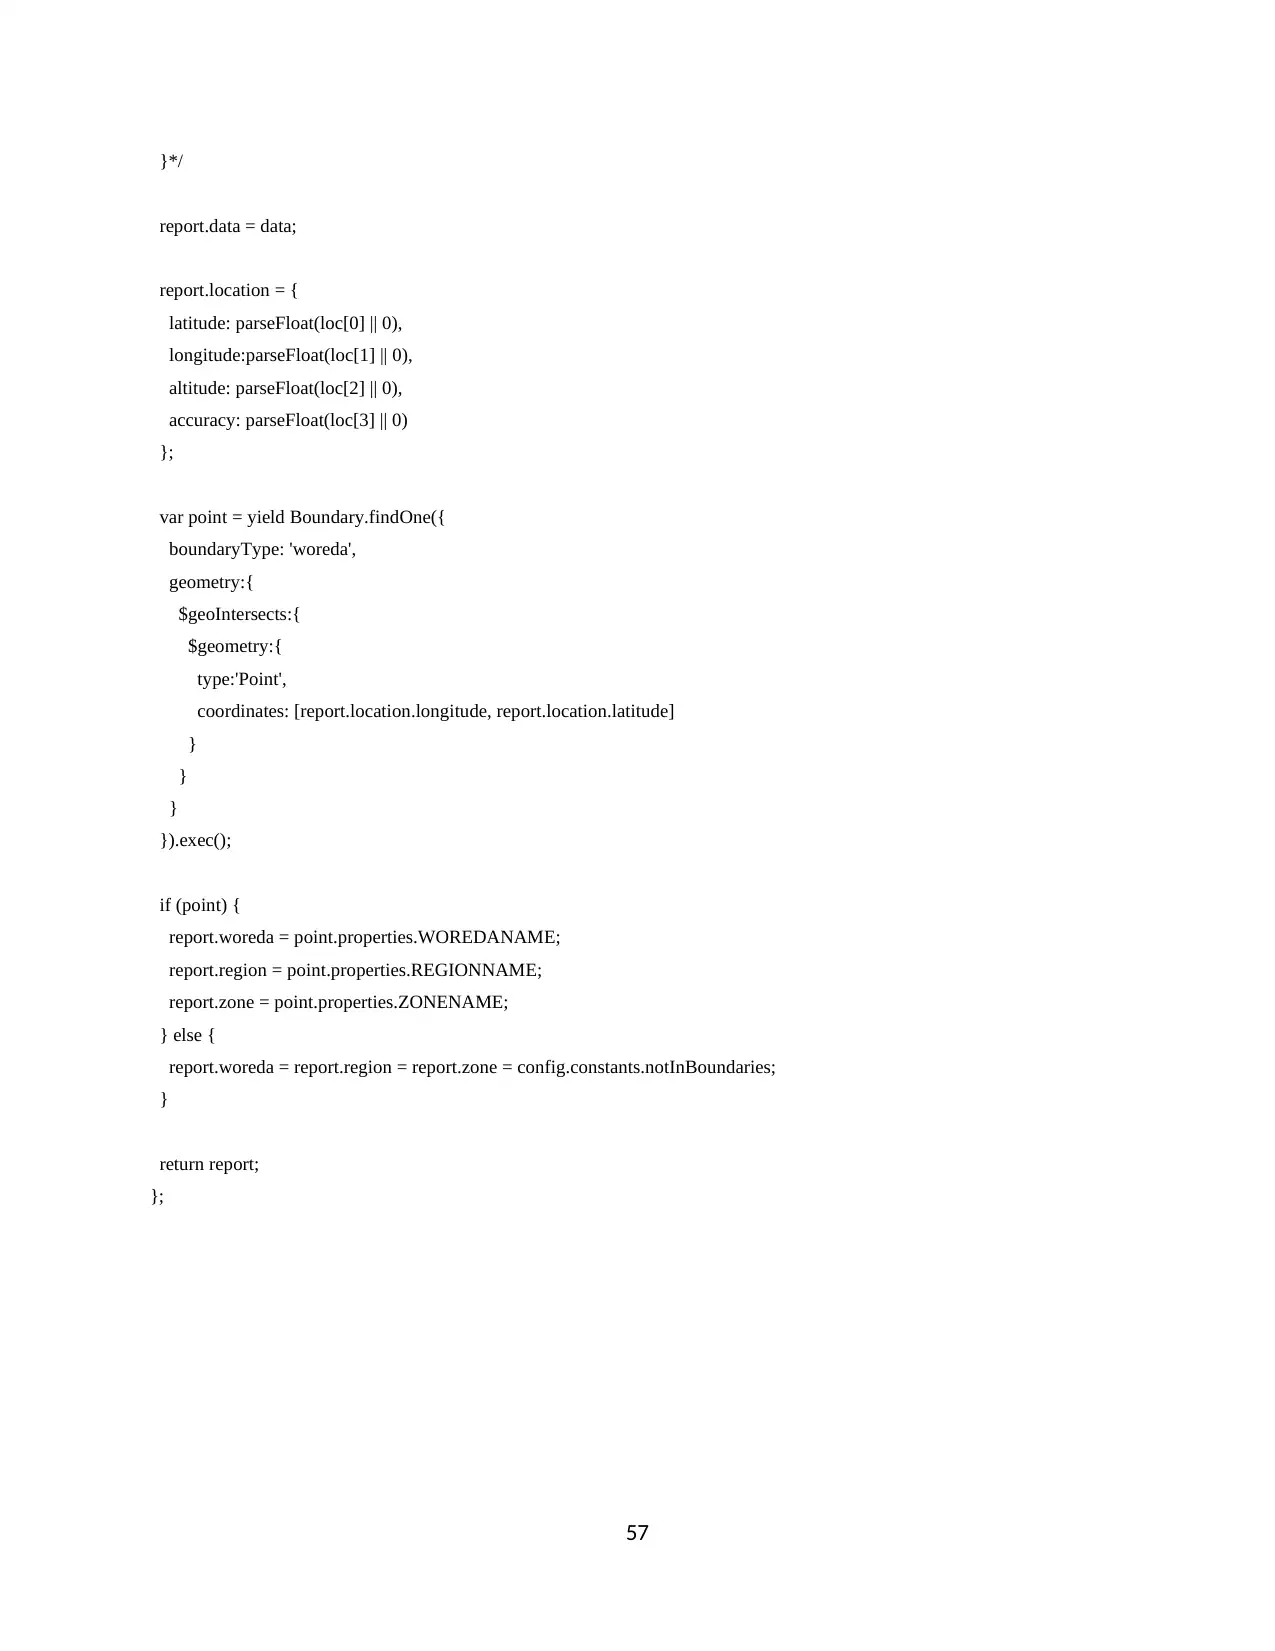
57
}*/
report.data = data;
report.location = {
latitude: parseFloat(loc[0] || 0),
longitude:parseFloat(loc[1] || 0),
altitude: parseFloat(loc[2] || 0),
accuracy: parseFloat(loc[3] || 0)
};
var point = yield Boundary.findOne({
boundaryType: 'woreda',
geometry:{
$geoIntersects:{
$geometry:{
type:'Point',
coordinates: [report.location.longitude, report.location.latitude]
}
}
}
}).exec();
if (point) {
report.woreda = point.properties.WOREDANAME;
report.region = point.properties.REGIONNAME;
report.zone = point.properties.ZONENAME;
} else {
report.woreda = report.region = report.zone = config.constants.notInBoundaries;
}
return report;
};
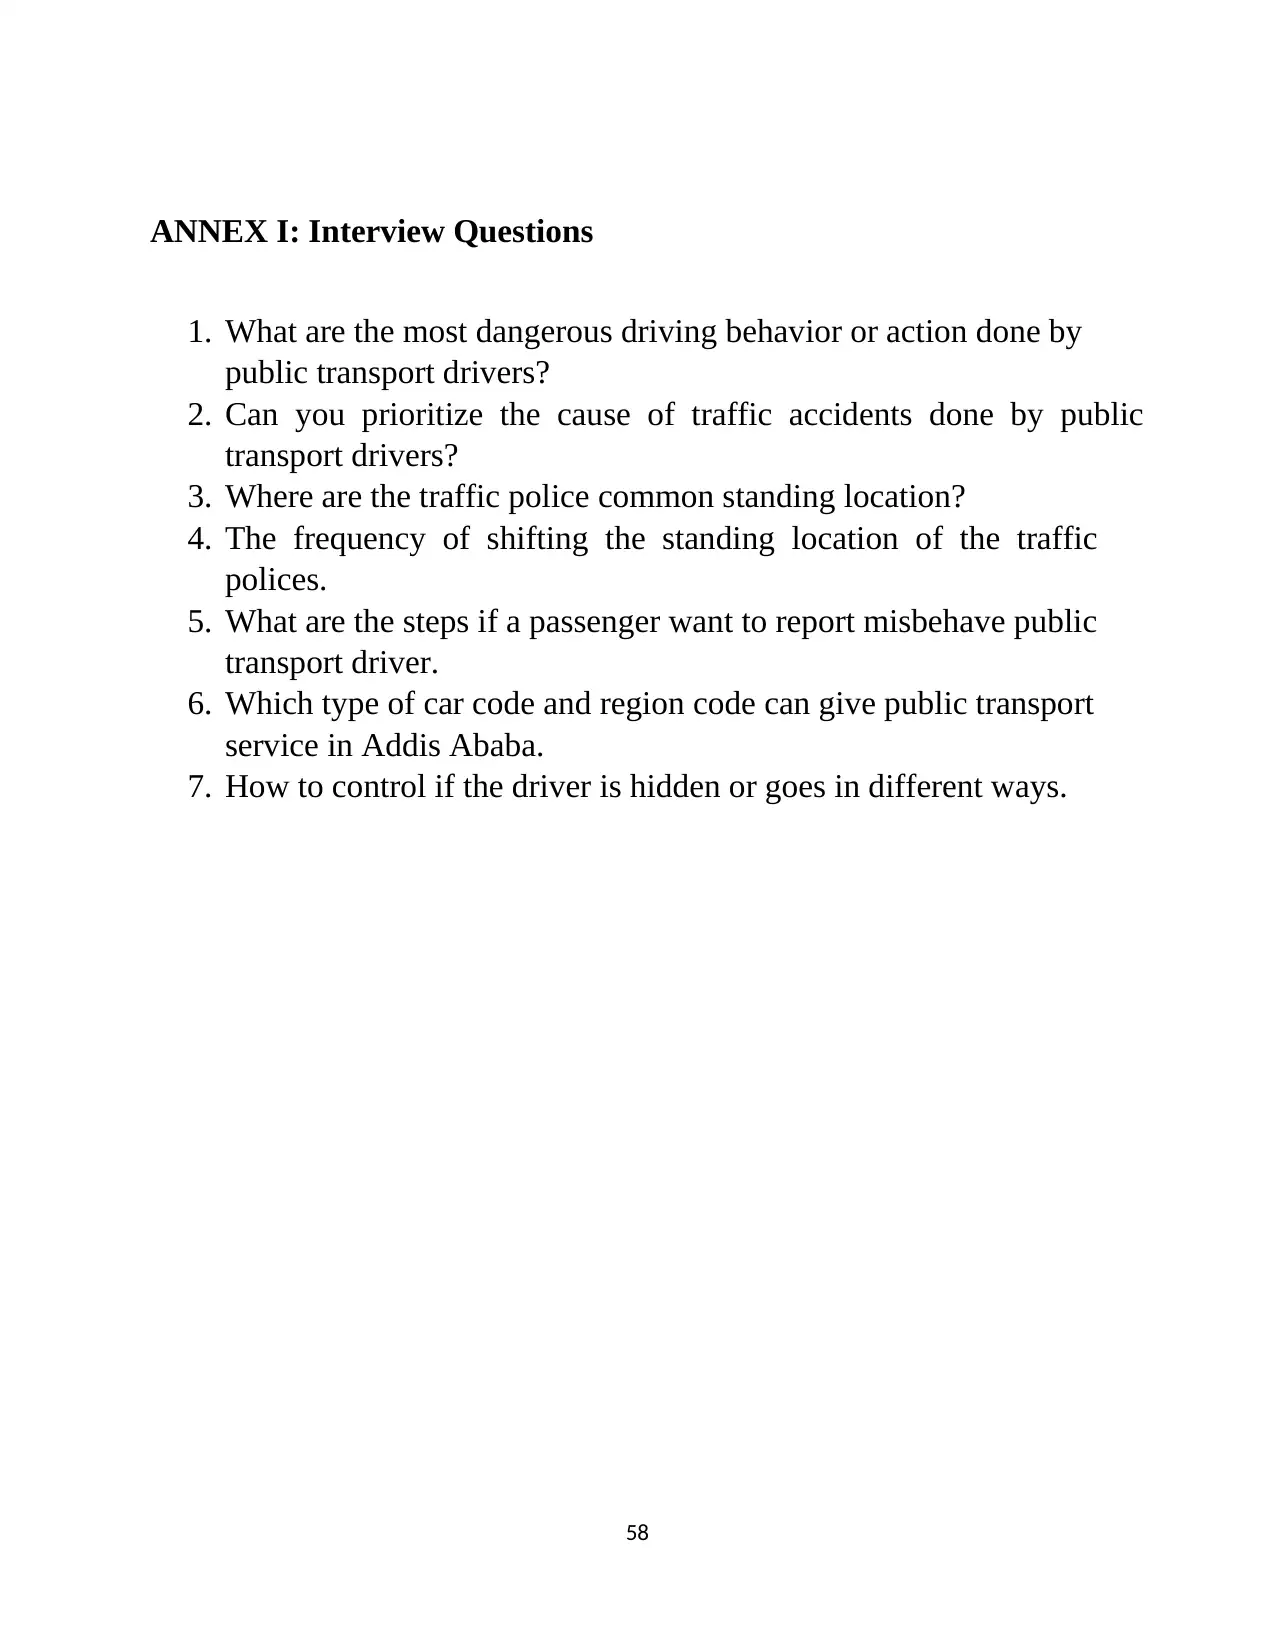
58
ANNEX I: Interview Questions
1. What are the most dangerous driving behavior or action done by
public transport drivers?
2. Can you prioritize the cause of traffic accidents done by public
transport drivers?
3. Where are the traffic police common standing location?
4. The frequency of shifting the standing location of the traffic
polices.
5. What are the steps if a passenger want to report misbehave public
transport driver.
6. Which type of car code and region code can give public transport
service in Addis Ababa.
7. How to control if the driver is hidden or goes in different ways.
1 out of 67
Your All-in-One AI-Powered Toolkit for Academic Success.
+13062052269
info@desklib.com
Available 24*7 on WhatsApp / Email
![[object Object]](/_next/static/media/star-bottom.7253800d.svg)
Unlock your academic potential
© 2024 | Zucol Services PVT LTD | All rights reserved.