Advance Corporate Finance Report on GWA Group: Dividend and Price
VerifiedAdded on 2021/05/31
|14
|2248
|126
Report
AI Summary
This report provides a comprehensive analysis of GWA Group Limited's financial performance, focusing on its characteristics as a mature firm. The report examines revenue growth, established margins, and debt capacity to identify GWA Group as a mature company. It then delves into dividend data, including dividend yield, payout ratio, frequency, and amount of dividends paid between 2013 and 2017. The report further investigates the impact of dividend announcements on stock prices, analyzing ex-dividend price movements and price fluctuations around dividend declarations. The analysis includes specific dividend data for 2016 and 2017, detailing the timing, amounts, and franking of dividends, and examines the influence of dividend announcements on the company's share price. The report uses financial data from GWA Group's annual reports and other financial sources to support its findings, offering insights into the company's dividend policies and their effects on its stock valuation.
Running head: ADVANCE CORPORATE FINANCE
Advance corporate finance
Name of the student
Name of the university
Student ID
Author note
Advance corporate finance
Name of the student
Name of the university
Student ID
Author note
Paraphrase This Document
Need a fresh take? Get an instant paraphrase of this document with our AI Paraphraser
1ADVANCE CORPORATE FINANCE
Table of Contents
Answer 1....................................................................................................................................2
Answer 2....................................................................................................................................3
Answer 3....................................................................................................................................4
Answer 4....................................................................................................................................6
Answer 5....................................................................................................................................8
Reference..................................................................................................................................11
2ADVANCE CORPORATE FINANCE
Answer 1
Criteria for identifying mature firm
Mature firm is the company that is well established in the related industry and sells
well-known product to the loyal customers followed by average growth. Mature firms are
already passed through the rapid growth stage and are expected to grow at the same rate with
the economy. Further, these types of firms have various well established competitors.
GWA Group Limited has been chosen as a mature firm on the basis of the following
criteria –
Revenue growth – it can be stated that there are wide level of divergence among the
revenue growth rate and earning of various companies. While earning growth for the
mature firms can be high owing to the improvement in efficiencies, the revenue
growth rate may not be altered. The revenue of GWA Group Limited for the last 43
years is AUD 426,218, AUD 439,666 and AUD 446,332 respectively for the year
2015, 2016 and 2017. Therefore, it can be identified that the company’s revenue is
increasing trend over the last 3 years and the growth rate is stable (Gwagroup.com.au
2018).
Established margin – another feature of mature companies is that they experience
stable margins with the only exception that the margin can vary with the function of
the overall economy. It can be observed that the net profit margin of the company that
is calculated through dividing the net profit by the sales revenue for last 2 years are
12.21% for the year 2016 and 12.02% for the year 2017 (Gwagroup.com.au 2018).
Therefore, the company has established margin for the last 2 years (Coad and
Guenther 2013).
⊘ This is a preview!⊘
Do you want full access?
Subscribe today to unlock all pages.
Trusted by 1+ million students worldwide
3ADVANCE CORPORATE FINANCE
Debt capacity – as the firms get matured, the earnings as well as the revenues improve
and the reinvestment are required to be dropped off as more amount of cash is
available for paying off the debt (Freitas, Marques and Silva 2013).. Therefore, the
company always has a scope to raise more amounts through debt financing. It can be
identified from the last three year’s annual report of the company that the debt equity
ratio of the company that is calculated through dividing the debt by shareholders
equity is 0.41, 0.39 and 0.35 respectively for the years 2015, 2016 and 2017
(Gwagroup.com.au 2018). Therefore, the debt of the company is lower than the equity
and thus the company always had a scope to raise more fund through borrowing.
As per the above analysis GWA Group Limited is fulfilling all the above mentioned
criteria are fulfilled by the company. Therefore, the company is identified as the mature
company.
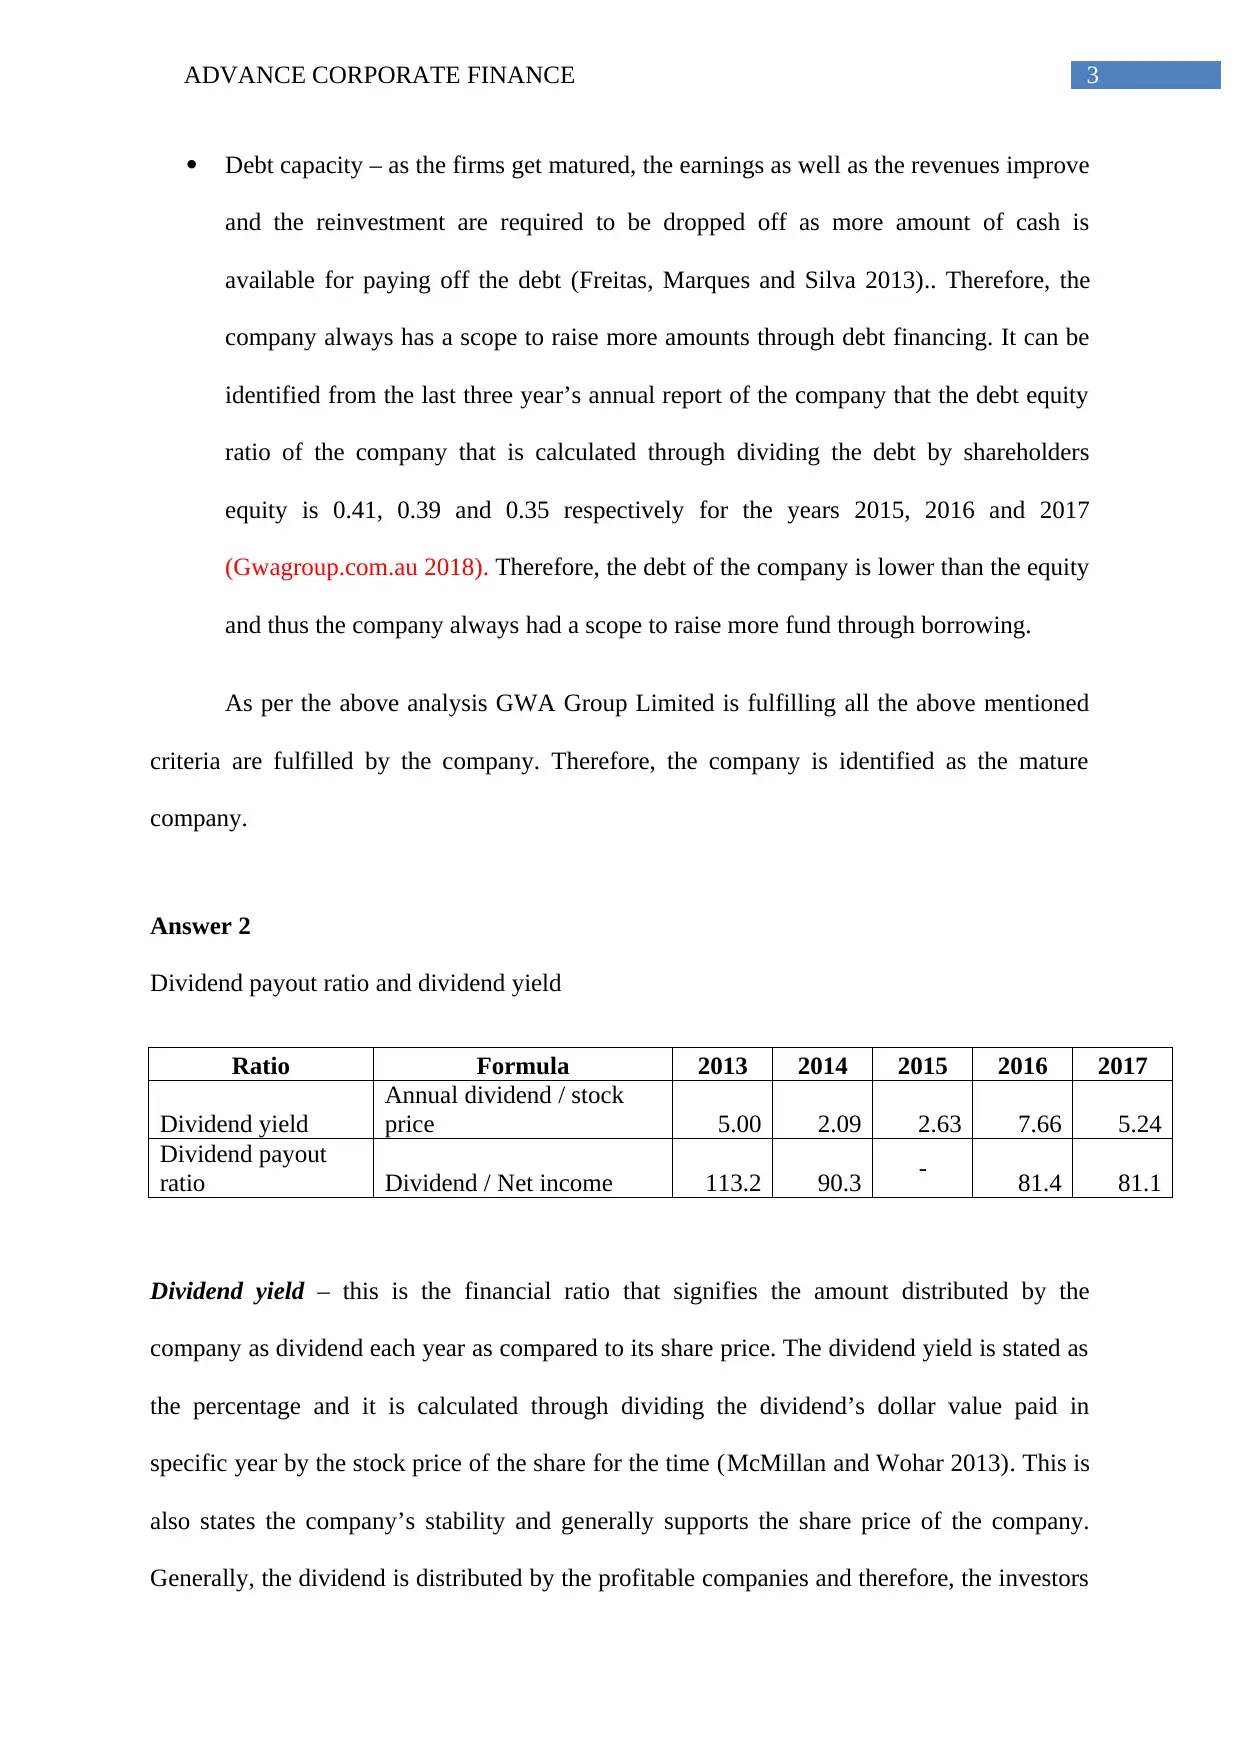
Answer 2
Dividend payout ratio and dividend yield
Ratio Formula 2013 2014 2015 2016 2017
Dividend yield
Annual dividend / stock
price 5.00 2.09 2.63 7.66 5.24
Dividend payout
ratio Dividend / Net income 113.2 90.3 - 81.4 81.1
Dividend yield – this is the financial ratio that signifies the amount distributed by the
company as dividend each year as compared to its share price. The dividend yield is stated as
the percentage and it is calculated through dividing the dividend’s dollar value paid in
specific year by the stock price of the share for the time (McMillan and Wohar 2013). This is
also states the company’s stability and generally supports the share price of the company.
Generally, the dividend is distributed by the profitable companies and therefore, the investors
Debt capacity – as the firms get matured, the earnings as well as the revenues improve
and the reinvestment are required to be dropped off as more amount of cash is
available for paying off the debt (Freitas, Marques and Silva 2013).. Therefore, the
company always has a scope to raise more amounts through debt financing. It can be
identified from the last three year’s annual report of the company that the debt equity
ratio of the company that is calculated through dividing the debt by shareholders
equity is 0.41, 0.39 and 0.35 respectively for the years 2015, 2016 and 2017
(Gwagroup.com.au 2018). Therefore, the debt of the company is lower than the equity
and thus the company always had a scope to raise more fund through borrowing.
As per the above analysis GWA Group Limited is fulfilling all the above mentioned
criteria are fulfilled by the company. Therefore, the company is identified as the mature
company.
Answer 2
Dividend payout ratio and dividend yield
Ratio Formula 2013 2014 2015 2016 2017
Dividend yield
Annual dividend / stock
price 5.00 2.09 2.63 7.66 5.24
Dividend payout
ratio Dividend / Net income 113.2 90.3 - 81.4 81.1
Dividend yield – this is the financial ratio that signifies the amount distributed by the
company as dividend each year as compared to its share price. The dividend yield is stated as
the percentage and it is calculated through dividing the dividend’s dollar value paid in
specific year by the stock price of the share for the time (McMillan and Wohar 2013). This is
also states the company’s stability and generally supports the share price of the company.
Generally, the dividend is distributed by the profitable companies and therefore, the investors
Paraphrase This Document
Need a fresh take? Get an instant paraphrase of this document with our AI Paraphraser
4ADVANCE CORPORATE FINANCE
often prefer those companies that are regular in paying the dividends. It is identified that the
dividend yield of the company for the last 5 years are fluctuating and had no specific trend
(Chortareas and Noikokyris 2014.). the dividend paid by the company for the last 5 years are
12.0 cents, 5.5 cents, 6.0 cents, 16.0 cents and 16.5 cents per share for the years 2013 to 2017
respectively. The share price for the last 5 years was 2.40, 2.63, 2.28, 2.09 and 3.15 for the
year ended 2013 to 2017 respectively (Gwagroup.com.au 2018).. The main reason of
difference was the difference in the dividend payment by the company. The dividend
payment policy that is maintained by the company is paying 65-85 percent of the net profit
after tax as the ordinary dividend (Arslan, Zaman and Phil 2014). Therefore, owing to the
changes in the net profit the dividend yield of the company also changed.
Dividend payout ratio – it is the amount of dividend that is paid to the shareholders as
compared to net income of the company. The amount that is not distributed as dividend and
retained by the company for the purpose of growth is known as the retained earnings
(Kenyoru, Kundu and Kibiwott 2013). It is calculated through dividing the dividend amount
by the net income. Dividend payout ratio of the company for the last 5 years is 113.2%,
90.3% for the year 2013 and 2014 and 81.4% and 81.1% for 2016 and 2017
(Gwagroup.com.au 2018). As the net income of the company for the year 2015 was in
negative, there is no dividend payout for 2015 (Nwozo and Fadugba 2014). For other years
there are changes in the payout ratio as there are changes in the net income of the company.
Answer 3
Dividend data for the year ended 2016 and 2017
(a) Frequency of dividend
5ADVANCE CORPORATE FINANCE
Generally the company pays dividend in March and September after releasing the half
year annual report of the company. Dividend declared and paid during the period from 1st
July 2015 to 30th June 2017 are as follows –
Final ordinary dividends for the year ended 30th June was paid at 8.0 cents per share.
Special dividend for the year ended 30th June 2016 was paid at 1.0 cents per share.
Interim dividend for the year ended 30th June 2016 paid at 7.0 cents per share
Interim dividend for the year ended 30th June 2017 paid at 7.5 cents per share
(Gwagroup.com.au 2018).
(b) Amount of dividend
Ordinary dividend for 2015/16 - Total amount of dividend paid were $ 21,116,000
and the date of payment was 16th September 2016(Gwagroup.com.au 2018).
Special dividend for 2015/16 - Total amount of dividend paid were $ 26,39,000 and
the date of payment was 16th September 2016 (Gwagroup.com.au 2018).
Interim dividend for 2016/17 - Total amount of dividend paid were $ 18,718,000 and
the date of payment was 5th April 2016 (Gwagroup.com.au 2018).
Interim dividend for 2016/17 - Total amount of dividend paid were $ 19,796,000 and
the date of payment was 7th March 2017 (Gwagroup.com.au 2018).
(c) Date of registration
To become eligible for receiving dividend, the shares must be purchased prior or
during the trading period of cum-dividend and shall hold the shares on ex-dividend date.
⊘ This is a preview!⊘
Do you want full access?
Subscribe today to unlock all pages.
Trusted by 1+ million students worldwide
6ADVANCE CORPORATE FINANCE
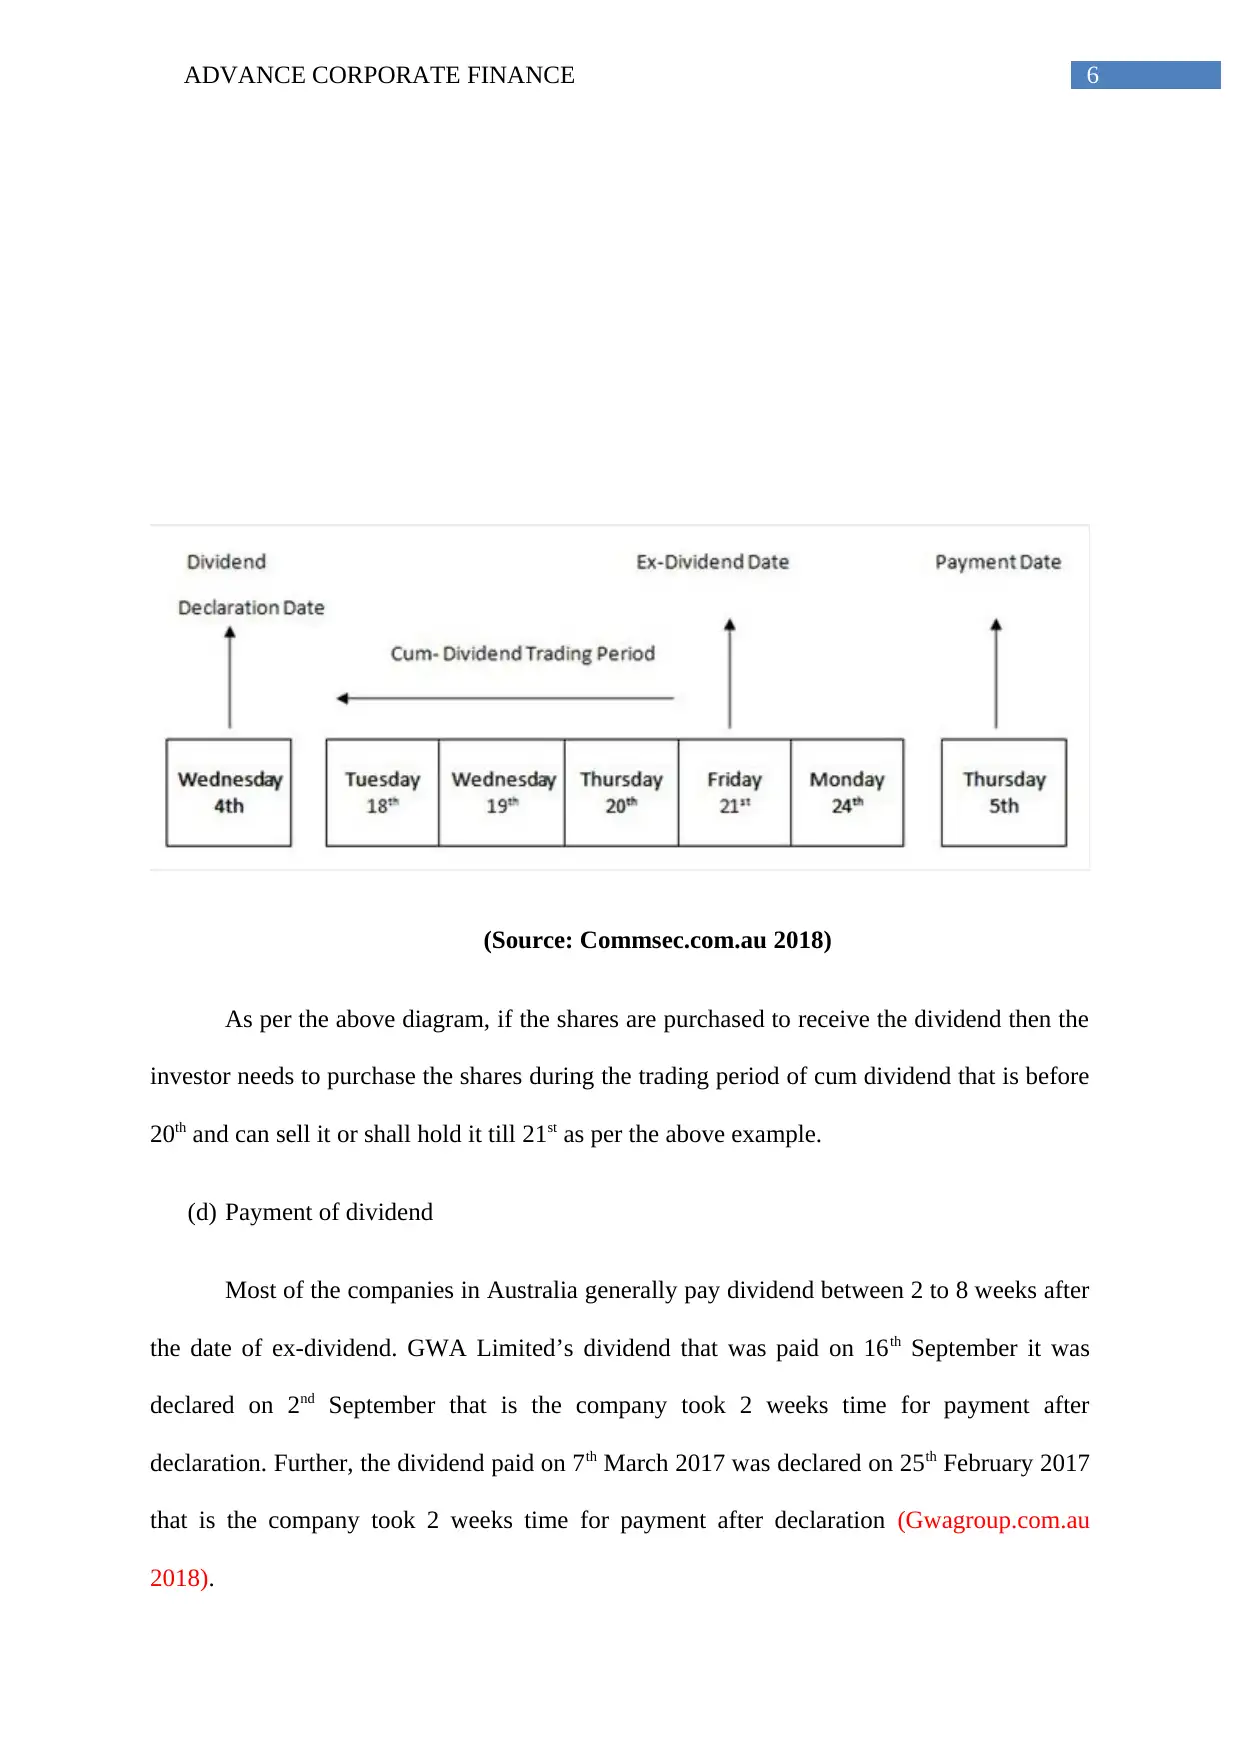
(Source: Commsec.com.au 2018)
As per the above diagram, if the shares are purchased to receive the dividend then the
investor needs to purchase the shares during the trading period of cum dividend that is before
20th and can sell it or shall hold it till 21st as per the above example.
(d) Payment of dividend
Most of the companies in Australia generally pay dividend between 2 to 8 weeks after
the date of ex-dividend. GWA Limited’s dividend that was paid on 16th September it was
declared on 2nd September that is the company took 2 weeks time for payment after
declaration. Further, the dividend paid on 7th March 2017 was declared on 25th February 2017
that is the company took 2 weeks time for payment after declaration (Gwagroup.com.au
2018).
Paraphrase This Document
Need a fresh take? Get an instant paraphrase of this document with our AI Paraphraser
7ADVANCE CORPORATE FINANCE
(e) Franked dividend
For both the years dividends were 100% franked (Gwagroup.com.au 2018).
Answer 4
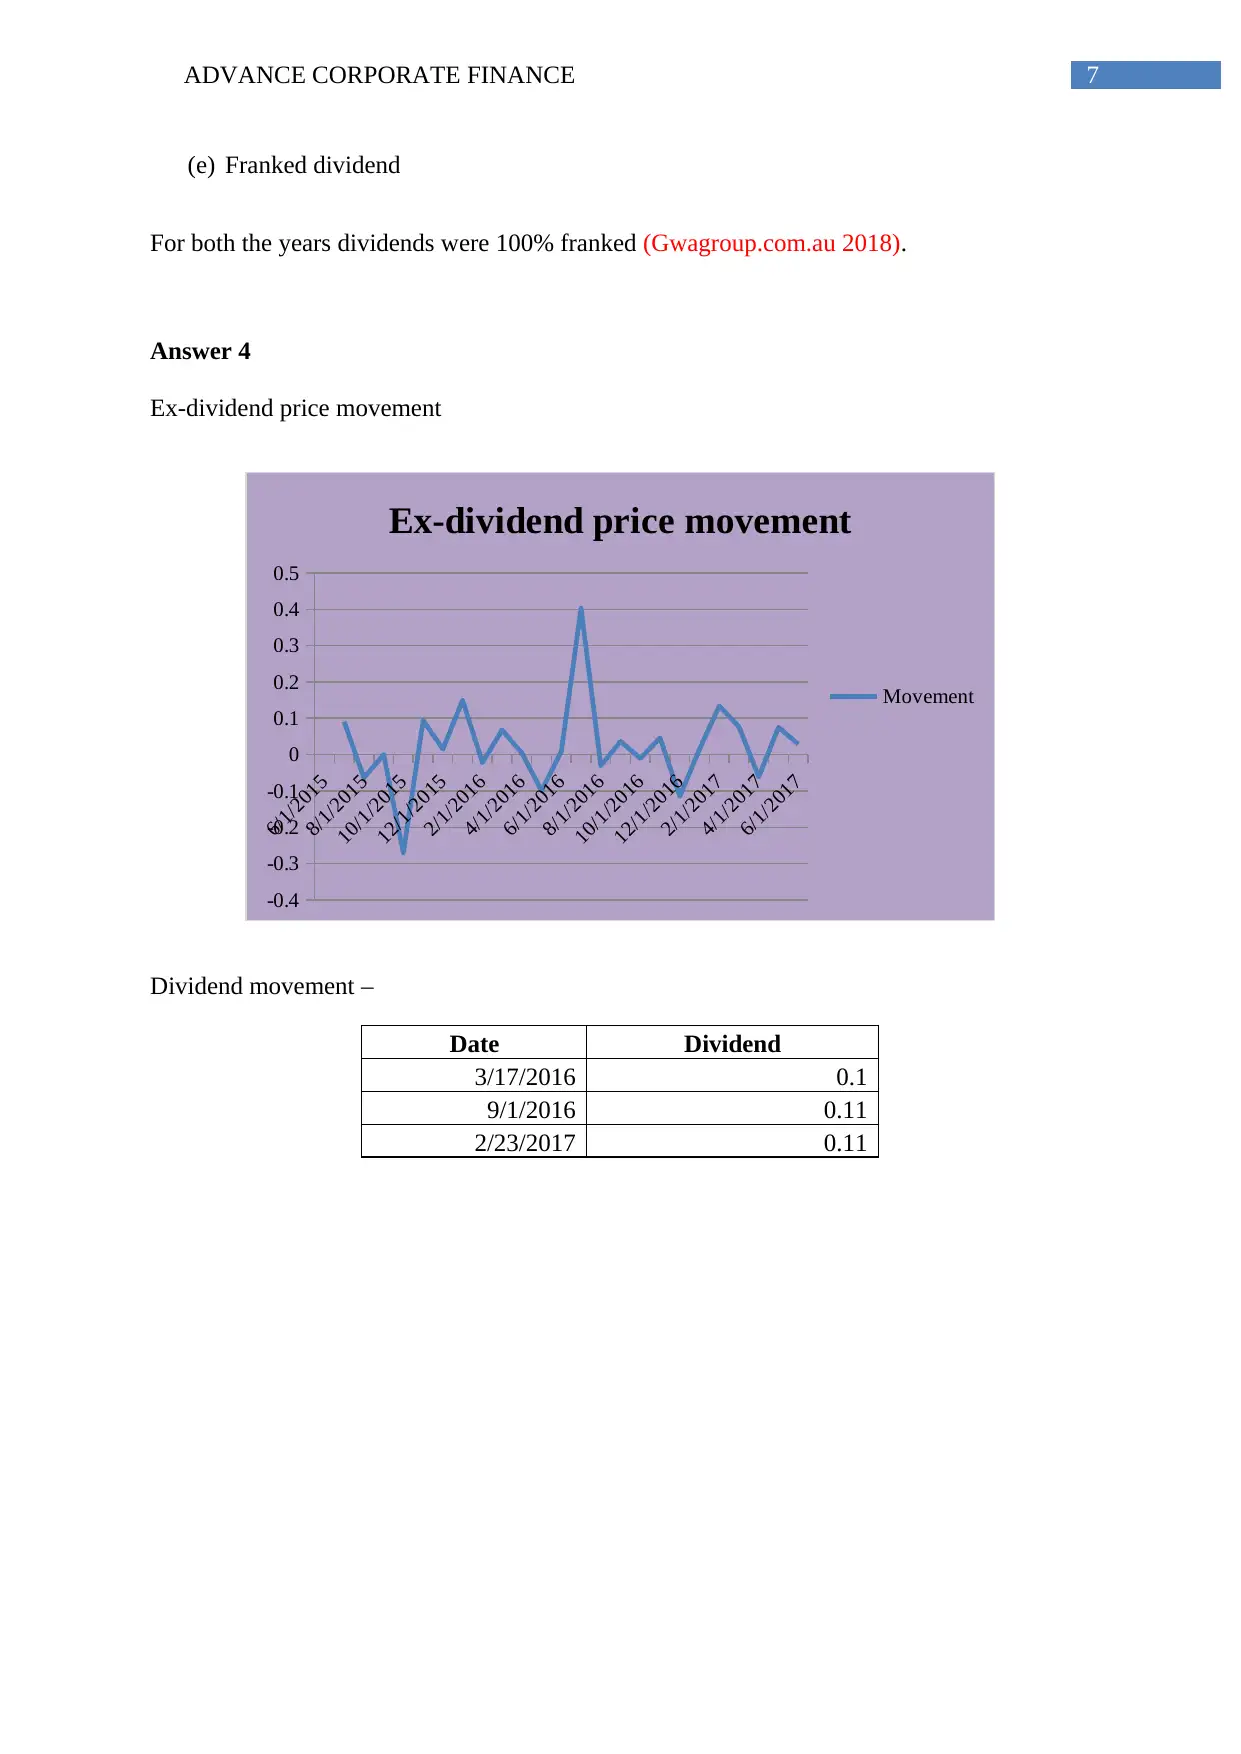
Ex-dividend price movement
6/1/2015
8/1/2015
10/1/2015
12/1/2015
2/1/2016
4/1/2016
6/1/2016
8/1/2016
10/1/2016
12/1/2016
2/1/2017
4/1/2017
6/1/2017
-0.4
-0.3
-0.2
-0.1
0
0.1
0.2
0.3
0.4
0.5
Ex-dividend price movement
Movement
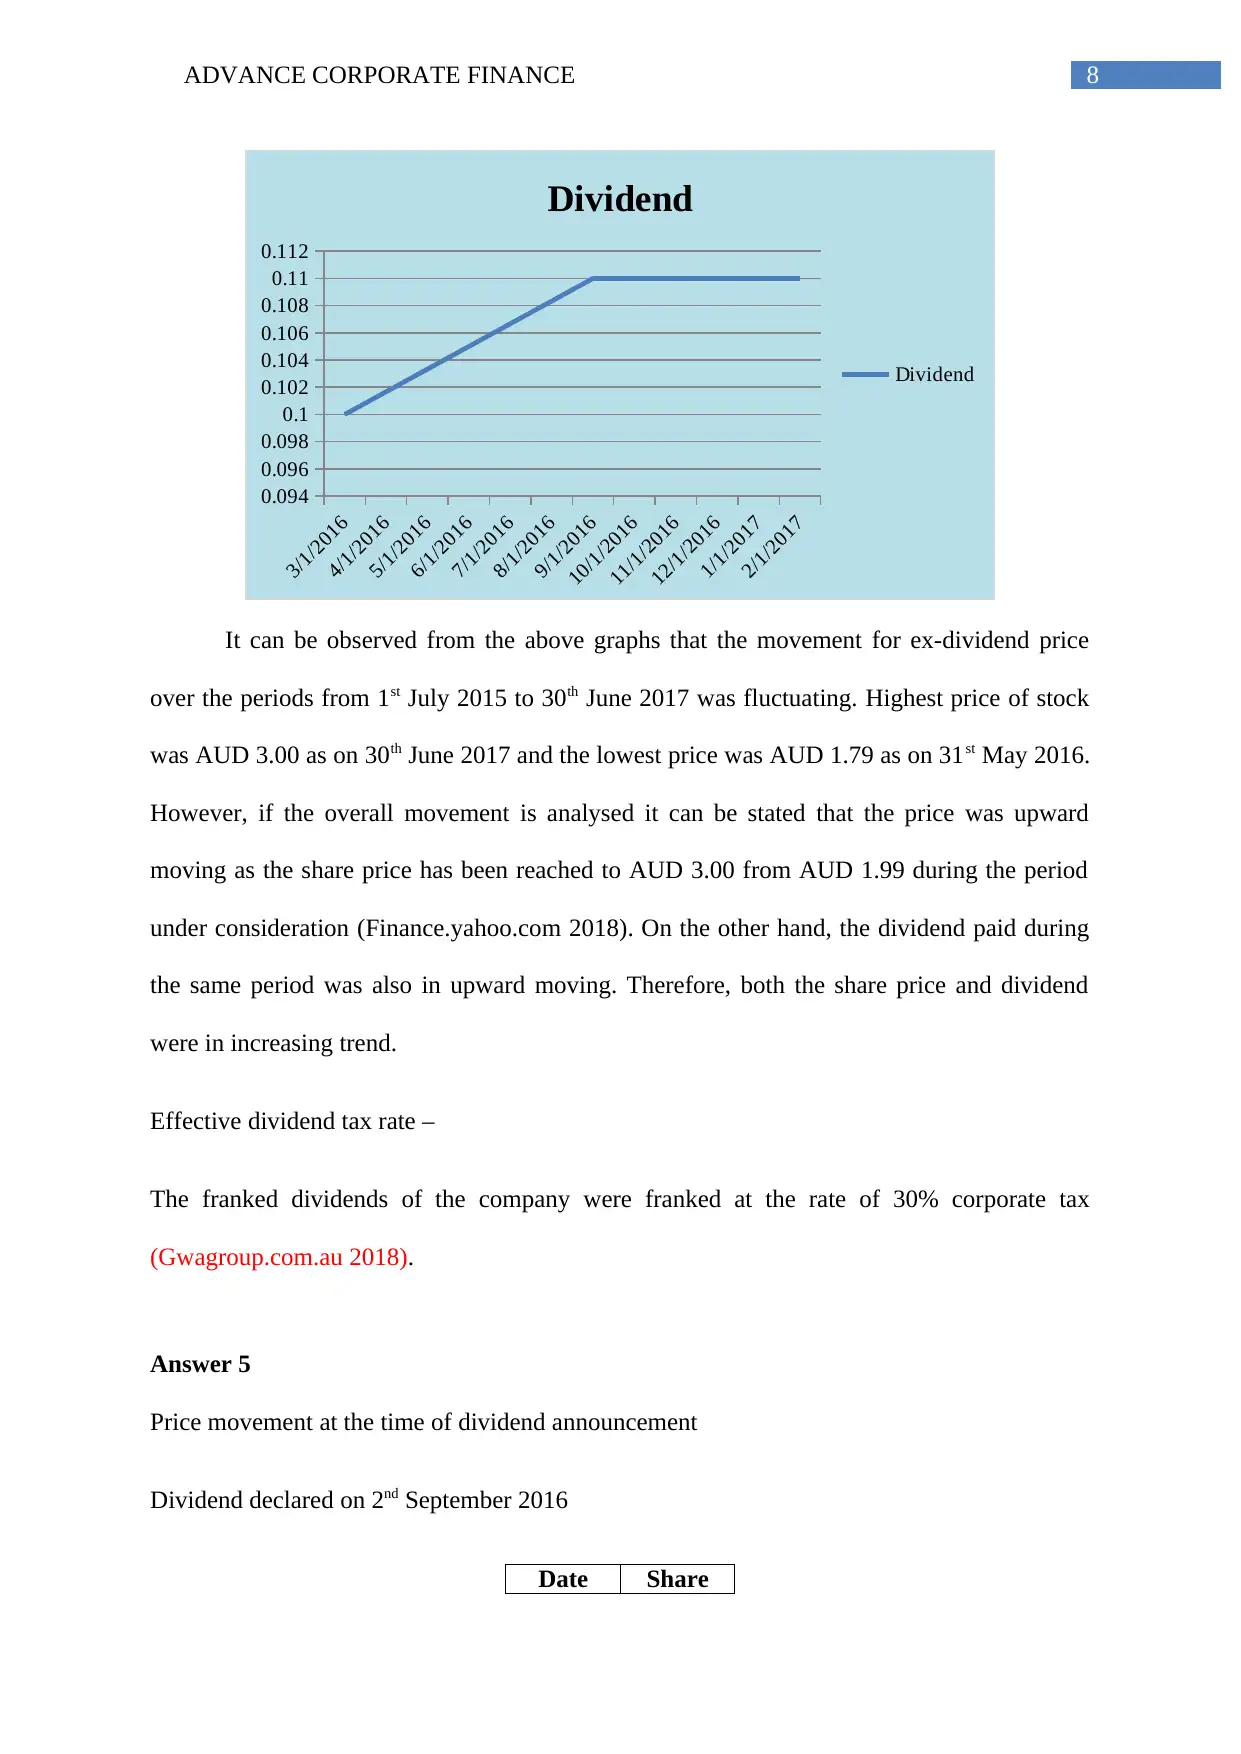
Dividend movement –
Date Dividend
3/17/2016 0.1
9/1/2016 0.11
2/23/2017 0.11
(e) Franked dividend
For both the years dividends were 100% franked (Gwagroup.com.au 2018).
Answer 4
Ex-dividend price movement
6/1/2015
8/1/2015
10/1/2015
12/1/2015
2/1/2016
4/1/2016
6/1/2016
8/1/2016
10/1/2016
12/1/2016
2/1/2017
4/1/2017
6/1/2017
-0.4
-0.3
-0.2
-0.1
0
0.1
0.2
0.3
0.4
0.5
Ex-dividend price movement
Movement
Dividend movement –
Date Dividend
3/17/2016 0.1
9/1/2016 0.11
2/23/2017 0.11
8ADVANCE CORPORATE FINANCE
3/1/2016
4/1/2016
5/1/2016
6/1/2016
7/1/2016
8/1/2016
9/1/2016
10/1/2016
11/1/2016
12/1/2016
1/1/2017
2/1/2017
0.094
0.096
0.098
0.1
0.102
0.104
0.106
0.108
0.11
0.112
Dividend
Dividend
It can be observed from the above graphs that the movement for ex-dividend price
over the periods from 1st July 2015 to 30th June 2017 was fluctuating. Highest price of stock
was AUD 3.00 as on 30th June 2017 and the lowest price was AUD 1.79 as on 31st May 2016.
However, if the overall movement is analysed it can be stated that the price was upward
moving as the share price has been reached to AUD 3.00 from AUD 1.99 during the period
under consideration (Finance.yahoo.com 2018). On the other hand, the dividend paid during
the same period was also in upward moving. Therefore, both the share price and dividend
were in increasing trend.
Effective dividend tax rate –
The franked dividends of the company were franked at the rate of 30% corporate tax
(Gwagroup.com.au 2018).
Answer 5
Price movement at the time of dividend announcement
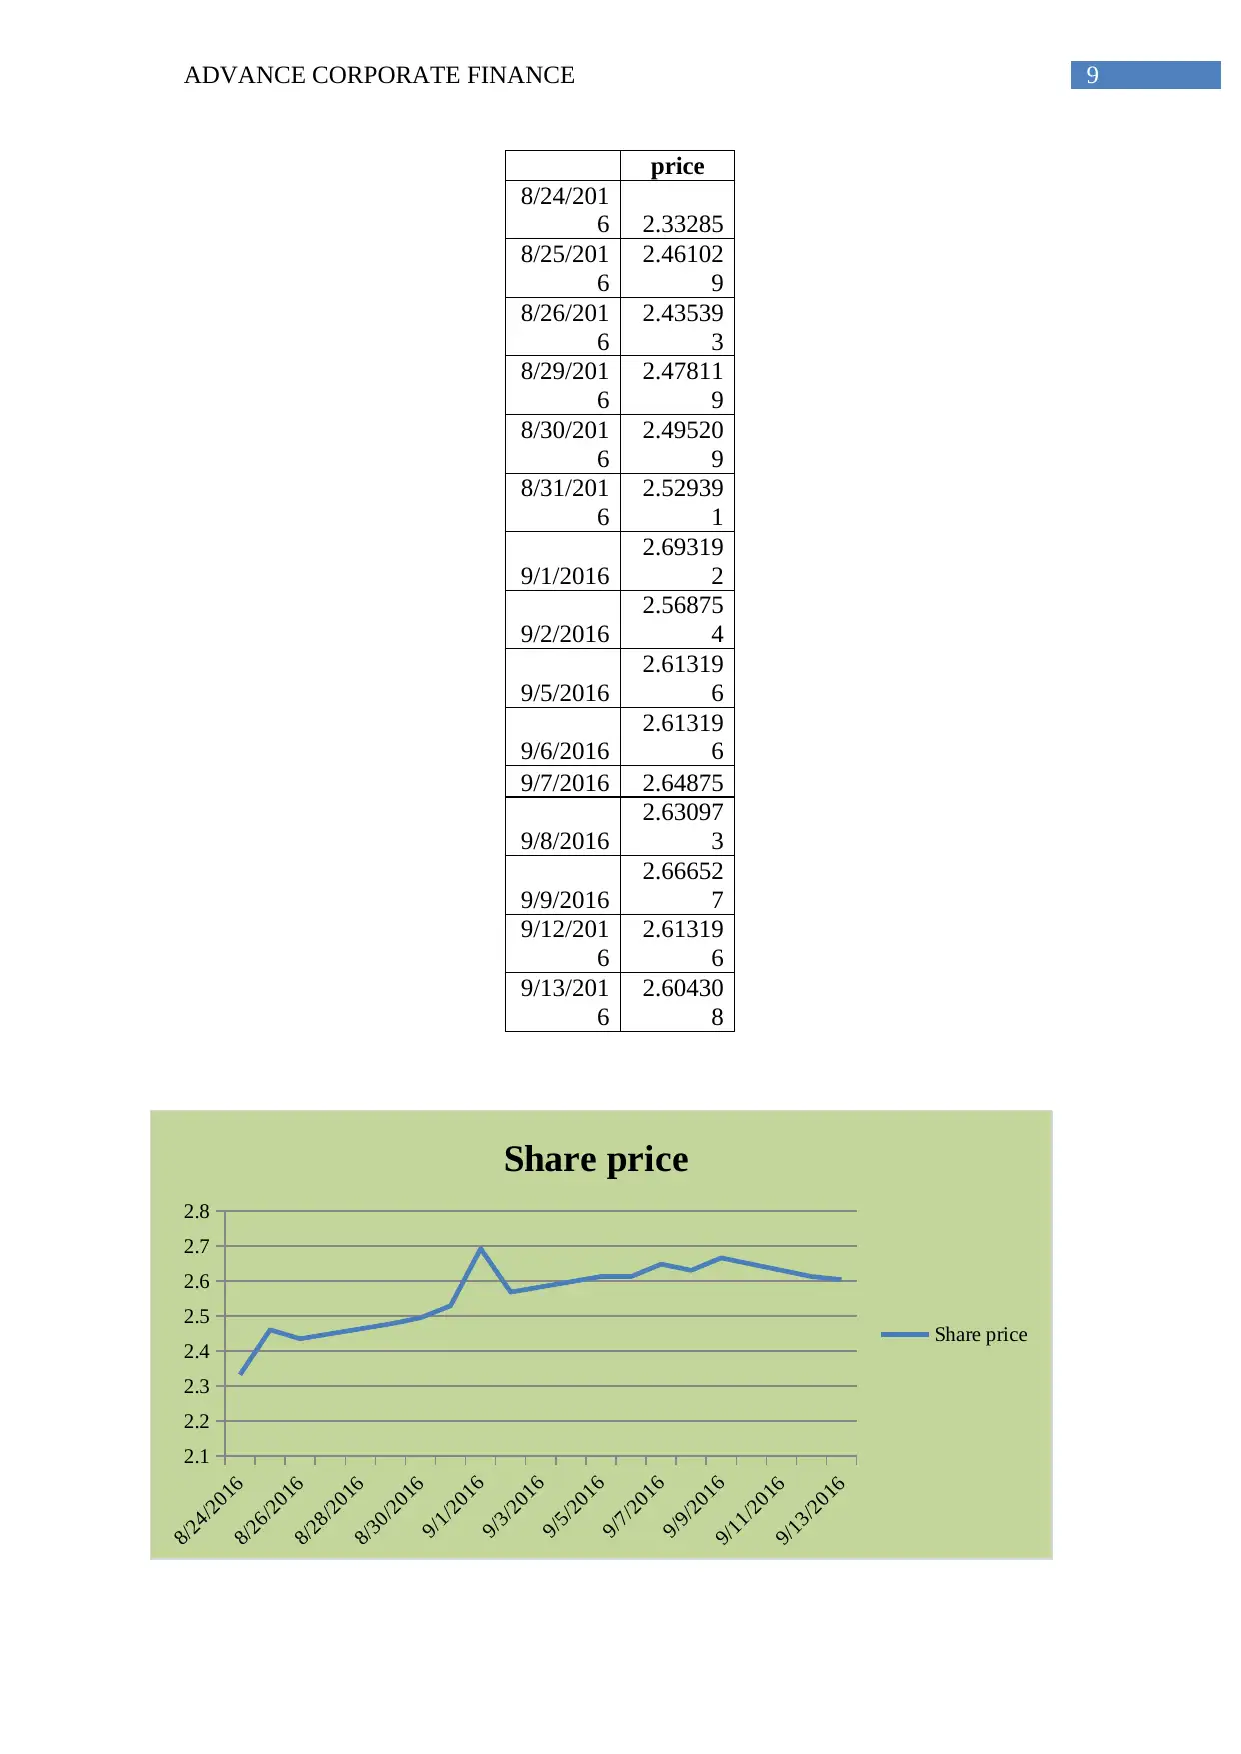
Dividend declared on 2nd September 2016
Date Share
3/1/2016
4/1/2016
5/1/2016
6/1/2016
7/1/2016
8/1/2016
9/1/2016
10/1/2016
11/1/2016
12/1/2016
1/1/2017
2/1/2017
0.094
0.096
0.098
0.1
0.102
0.104
0.106
0.108
0.11
0.112
Dividend
Dividend
It can be observed from the above graphs that the movement for ex-dividend price
over the periods from 1st July 2015 to 30th June 2017 was fluctuating. Highest price of stock
was AUD 3.00 as on 30th June 2017 and the lowest price was AUD 1.79 as on 31st May 2016.
However, if the overall movement is analysed it can be stated that the price was upward
moving as the share price has been reached to AUD 3.00 from AUD 1.99 during the period
under consideration (Finance.yahoo.com 2018). On the other hand, the dividend paid during
the same period was also in upward moving. Therefore, both the share price and dividend
were in increasing trend.
Effective dividend tax rate –
The franked dividends of the company were franked at the rate of 30% corporate tax
(Gwagroup.com.au 2018).
Answer 5
Price movement at the time of dividend announcement
Dividend declared on 2nd September 2016
Date Share
⊘ This is a preview!⊘
Do you want full access?
Subscribe today to unlock all pages.
Trusted by 1+ million students worldwide
9ADVANCE CORPORATE FINANCE
price
8/24/201
6 2.33285
8/25/201
6
2.46102
9
8/26/201
6
2.43539
3
8/29/201
6
2.47811
9
8/30/201
6
2.49520
9
8/31/201
6
2.52939
1
9/1/2016
2.69319
2
9/2/2016
2.56875
4
9/5/2016
2.61319
6
9/6/2016
2.61319
6
9/7/2016 2.64875
9/8/2016
2.63097
3
9/9/2016
2.66652
7
9/12/201
6
2.61319
6
9/13/201
6
2.60430
8
8/24/2016
8/26/2016
8/28/2016
8/30/2016
9/1/2016
9/3/2016
9/5/2016
9/7/2016
9/9/2016
9/11/2016
9/13/2016
2.1
2.2
2.3
2.4
2.5
2.6
2.7
2.8
Share price
Share price
Paraphrase This Document
Need a fresh take? Get an instant paraphrase of this document with our AI Paraphraser
10ADVANCE CORPORATE FINANCE
It can be seen that after declaring the dividend the share price of the company has
been increased moderately and there was no major fluctuation in the share price in next 10
days.
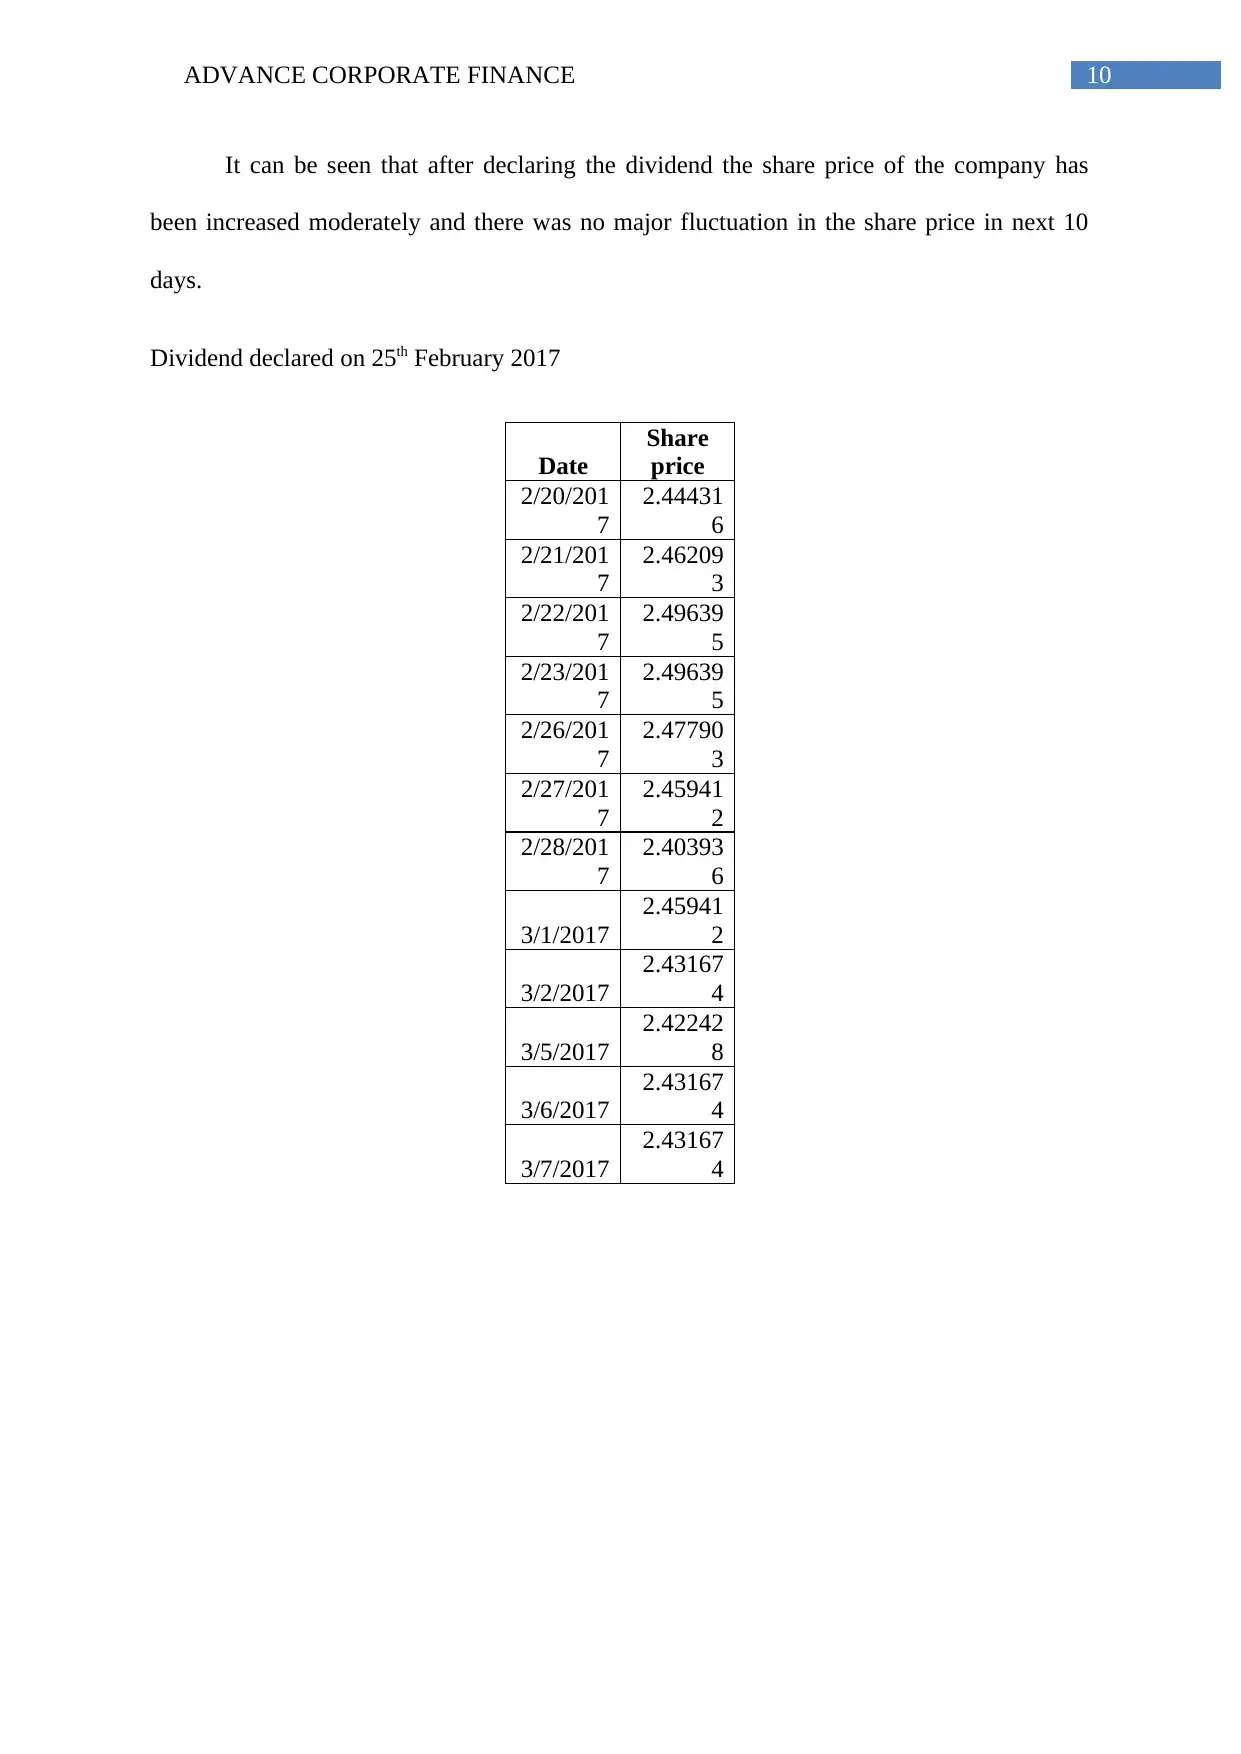
Dividend declared on 25th February 2017
Date
Share
price
2/20/201
7
2.44431
6
2/21/201
7
2.46209
3
2/22/201
7
2.49639
5
2/23/201
7
2.49639
5
2/26/201
7
2.47790
3
2/27/201
7
2.45941
2
2/28/201
7
2.40393
6
3/1/2017
2.45941
2
3/2/2017
2.43167
4
3/5/2017
2.42242
8
3/6/2017
2.43167
4
3/7/2017
2.43167
4
It can be seen that after declaring the dividend the share price of the company has
been increased moderately and there was no major fluctuation in the share price in next 10
days.
Dividend declared on 25th February 2017
Date
Share
price
2/20/201
7
2.44431
6
2/21/201
7
2.46209
3
2/22/201
7
2.49639
5
2/23/201
7
2.49639
5
2/26/201
7
2.47790
3
2/27/201
7
2.45941
2
2/28/201
7
2.40393
6
3/1/2017
2.45941
2
3/2/2017
2.43167
4
3/5/2017
2.42242
8
3/6/2017
2.43167
4
3/7/2017
2.43167
4
11ADVANCE CORPORATE FINANCE
2/20/2017
2/21/2017
2/22/2017
2/23/2017
2/24/2017
2/25/2017
2/26/2017
2/27/2017
2/28/2017
3/1/2017
3/2/2017
3/3/2017
3/4/2017
3/5/2017
3/6/2017
3/7/2017
2.34
2.36
2.38
2.4
2.42
2.44
2.46
2.48
2.5
2.52
Share price
Share price
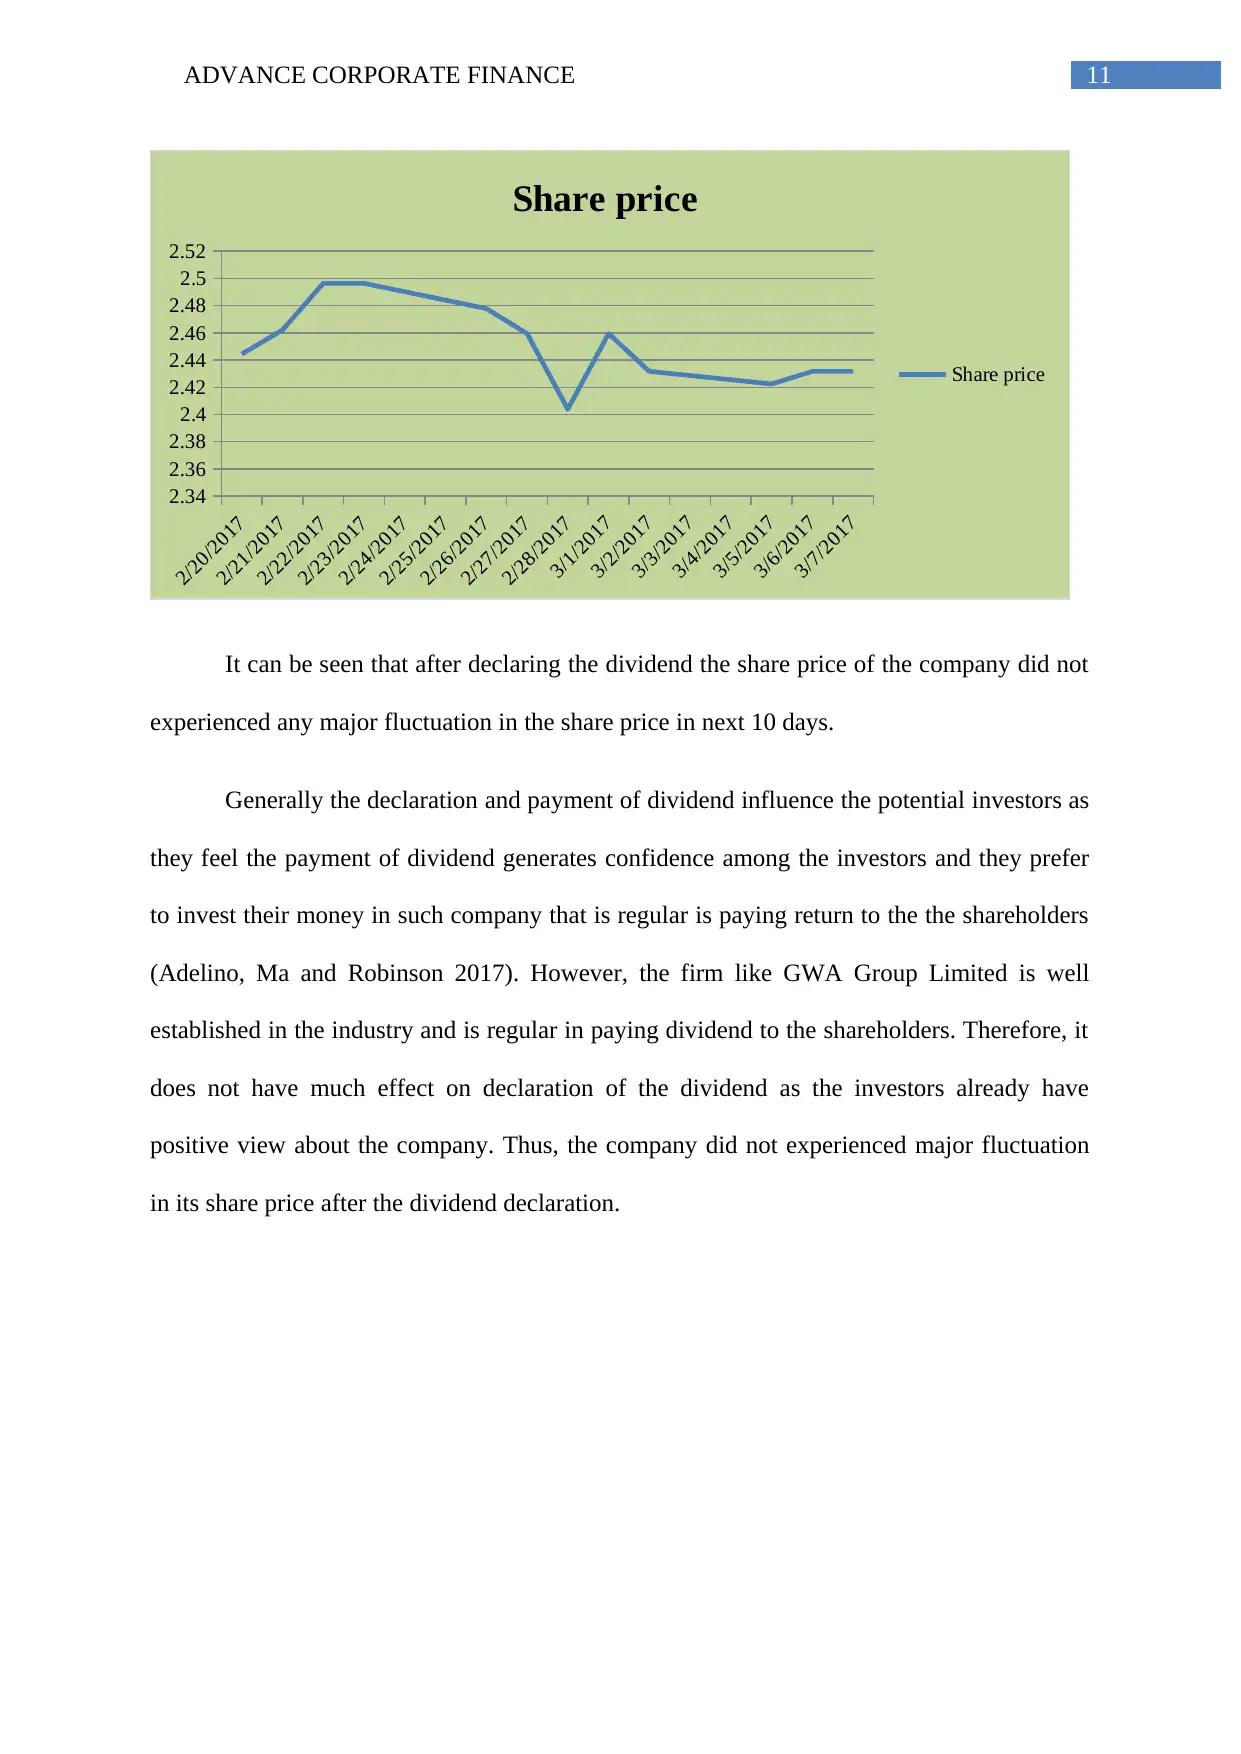
It can be seen that after declaring the dividend the share price of the company did not
experienced any major fluctuation in the share price in next 10 days.
Generally the declaration and payment of dividend influence the potential investors as
they feel the payment of dividend generates confidence among the investors and they prefer
to invest their money in such company that is regular is paying return to the the shareholders
(Adelino, Ma and Robinson 2017). However, the firm like GWA Group Limited is well
established in the industry and is regular in paying dividend to the shareholders. Therefore, it
does not have much effect on declaration of the dividend as the investors already have
positive view about the company. Thus, the company did not experienced major fluctuation
in its share price after the dividend declaration.
2/20/2017
2/21/2017
2/22/2017
2/23/2017
2/24/2017
2/25/2017
2/26/2017
2/27/2017
2/28/2017
3/1/2017
3/2/2017
3/3/2017
3/4/2017
3/5/2017
3/6/2017
3/7/2017
2.34
2.36
2.38
2.4
2.42
2.44
2.46
2.48
2.5
2.52
Share price
Share price
It can be seen that after declaring the dividend the share price of the company did not
experienced any major fluctuation in the share price in next 10 days.
Generally the declaration and payment of dividend influence the potential investors as
they feel the payment of dividend generates confidence among the investors and they prefer
to invest their money in such company that is regular is paying return to the the shareholders
(Adelino, Ma and Robinson 2017). However, the firm like GWA Group Limited is well
established in the industry and is regular in paying dividend to the shareholders. Therefore, it
does not have much effect on declaration of the dividend as the investors already have
positive view about the company. Thus, the company did not experienced major fluctuation
in its share price after the dividend declaration.
⊘ This is a preview!⊘
Do you want full access?
Subscribe today to unlock all pages.
Trusted by 1+ million students worldwide
1 out of 14
Related Documents


Your All-in-One AI-Powered Toolkit for Academic Success.
+13062052269
info@desklib.com
Available 24*7 on WhatsApp / Email
![[object Object]](/_next/static/media/star-bottom.7253800d.svg)
Unlock your academic potential
Copyright © 2020–2026 A2Z Services. All Rights Reserved. Developed and managed by ZUCOL.