Financial Performance Analysis of Restaurant Brands in New Zealand
VerifiedAdded on 2021/04/24
|13
|1816
|68
Report
AI Summary
This report provides a comprehensive financial analysis of Restaurant Brands New Zealand, focusing on the performance of KFC, Pizza Hut, Starbucks Coffee, and Carl's Jr. The analysis is conducted in accordance with NZ IFRS 8, examining key financial metrics such as sales revenue, EBITDA, gross margin, and return on assets (ROA) over a five-year period. The report compares and contrasts the performance of each segment, highlighting trends, strengths, and weaknesses. KFC demonstrates strong sales and EBITDA growth, while Pizza Hut shows stable sales. Starbucks Coffee has a higher gross margin, and Carl's Jr. shows steady progress. The analysis includes graphical representations of segment performance and discusses factors influencing financial outcomes, such as store openings, closures, and market conditions. The report concludes with an assessment of the overall financial performance of each brand and provides references to support the analysis.
Running head: ADVANCE FINANCIAL ACCOUNTING
Advance Financial Accounting
Name of the Student
Name of the University
Authors Note
Course ID
Advance Financial Accounting
Name of the Student
Name of the University
Authors Note
Course ID
Paraphrase This Document
Need a fresh take? Get an instant paraphrase of this document with our AI Paraphraser
1ADVANCE FINANCIAL ACCOUNTING
Table of Contents
Introduction:...............................................................................................................................2
Compare and Contrast of Financial Analysis:...........................................................................2
KFC New Zealand:....................................................................................................................3
KFC Australia:...........................................................................................................................4
Pizza Hut New Zealand:.............................................................................................................5
Starbucks Coffee New Zealand:.................................................................................................6
Carl’s Jr New Zealand:...............................................................................................................7
Conclusion:................................................................................................................................8
Reference List:...........................................................................................................................9
2ADVANCE FINANCIAL ACCOUNTING
Introduction:
The current study is based on analysis of the financial performance of each of the five
operating New Zealand segments. This includes KFC, Pizza Hut, Starbucks Coffee, Carl’s Jr
and KFC Australia. The NZ IFRS 8 specifies the method through which an organization must
report the information regarding its operating segments (Loftus et al., 2017). The analysis
will be carried out in terms of International Financial Reporting Standard 8 for the
disclosure of the financial information regarding an entity’s operating segments.
Compare and Contrast of Financial Analysis:
The previous year has witnessed a noteworthy change for the restaurant brands from
chiefly a home emphasis brand to a global brand. The company has reported a profitable
financial year with net profit after tax standing $26 million, a rise of 7.8% on the previous
year income of $24.1 million (www.restaurantbrands.co.nz, 2018). The year-end stores stood
212 with New Zealand stores totalling 170 stores with KFC Australia bringing 42 stores into
the network.
The segment performance in the areas of gross margin for Starbucks coffee stood
better as the company reported a higher gross margin of than the other brands. On the other
hand, the return on assets for the for the pizza hut in comparison to its peers stood strong
(www.restaurantbrands.co.nz, 2018). The return on assets for the Carlsberg stood relatively
lower. The comparative analysis provides that sales revenue for the KFC group stood
relatively strong as the over the period of five years the company reported higher proportion
of sales.
On the other hand, Pizza hut reported a better and stable sales performance of over the
period of five years as the sales trend stood relatively stable. Gauging into the EBITDA for
each segment, the performance of KFC stood strong during the last five years (Loftus et al.,
⊘ This is a preview!⊘
Do you want full access?
Subscribe today to unlock all pages.
Trusted by 1+ million students worldwide
3ADVANCE FINANCIAL ACCOUNTING
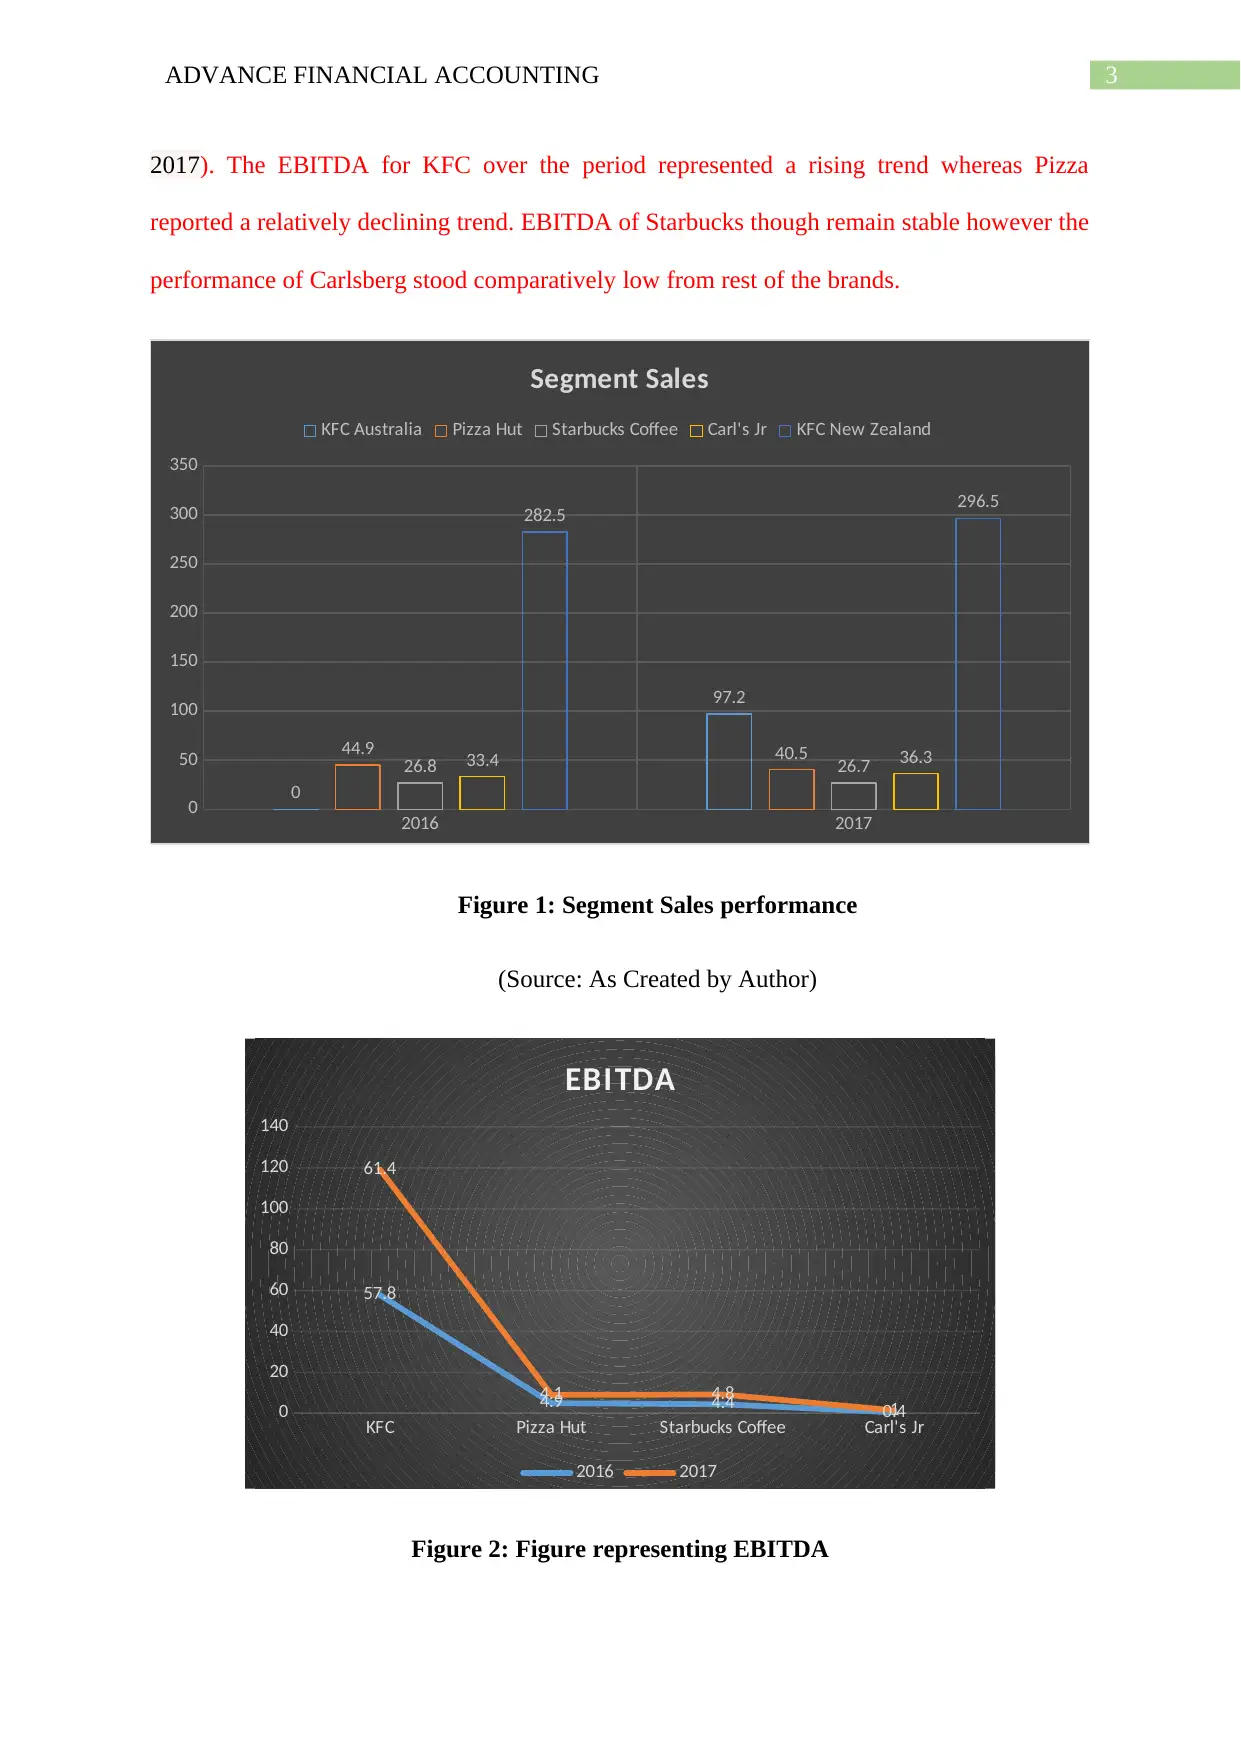
2017). The EBITDA for KFC over the period represented a rising trend whereas Pizza
reported a relatively declining trend. EBITDA of Starbucks though remain stable however the
performance of Carlsberg stood comparatively low from rest of the brands.
2016 2017
0
50
100
150
200
250
300
350
0
97.2
44.9 40.5
26.8 26.733.4 36.3
282.5 296.5
Segment Sales
KFC Australia Pizza Hut Starbucks Coffee Carl's Jr KFC New Zealand
Figure 1: Segment Sales performance
(Source: As Created by Author)
KFC Pizza Hut Starbucks Coffee Carl's Jr
0
20
40
60
80
100
120
140
57.8
4.9 4.4 0.4
61.4
4.1 4.8 1
EBITDA
2016 2017
Figure 2: Figure representing EBITDA
Paraphrase This Document
Need a fresh take? Get an instant paraphrase of this document with our AI Paraphraser
4ADVANCE FINANCIAL ACCOUNTING
(Source: As Created by Author)
24.2; 44%
30.6; 56%
NPAT
2016
2017
Figure 3: Figure representing NPAT
(Source: As Created by Author)
Return on Assets:
2016 2017
0
5
10
15
20
25
30
35
40
28.32
35.79
21.05 20.11
3.56 1.04
7.28 9.15
ROA
Pizza Hut Starbucks Coffee Carl's Jr KFC
Figure 4: Figure representing ROA
(Source: As Created by Author)
(Source: As Created by Author)
24.2; 44%
30.6; 56%
NPAT
2016
2017
Figure 3: Figure representing NPAT
(Source: As Created by Author)
Return on Assets:
2016 2017
0
5
10
15
20
25
30
35
40
28.32
35.79
21.05 20.11
3.56 1.04
7.28 9.15
ROA
Pizza Hut Starbucks Coffee Carl's Jr KFC
Figure 4: Figure representing ROA
(Source: As Created by Author)
5ADVANCE FINANCIAL ACCOUNTING
2016 2017
0
10
20
30
40
50
60
70
31 31.1
60.1 59.6
50.2 50.9
30.6 32.4
Gross Margin
Pizza Hut Starbucks Coffee Carl's Jr KFC
Figure 5: Figure representing Gross Margin
(Source: As Created by Author)
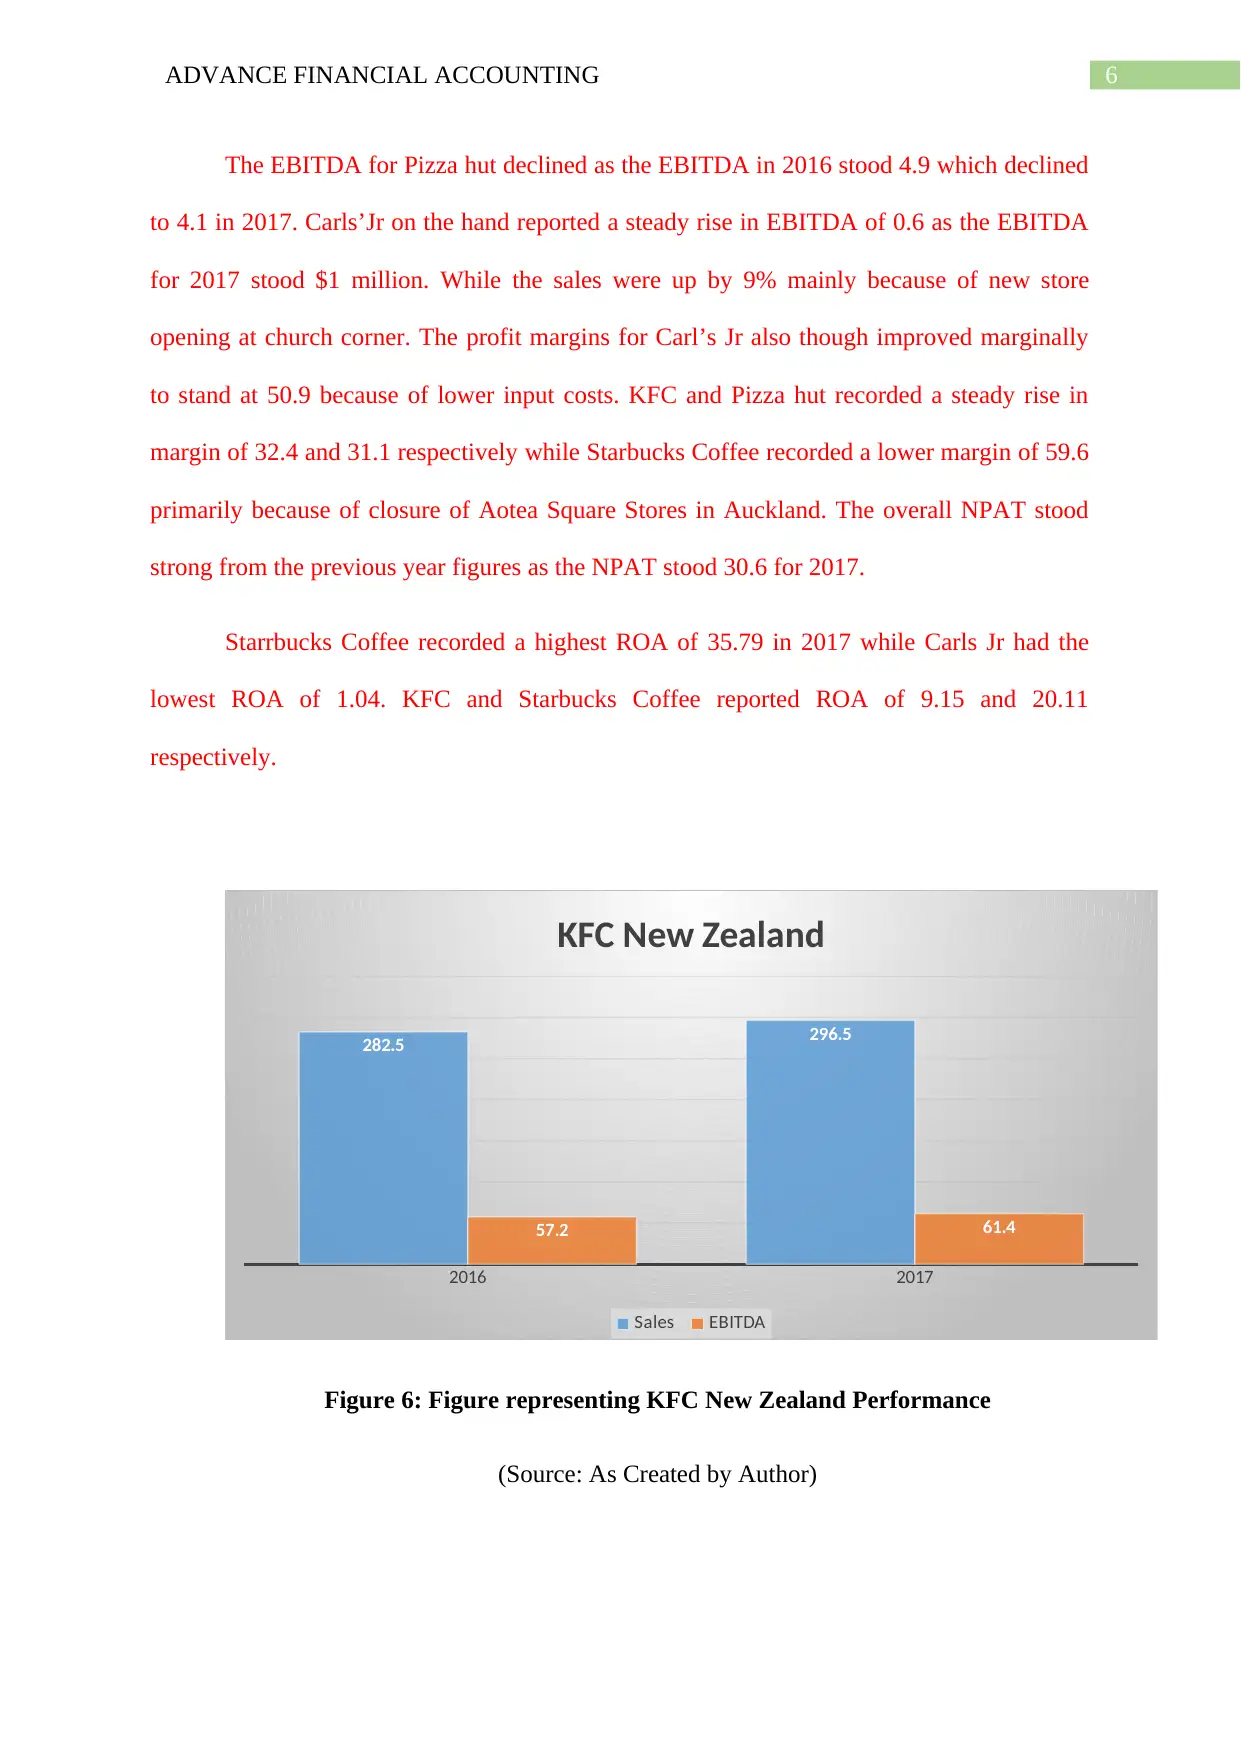
Denoting from the above stated graphical representation the sales segment of KFC
both in 2016 and 2017 had the most sales with sales figure standing 282.5 and 296.5
respectively. Starbucks coffee recorded a lowest sales for both 2016 and 2017 as the figures
in comparative to its peers stood as low as 26.8 and 26.7 respectively. The primary reason for
higher segment sale of KFC is because of the addition of 42 QSR Pty Ltd KFC stores in
NSW Australia which gave considerable amount of boost to the results of company and
added $97.2 million in sales with $15.0 million in EBITDA for KFC over the last ten month
span.
The KFC New Zealand had the best year in terms of sales with an increase in net
profit of $13.9 million a rise of 4.9%. Starbucks total sales have slightly declined due to the
closure of large Auckland CBD stores though Starbucks have enjoyed better profit
performance with EBIDTA of $4.8 million that is largely driven by store efficiency. The
sales segment for Pizza hut in 2016 stood 44.9 and 40.5 respectively in 2017. While the
Carl’Jr sales stood 33.4 and 36.3 in 2016 and 2017 respectively.
2016 2017
0
10
20
30
40
50
60
70
31 31.1
60.1 59.6
50.2 50.9
30.6 32.4
Gross Margin
Pizza Hut Starbucks Coffee Carl's Jr KFC
Figure 5: Figure representing Gross Margin
(Source: As Created by Author)
Denoting from the above stated graphical representation the sales segment of KFC
both in 2016 and 2017 had the most sales with sales figure standing 282.5 and 296.5
respectively. Starbucks coffee recorded a lowest sales for both 2016 and 2017 as the figures
in comparative to its peers stood as low as 26.8 and 26.7 respectively. The primary reason for
higher segment sale of KFC is because of the addition of 42 QSR Pty Ltd KFC stores in
NSW Australia which gave considerable amount of boost to the results of company and
added $97.2 million in sales with $15.0 million in EBITDA for KFC over the last ten month
span.
The KFC New Zealand had the best year in terms of sales with an increase in net
profit of $13.9 million a rise of 4.9%. Starbucks total sales have slightly declined due to the
closure of large Auckland CBD stores though Starbucks have enjoyed better profit
performance with EBIDTA of $4.8 million that is largely driven by store efficiency. The
sales segment for Pizza hut in 2016 stood 44.9 and 40.5 respectively in 2017. While the
Carl’Jr sales stood 33.4 and 36.3 in 2016 and 2017 respectively.
⊘ This is a preview!⊘
Do you want full access?
Subscribe today to unlock all pages.
Trusted by 1+ million students worldwide
6ADVANCE FINANCIAL ACCOUNTING
The EBITDA for Pizza hut declined as the EBITDA in 2016 stood 4.9 which declined
to 4.1 in 2017. Carls’Jr on the hand reported a steady rise in EBITDA of 0.6 as the EBITDA
for 2017 stood $1 million. While the sales were up by 9% mainly because of new store
opening at church corner. The profit margins for Carl’s Jr also though improved marginally
to stand at 50.9 because of lower input costs. KFC and Pizza hut recorded a steady rise in
margin of 32.4 and 31.1 respectively while Starbucks Coffee recorded a lower margin of 59.6
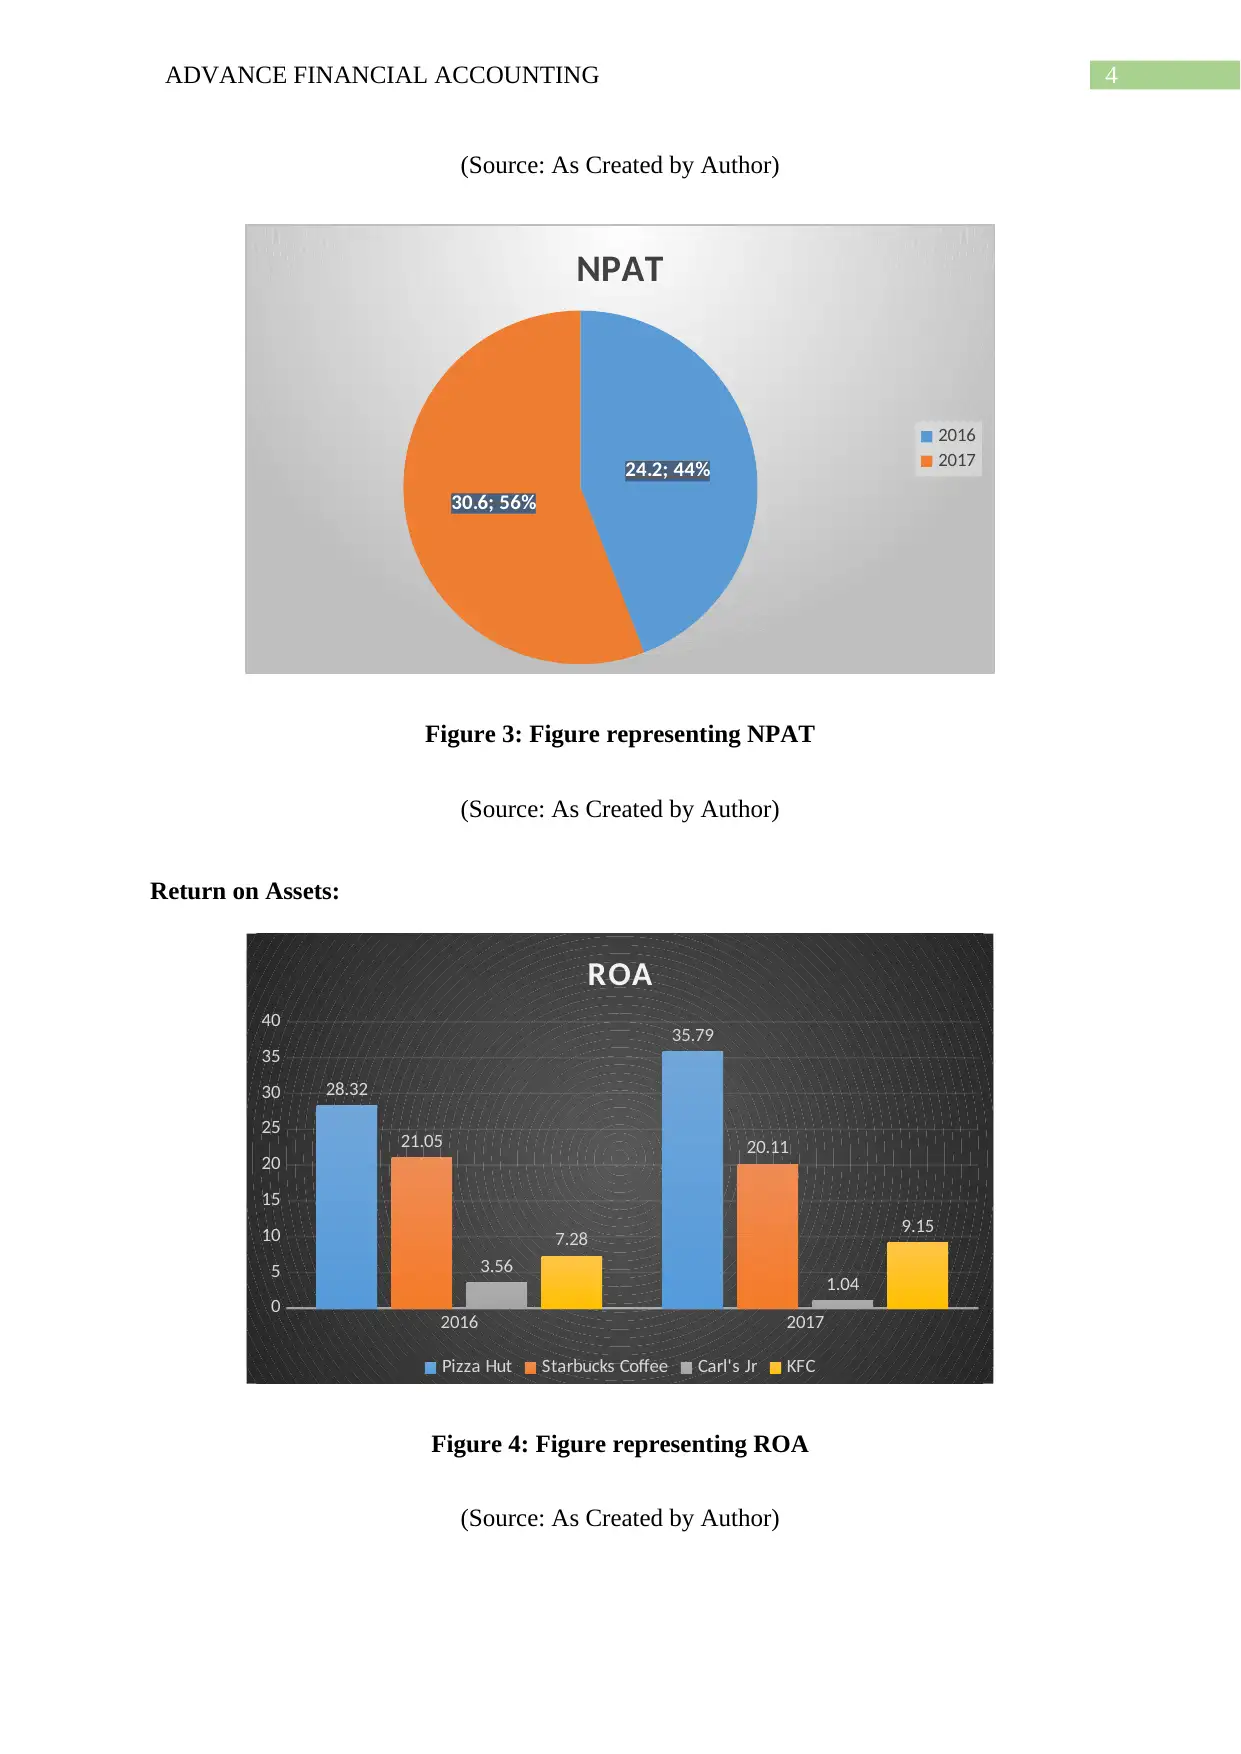
primarily because of closure of Aotea Square Stores in Auckland. The overall NPAT stood
strong from the previous year figures as the NPAT stood 30.6 for 2017.
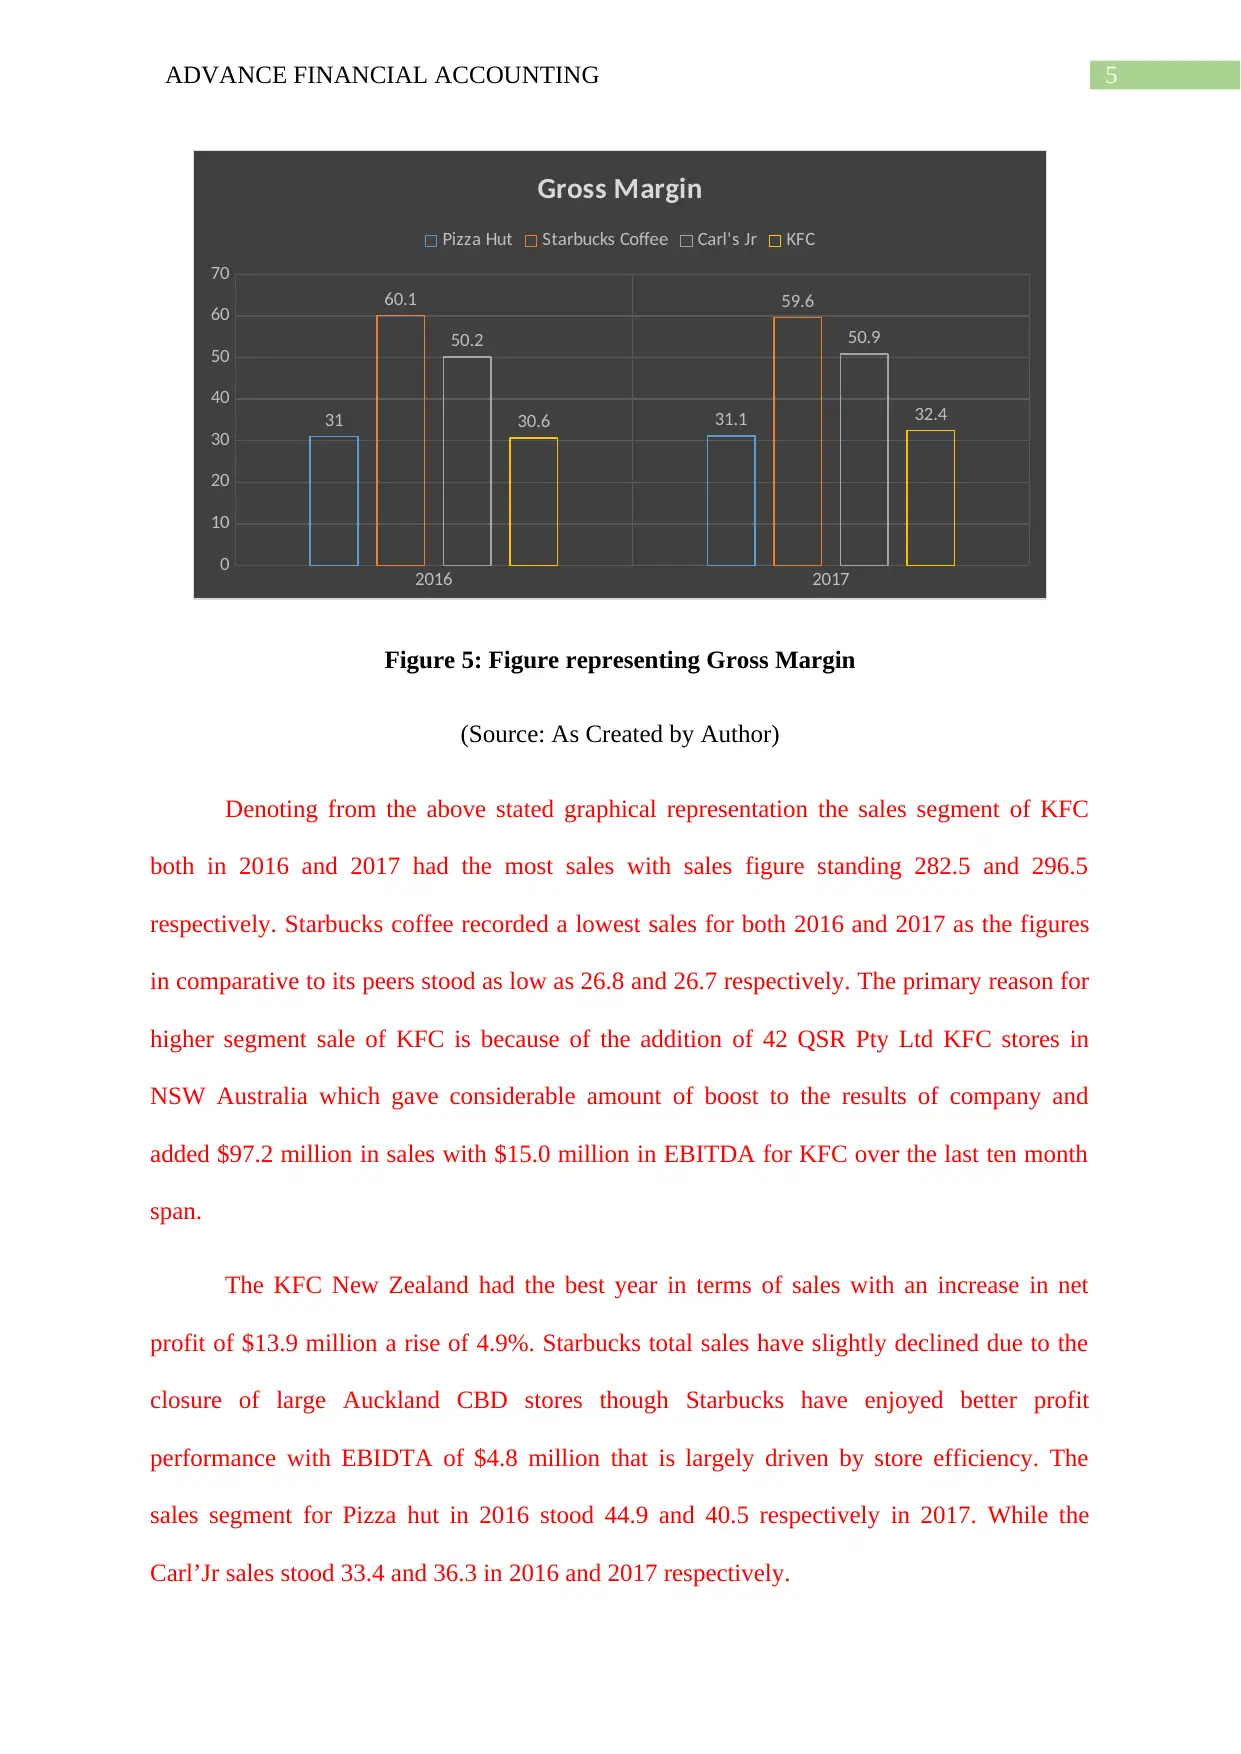
Starrbucks Coffee recorded a highest ROA of 35.79 in 2017 while Carls Jr had the
lowest ROA of 1.04. KFC and Starbucks Coffee reported ROA of 9.15 and 20.11
respectively.
2016 2017
282.5 296.5
57.2 61.4
KFC New Zealand
Sales EBITDA
Figure 6: Figure representing KFC New Zealand Performance
(Source: As Created by Author)
The EBITDA for Pizza hut declined as the EBITDA in 2016 stood 4.9 which declined
to 4.1 in 2017. Carls’Jr on the hand reported a steady rise in EBITDA of 0.6 as the EBITDA
for 2017 stood $1 million. While the sales were up by 9% mainly because of new store
opening at church corner. The profit margins for Carl’s Jr also though improved marginally
to stand at 50.9 because of lower input costs. KFC and Pizza hut recorded a steady rise in
margin of 32.4 and 31.1 respectively while Starbucks Coffee recorded a lower margin of 59.6
primarily because of closure of Aotea Square Stores in Auckland. The overall NPAT stood
strong from the previous year figures as the NPAT stood 30.6 for 2017.
Starrbucks Coffee recorded a highest ROA of 35.79 in 2017 while Carls Jr had the
lowest ROA of 1.04. KFC and Starbucks Coffee reported ROA of 9.15 and 20.11
respectively.
2016 2017
282.5 296.5
57.2 61.4
KFC New Zealand
Sales EBITDA
Figure 6: Figure representing KFC New Zealand Performance
(Source: As Created by Author)
Paraphrase This Document
Need a fresh take? Get an instant paraphrase of this document with our AI Paraphraser
7ADVANCE FINANCIAL ACCOUNTING
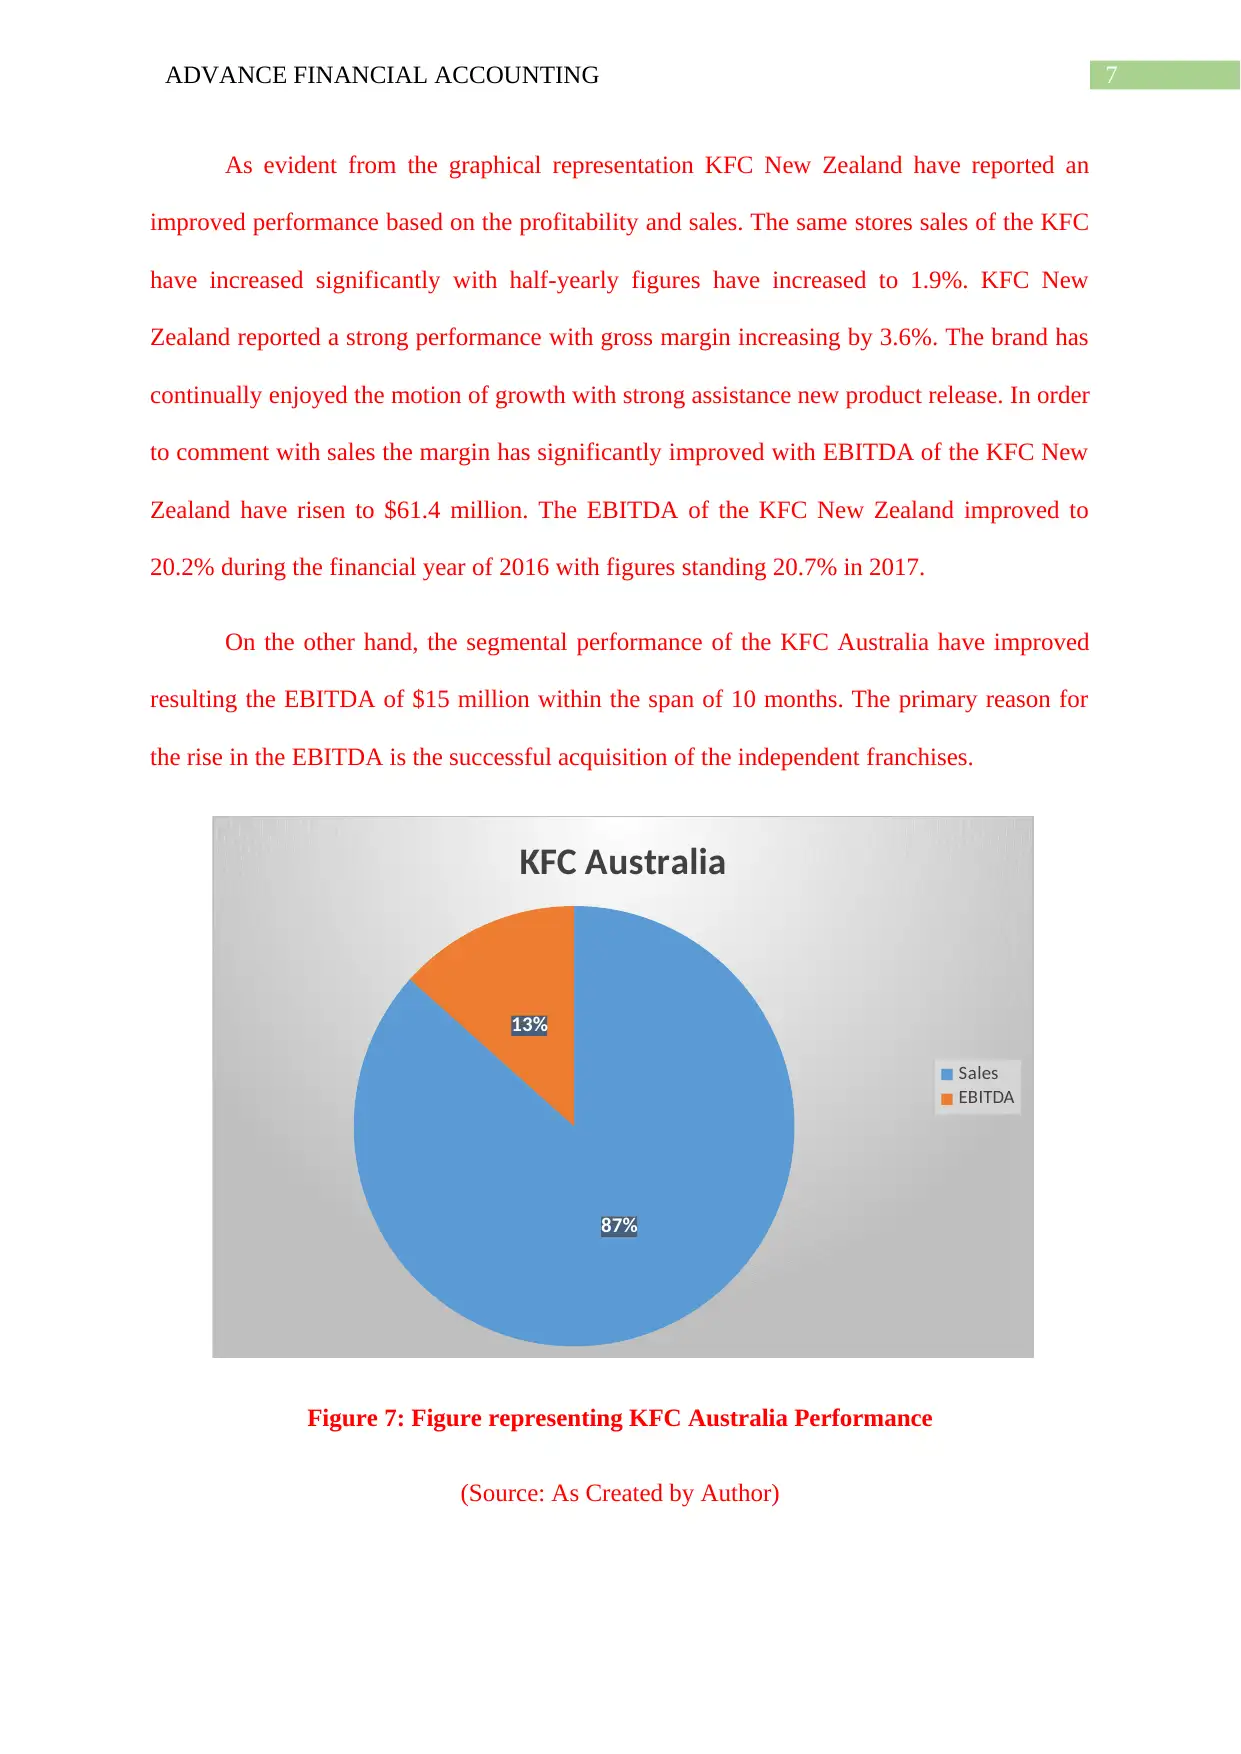
As evident from the graphical representation KFC New Zealand have reported an
improved performance based on the profitability and sales. The same stores sales of the KFC
have increased significantly with half-yearly figures have increased to 1.9%. KFC New
Zealand reported a strong performance with gross margin increasing by 3.6%. The brand has
continually enjoyed the motion of growth with strong assistance new product release. In order
to comment with sales the margin has significantly improved with EBITDA of the KFC New
Zealand have risen to $61.4 million. The EBITDA of the KFC New Zealand improved to
20.2% during the financial year of 2016 with figures standing 20.7% in 2017.
On the other hand, the segmental performance of the KFC Australia have improved
resulting the EBITDA of $15 million within the span of 10 months. The primary reason for
the rise in the EBITDA is the successful acquisition of the independent franchises.
87%
13%
KFC Australia
Sales
EBITDA
Figure 7: Figure representing KFC Australia Performance
(Source: As Created by Author)
8ADVANCE FINANCIAL ACCOUNTING
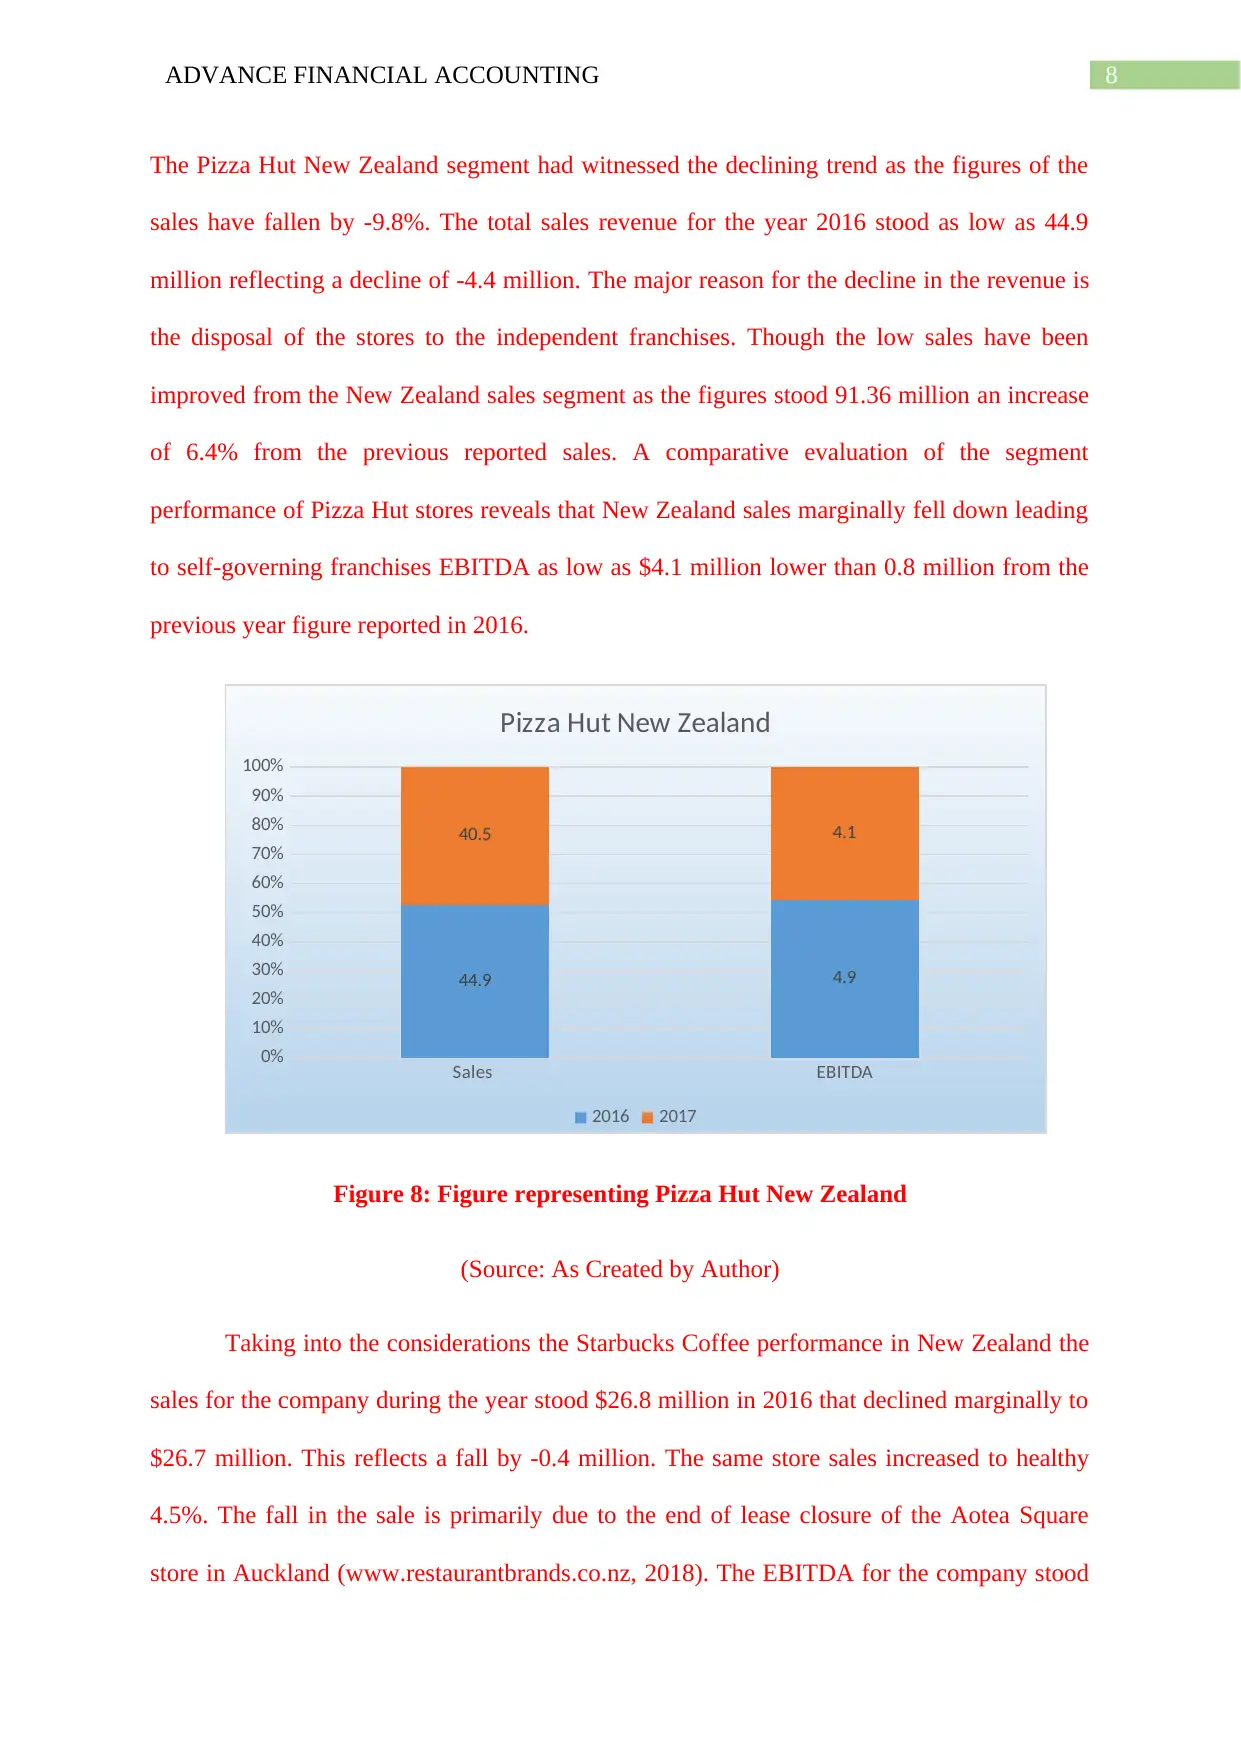
The Pizza Hut New Zealand segment had witnessed the declining trend as the figures of the
sales have fallen by -9.8%. The total sales revenue for the year 2016 stood as low as 44.9
million reflecting a decline of -4.4 million. The major reason for the decline in the revenue is
the disposal of the stores to the independent franchises. Though the low sales have been
improved from the New Zealand sales segment as the figures stood 91.36 million an increase
of 6.4% from the previous reported sales. A comparative evaluation of the segment
performance of Pizza Hut stores reveals that New Zealand sales marginally fell down leading
to self-governing franchises EBITDA as low as $4.1 million lower than 0.8 million from the
previous year figure reported in 2016.
Sales EBITDA
0%
10%
20%
30%
40%
50%
60%
70%
80%
90%
100%
44.9 4.9
40.5 4.1
Pizza Hut New Zealand
2016 2017
Figure 8: Figure representing Pizza Hut New Zealand
(Source: As Created by Author)
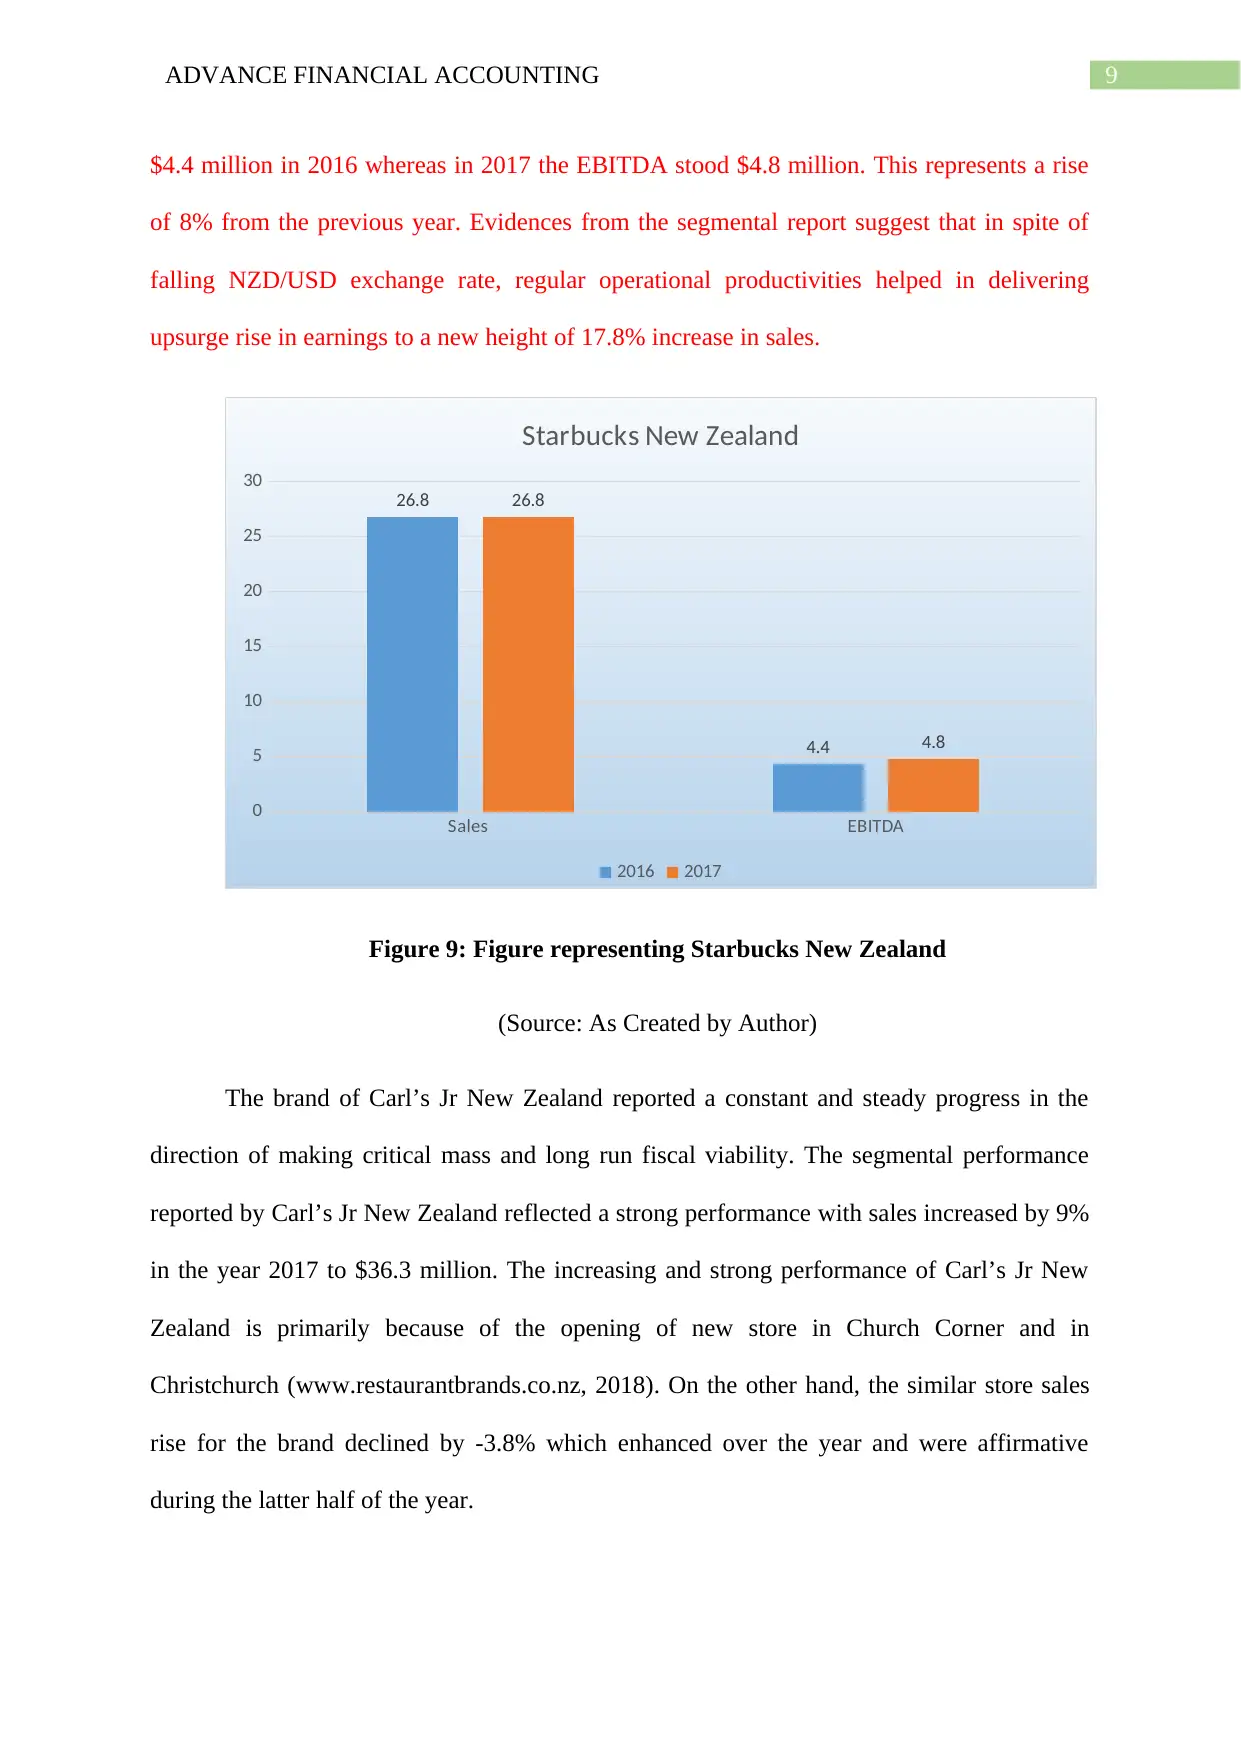
Taking into the considerations the Starbucks Coffee performance in New Zealand the
sales for the company during the year stood $26.8 million in 2016 that declined marginally to
$26.7 million. This reflects a fall by -0.4 million. The same store sales increased to healthy
4.5%. The fall in the sale is primarily due to the end of lease closure of the Aotea Square
store in Auckland (www.restaurantbrands.co.nz, 2018). The EBITDA for the company stood
The Pizza Hut New Zealand segment had witnessed the declining trend as the figures of the
sales have fallen by -9.8%. The total sales revenue for the year 2016 stood as low as 44.9
million reflecting a decline of -4.4 million. The major reason for the decline in the revenue is
the disposal of the stores to the independent franchises. Though the low sales have been
improved from the New Zealand sales segment as the figures stood 91.36 million an increase
of 6.4% from the previous reported sales. A comparative evaluation of the segment
performance of Pizza Hut stores reveals that New Zealand sales marginally fell down leading
to self-governing franchises EBITDA as low as $4.1 million lower than 0.8 million from the
previous year figure reported in 2016.
Sales EBITDA
0%
10%
20%
30%
40%
50%
60%
70%
80%
90%
100%
44.9 4.9
40.5 4.1
Pizza Hut New Zealand
2016 2017
Figure 8: Figure representing Pizza Hut New Zealand
(Source: As Created by Author)
Taking into the considerations the Starbucks Coffee performance in New Zealand the
sales for the company during the year stood $26.8 million in 2016 that declined marginally to
$26.7 million. This reflects a fall by -0.4 million. The same store sales increased to healthy
4.5%. The fall in the sale is primarily due to the end of lease closure of the Aotea Square
store in Auckland (www.restaurantbrands.co.nz, 2018). The EBITDA for the company stood
⊘ This is a preview!⊘
Do you want full access?
Subscribe today to unlock all pages.
Trusted by 1+ million students worldwide
9ADVANCE FINANCIAL ACCOUNTING
$4.4 million in 2016 whereas in 2017 the EBITDA stood $4.8 million. This represents a rise
of 8% from the previous year. Evidences from the segmental report suggest that in spite of
falling NZD/USD exchange rate, regular operational productivities helped in delivering
upsurge rise in earnings to a new height of 17.8% increase in sales.
Sales EBITDA
0
5
10
15
20
25
30
26.8
4.4
26.8
4.8
Starbucks New Zealand
2016 2017
Figure 9: Figure representing Starbucks New Zealand
(Source: As Created by Author)
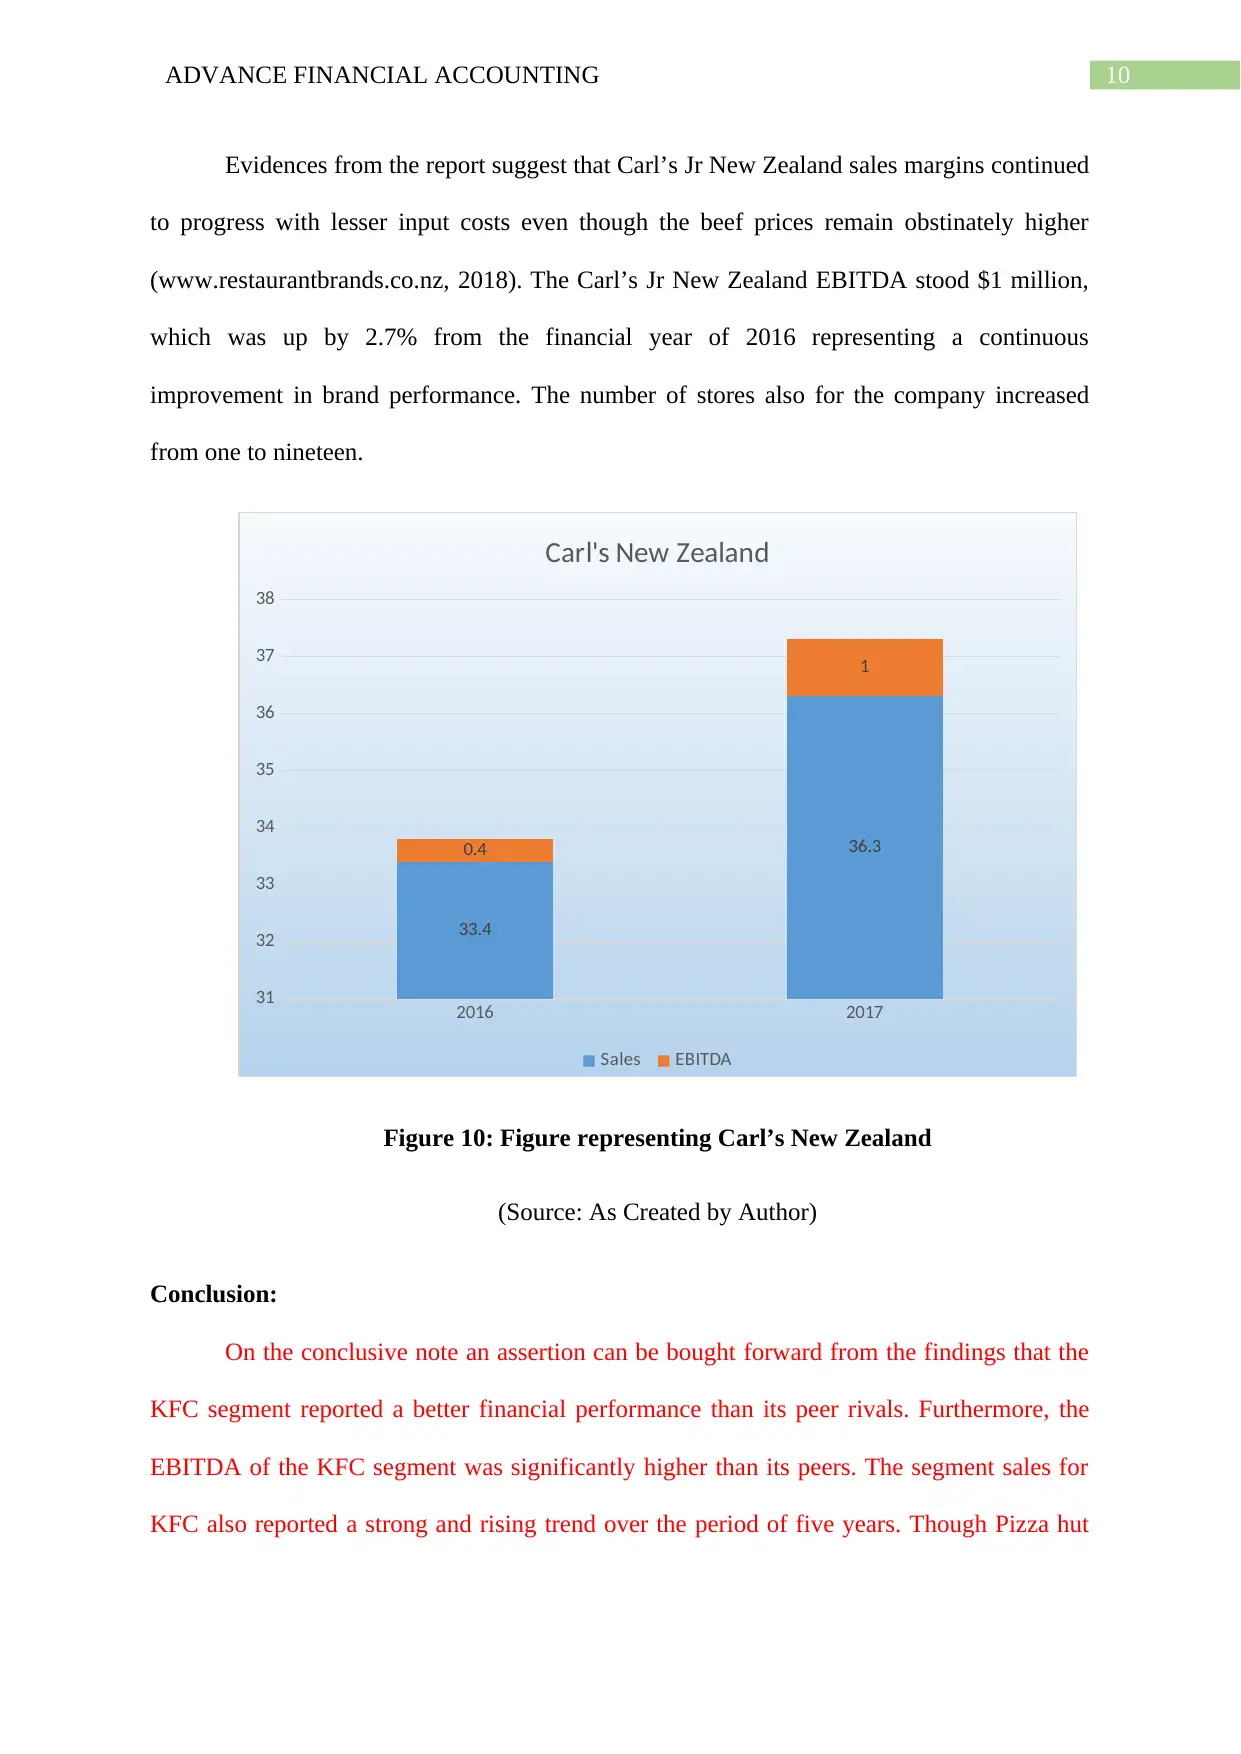
The brand of Carl’s Jr New Zealand reported a constant and steady progress in the
direction of making critical mass and long run fiscal viability. The segmental performance
reported by Carl’s Jr New Zealand reflected a strong performance with sales increased by 9%
in the year 2017 to $36.3 million. The increasing and strong performance of Carl’s Jr New
Zealand is primarily because of the opening of new store in Church Corner and in
Christchurch (www.restaurantbrands.co.nz, 2018). On the other hand, the similar store sales
rise for the brand declined by -3.8% which enhanced over the year and were affirmative
during the latter half of the year.
$4.4 million in 2016 whereas in 2017 the EBITDA stood $4.8 million. This represents a rise
of 8% from the previous year. Evidences from the segmental report suggest that in spite of
falling NZD/USD exchange rate, regular operational productivities helped in delivering
upsurge rise in earnings to a new height of 17.8% increase in sales.
Sales EBITDA
0
5
10
15
20
25
30
26.8
4.4
26.8
4.8
Starbucks New Zealand
2016 2017
Figure 9: Figure representing Starbucks New Zealand
(Source: As Created by Author)
The brand of Carl’s Jr New Zealand reported a constant and steady progress in the
direction of making critical mass and long run fiscal viability. The segmental performance
reported by Carl’s Jr New Zealand reflected a strong performance with sales increased by 9%
in the year 2017 to $36.3 million. The increasing and strong performance of Carl’s Jr New
Zealand is primarily because of the opening of new store in Church Corner and in
Christchurch (www.restaurantbrands.co.nz, 2018). On the other hand, the similar store sales
rise for the brand declined by -3.8% which enhanced over the year and were affirmative
during the latter half of the year.
Paraphrase This Document
Need a fresh take? Get an instant paraphrase of this document with our AI Paraphraser
10ADVANCE FINANCIAL ACCOUNTING
Evidences from the report suggest that Carl’s Jr New Zealand sales margins continued
to progress with lesser input costs even though the beef prices remain obstinately higher
(www.restaurantbrands.co.nz, 2018). The Carl’s Jr New Zealand EBITDA stood $1 million,
which was up by 2.7% from the financial year of 2016 representing a continuous
improvement in brand performance. The number of stores also for the company increased
from one to nineteen.
2016 2017
31
32
33
34
35
36
37
38
33.4
36.30.4
1
Carl's New Zealand
Sales EBITDA
Figure 10: Figure representing Carl’s New Zealand
(Source: As Created by Author)
Conclusion:
On the conclusive note an assertion can be bought forward from the findings that the
KFC segment reported a better financial performance than its peer rivals. Furthermore, the
EBITDA of the KFC segment was significantly higher than its peers. The segment sales for
KFC also reported a strong and rising trend over the period of five years. Though Pizza hut
11ADVANCE FINANCIAL ACCOUNTING
reported a higher return on assets during the last five financial years however the overall
segment performance in terms of profitability margin for KFC stood strong.
reported a higher return on assets during the last five financial years however the overall
segment performance in terms of profitability margin for KFC stood strong.
⊘ This is a preview!⊘
Do you want full access?
Subscribe today to unlock all pages.
Trusted by 1+ million students worldwide
1 out of 13
Your All-in-One AI-Powered Toolkit for Academic Success.
+13062052269
info@desklib.com
Available 24*7 on WhatsApp / Email
![[object Object]](/_next/static/media/star-bottom.7253800d.svg)
Unlock your academic potential
Copyright © 2020–2026 A2Z Services. All Rights Reserved. Developed and managed by ZUCOL.