Advance Financial Management: Portfolio Performance Analysis Report
VerifiedAdded on 2020/07/23
|14
|3456
|55
Report
AI Summary
This report provides a comprehensive analysis of portfolio performance, focusing on both technical and fundamental analysis approaches. The study investigates the effectiveness of different investment strategies, including those based on PE and PB ratios, and their impact on portfolio returns. The report examines the application of Dow theory and MACD indicators in technical analysis, as well as the use of PE and PB ratios in fundamental analysis. The results section compares the performance of portfolios constructed using these different methods, highlighting periods of outperformance and underperformance relative to market benchmarks. The analysis includes specific examples of investment decisions, such as the selection of specific stocks like Coresus, Centurion, and Boustead, and explains the rationale behind these choices. The report also discusses the influence of behavioral finance concepts and the efficient market hypothesis on investment decisions, offering insights into market efficiency and investor behavior.

ADVANCE FINANCIAL
MANAGEMENT
MANAGEMENT
Paraphrase This Document
Need a fresh take? Get an instant paraphrase of this document with our AI Paraphraser
TABLE OF CONTENTS
Introduction......................................................................................................................................1
Literature review..............................................................................................................................1
Rational and methodology...............................................................................................................1
Results and analysis.........................................................................................................................2
Figure 1Comparison chart of portfolios and index......................................................................2
Conclusion.......................................................................................................................................3
References........................................................................................................................................5
APPENDIX......................................................................................................................................6
Introduction
Investment is one of practice that is followed by each and every individual and corporate entity. Varied strategies that are developed in different time period by intellectual people are used by investors to make
gain on investment (Van Deventer, Imai and Mesler, 2013). In current report different approaches that are considered for preparing portfolio will be discussed and on basis of same portfolio is developed. On analysis of
performance of groups of stocks relative to index, underperformnace of portfolio is observed. However, in week 4, 9 and 11 portfolio that was developed by considering PE ratio and PB ratio beat market. In this regard
specific strategy was adopted which was very risky. Coresus PE ratio was 1.60 which was higher then average PE ratio of firms which is 1.24. Stock was overpriced and it was estimate that share price may further
plunged in nearby weeks. Thus, in order to take advantage of fast growth and positive sentiments of investors heavy invesment was made on Centurion. This, hunch prove correct and good amount of gain made on
investment in week 4 in fundamental analysis portfolio. In Week 7 we follow same strategy that we follow in earlier weeks. Moderate profit and less amount of loss was beared in shares of firm Boustead. Thus,
consistently confidence maintained on it, as fundamentals like technical analysis does not changed. This strategy deliever exceptional result in week 9 and profit of 5052 earned. Thus, it can be said that strategy of
focusing on specific shares by considering their profit generation potential lead to earning of good profit in these weeks.
Literature review
According to Borges, (2010) efficient market hypothesis is one of theory which state that it is impossible to beat market for portolio managers. Market is efficient and it accurately adjust accoriding to any news
that comes in market. Means that no one can make additional gains by taking advantage of positive news. Mentioned theory state that stocks always trade at theie fair price and never overvalued or undervalued. Thoery
is one of controvercial topic and in its support and opposition there are number of scholars. In many nations of the world it is observed that share price erode at fast rate when index decline. In such kind of situation it is
not possible that all firms that constitute index give poor performance in their business and due to this reason share price decline suddenly. From this point of view EMH seems failed.
Opposite to this Lee, Lee and Lee, (2010) practical application of EMH can be verified from the fact that whether index or market observed in bullish or bearish mode 98% stocks performance remain below
market. Thus, it is verified that investors can not additional gain on shares and can not beat market in terms of return gain on portfolio. It can be said that EMH apply but sometime conditions arise where its application
is questionable.
According to Camerer, Loewenstein and Rabin, (2011) behavioural finance is the new term which assume that emotions and thinking of individuals play vital role in formation of decisions. Behavioural finance
cover cognitive and behavioural theory. This theory believed that investors decisions are biased by overconfidence, conservatism and mental accounting etc. Just by viewing data and trends investors make decisions are
confident that they can beat market. By earning short term gain investor think that they beat market. Thus, consistently investor follow this strategy. It can be said that in this way investors challenge EMH theory and
prove it incorrect.
Contrary to this Baker, Singleton and Veit, (2011) state that by only viewing trends good amount of profit can not be gained on investment. This is because one can successfully apply strategy that is prepared as
reflect by behaviour finance concept in short term. In long term such kind of gain can not be made. This is because trends also keeps on changing consistently and strategy that is effective in single time can not prove
beneficial in other time. Thus, EMH proved and it reflect that investors can not beat market. There are number of investors that earn good amount of profit in long term because they keep an eye on market and
fundamental of stocks. If market is declining then investors start selling their investments because in that situation it is not possible to beat market. They consider fundamentals of stock and on that basis determine
whether to keep stock in portfolio. If yes then in what quantity units of specific company shares must be in portfolio is determined. Thus, in this EMH is followed by investors to earn profit or minimize loss when
market declined consistently.
Type of analysis
Rational and methodology
Specific approach was follow to select companies for portfolio. It must be noted that in report two portfolios are prepared namely technical analysis and fundamental analysis portfolio. In case of technical
analysis by using charts firms are taken in portfolio. Whereas, in fundamental analysis PE and PB ratios are considered. First of all chart of all 20 firms was prepared which are known as MACD ( Moving average
convergence divergence). Those firms whose MACD line was above signal line most of times are considerd for portfolio of technical analysis. Whereas, in case of fundamental analysis by taking in to account PE and
PB ratio firms are selected.
1 | P a g e
⊘ This is a preview!⊘
Do you want full access?
Subscribe today to unlock all pages.
Trusted by 1+ million students worldwide
Technical theories
Dow theory: Dow theory is followed in portfolio construction as this theory state that there are two sort of trends in case of stocks which are known as primary and secondary trend ( Brigham. and Ehrhardt,
2013). Primary trend may be for one year or more and it may be in bearish and bullish or mix trend. On other hand, secondary trend refers to correction phase under which usually share price plunged at fast rate
when it is in bullish mode but after reaching certain point share price erosion start which is second stage and by nearly around 30% or more share price decrease and after it again start moving upward ( Nisar.
and Hanif, 2012). This phase is known as correctiion phase. Mentioned theory is followed in the report and accordingly charts are interpreted. None of company is identified in correction stage or trend reversal.
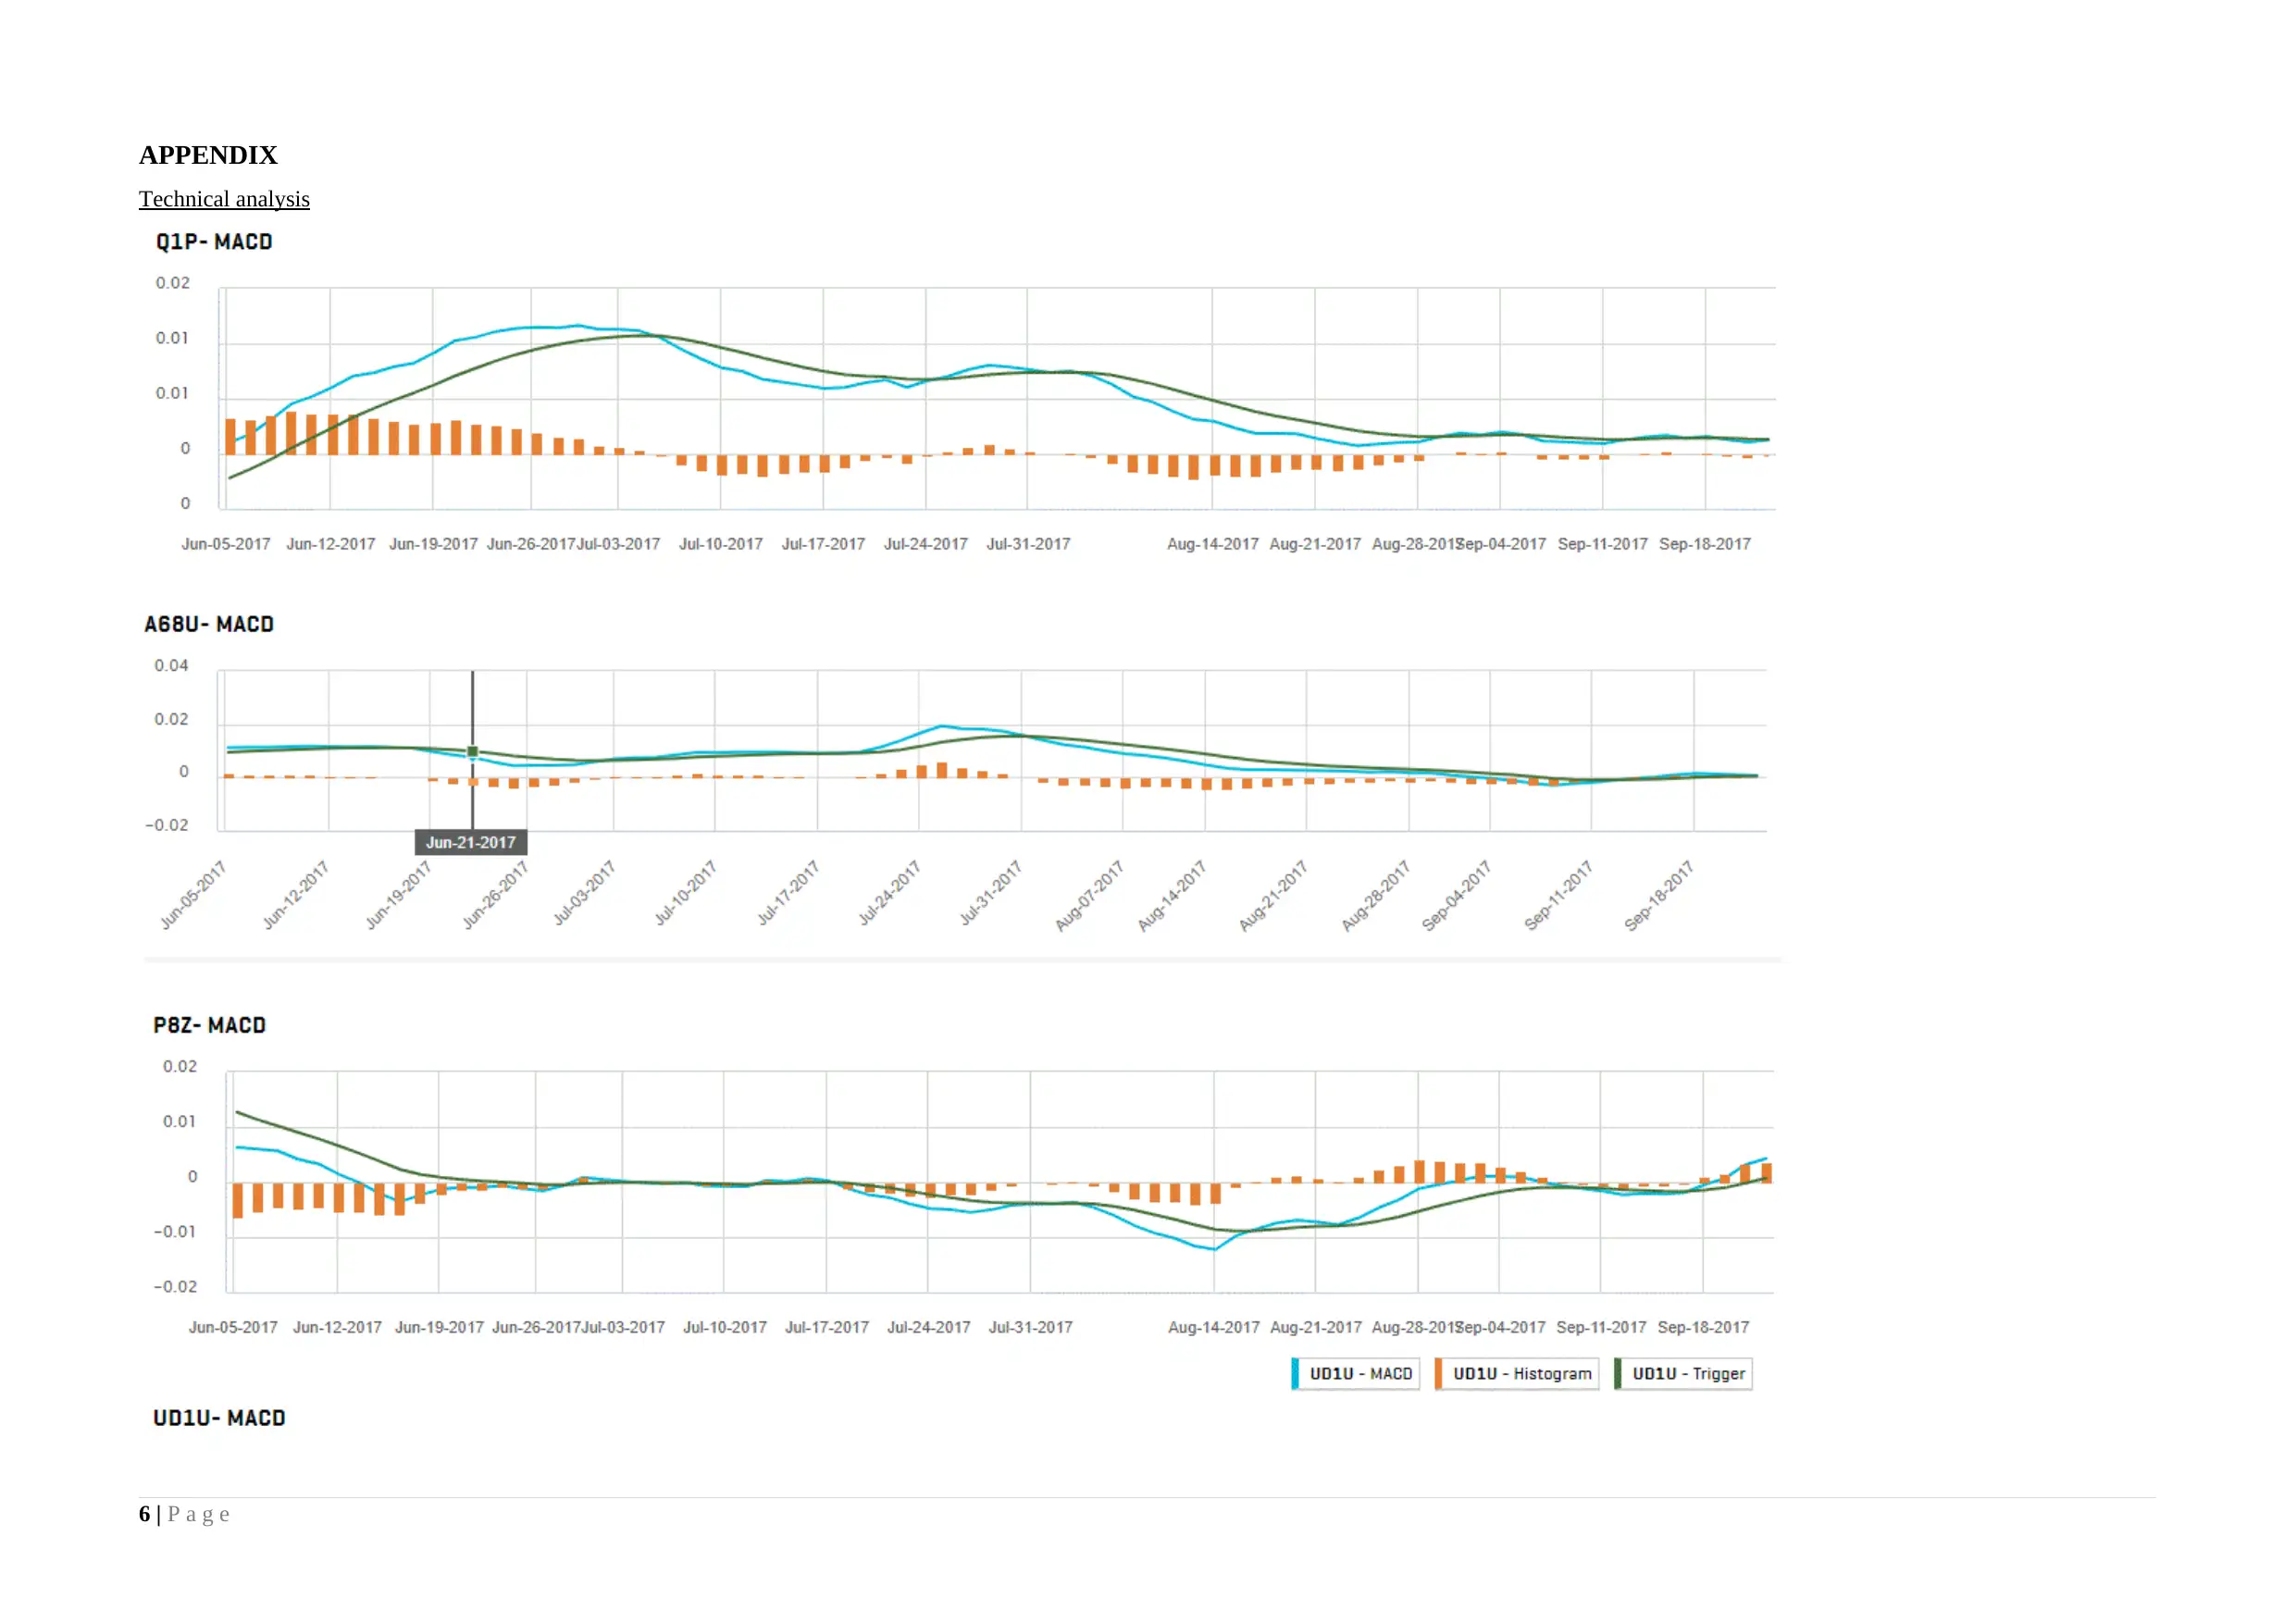
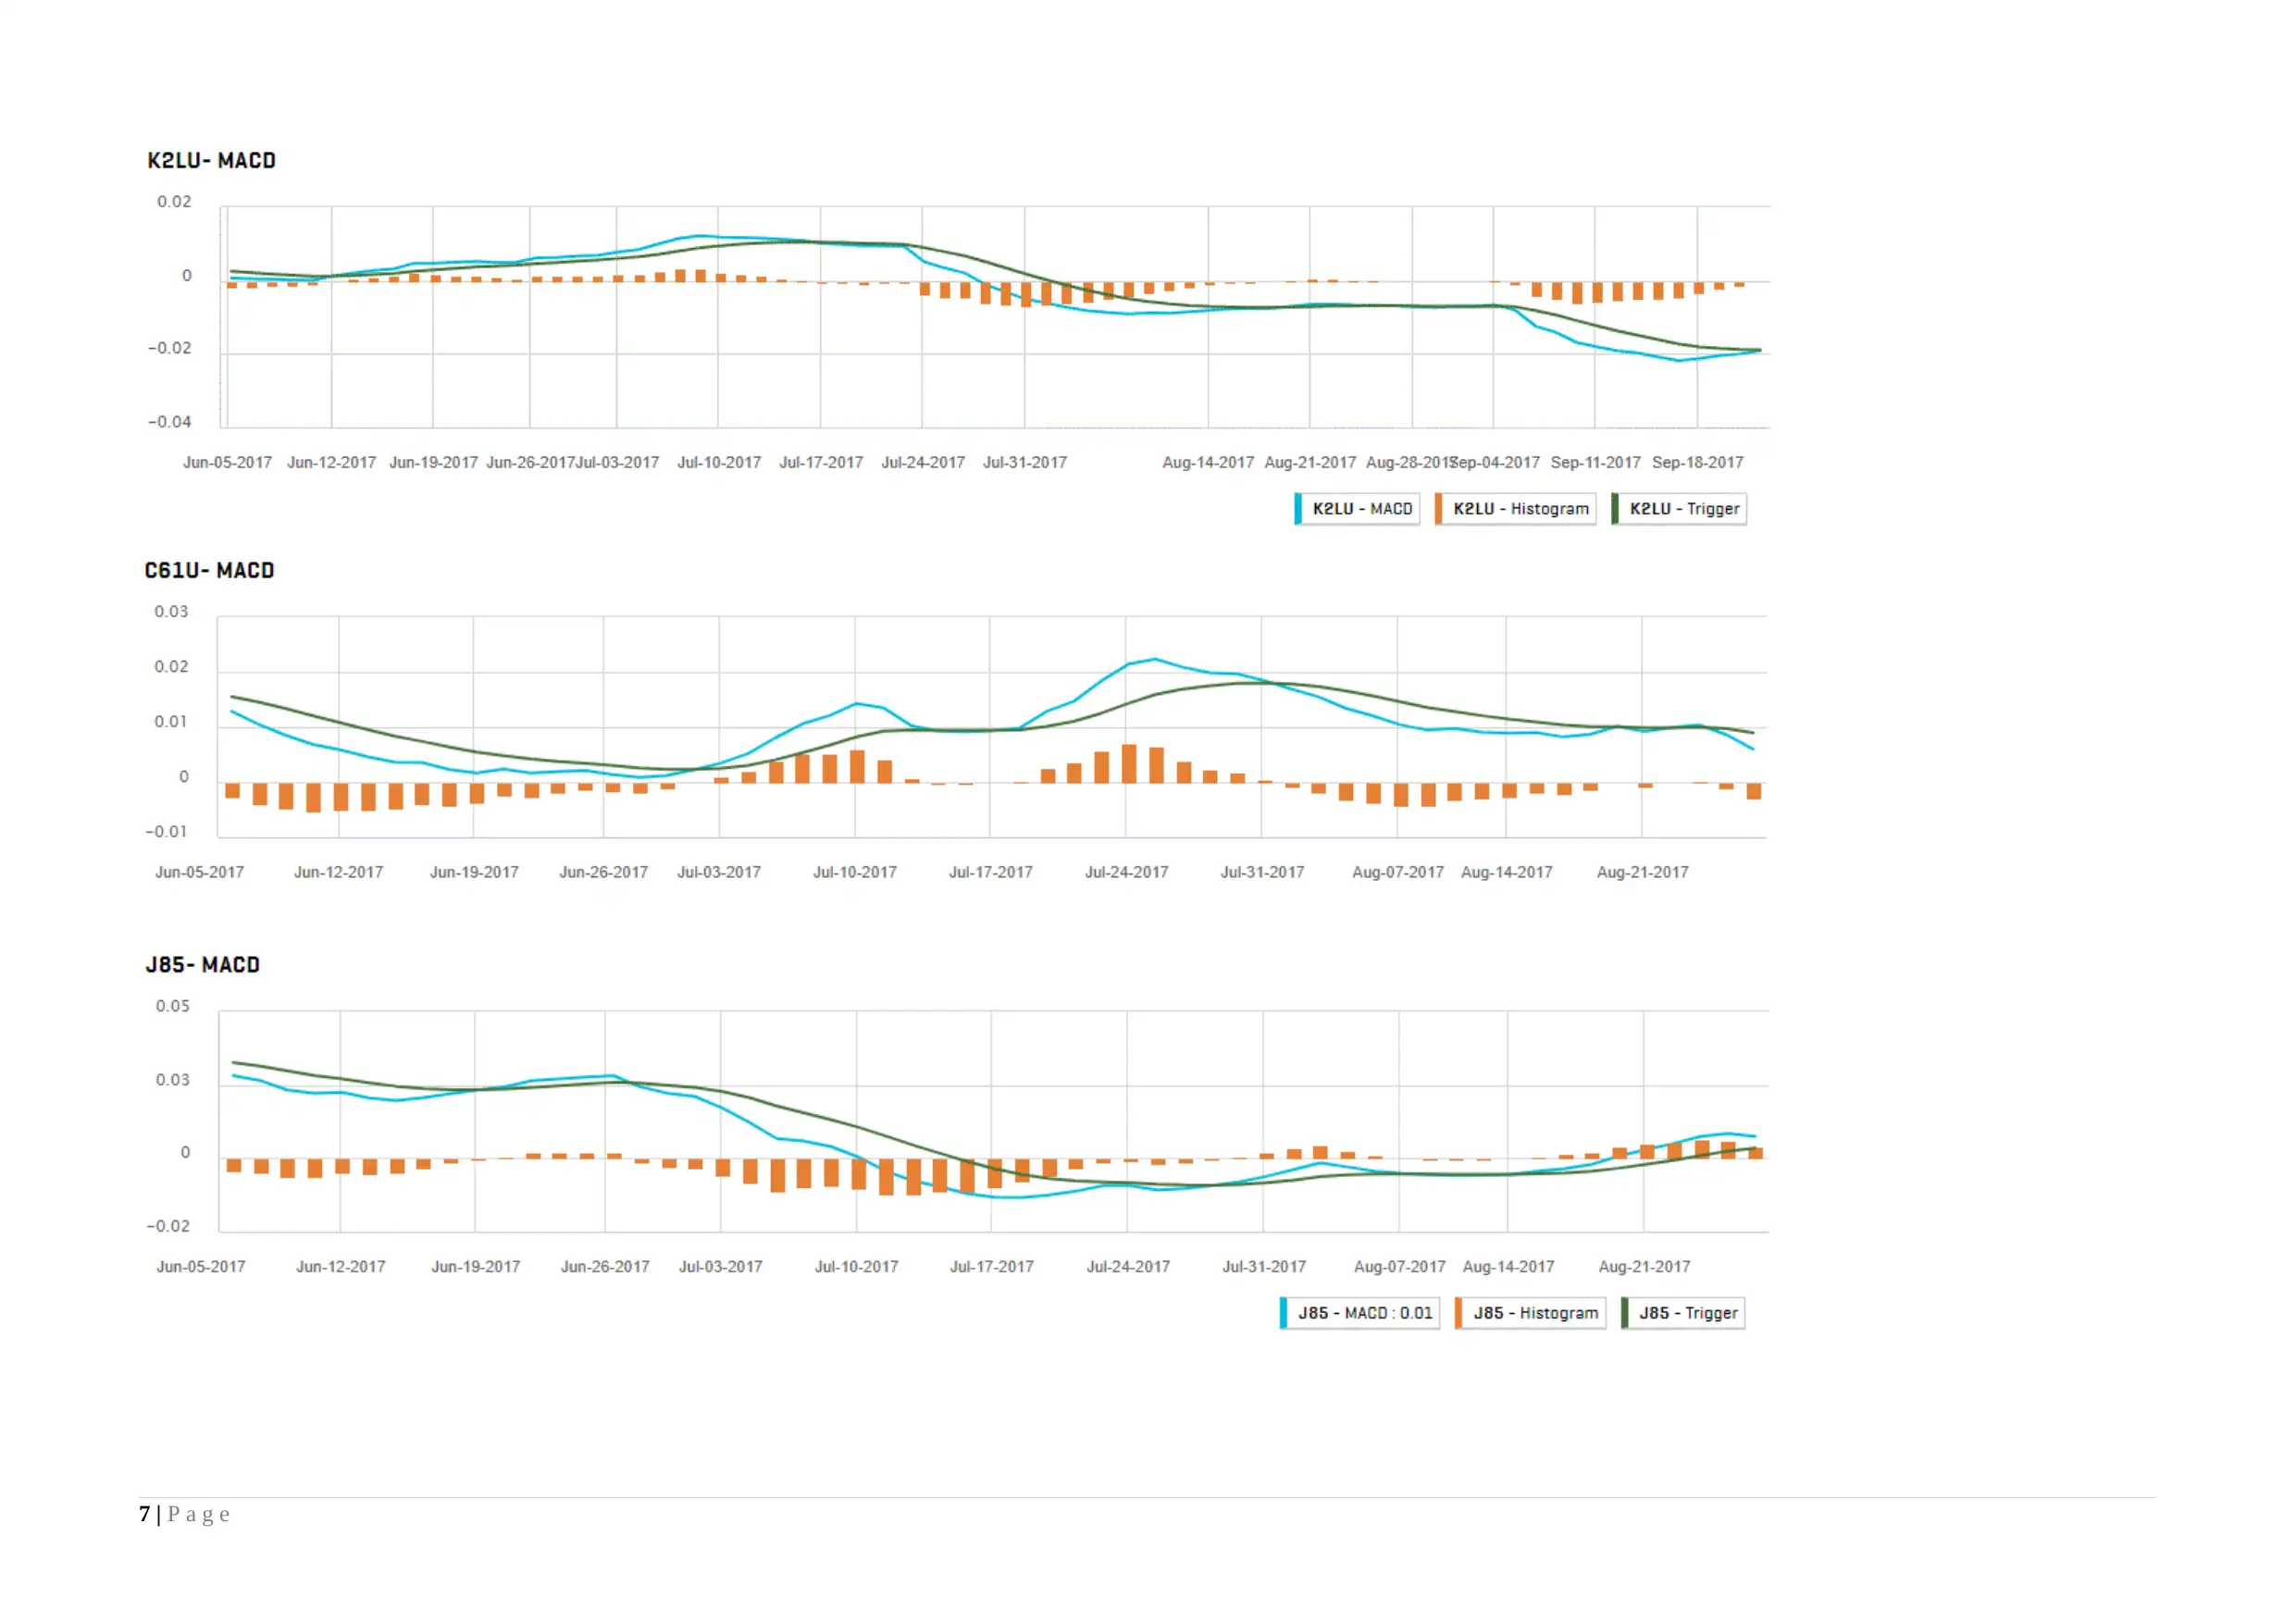
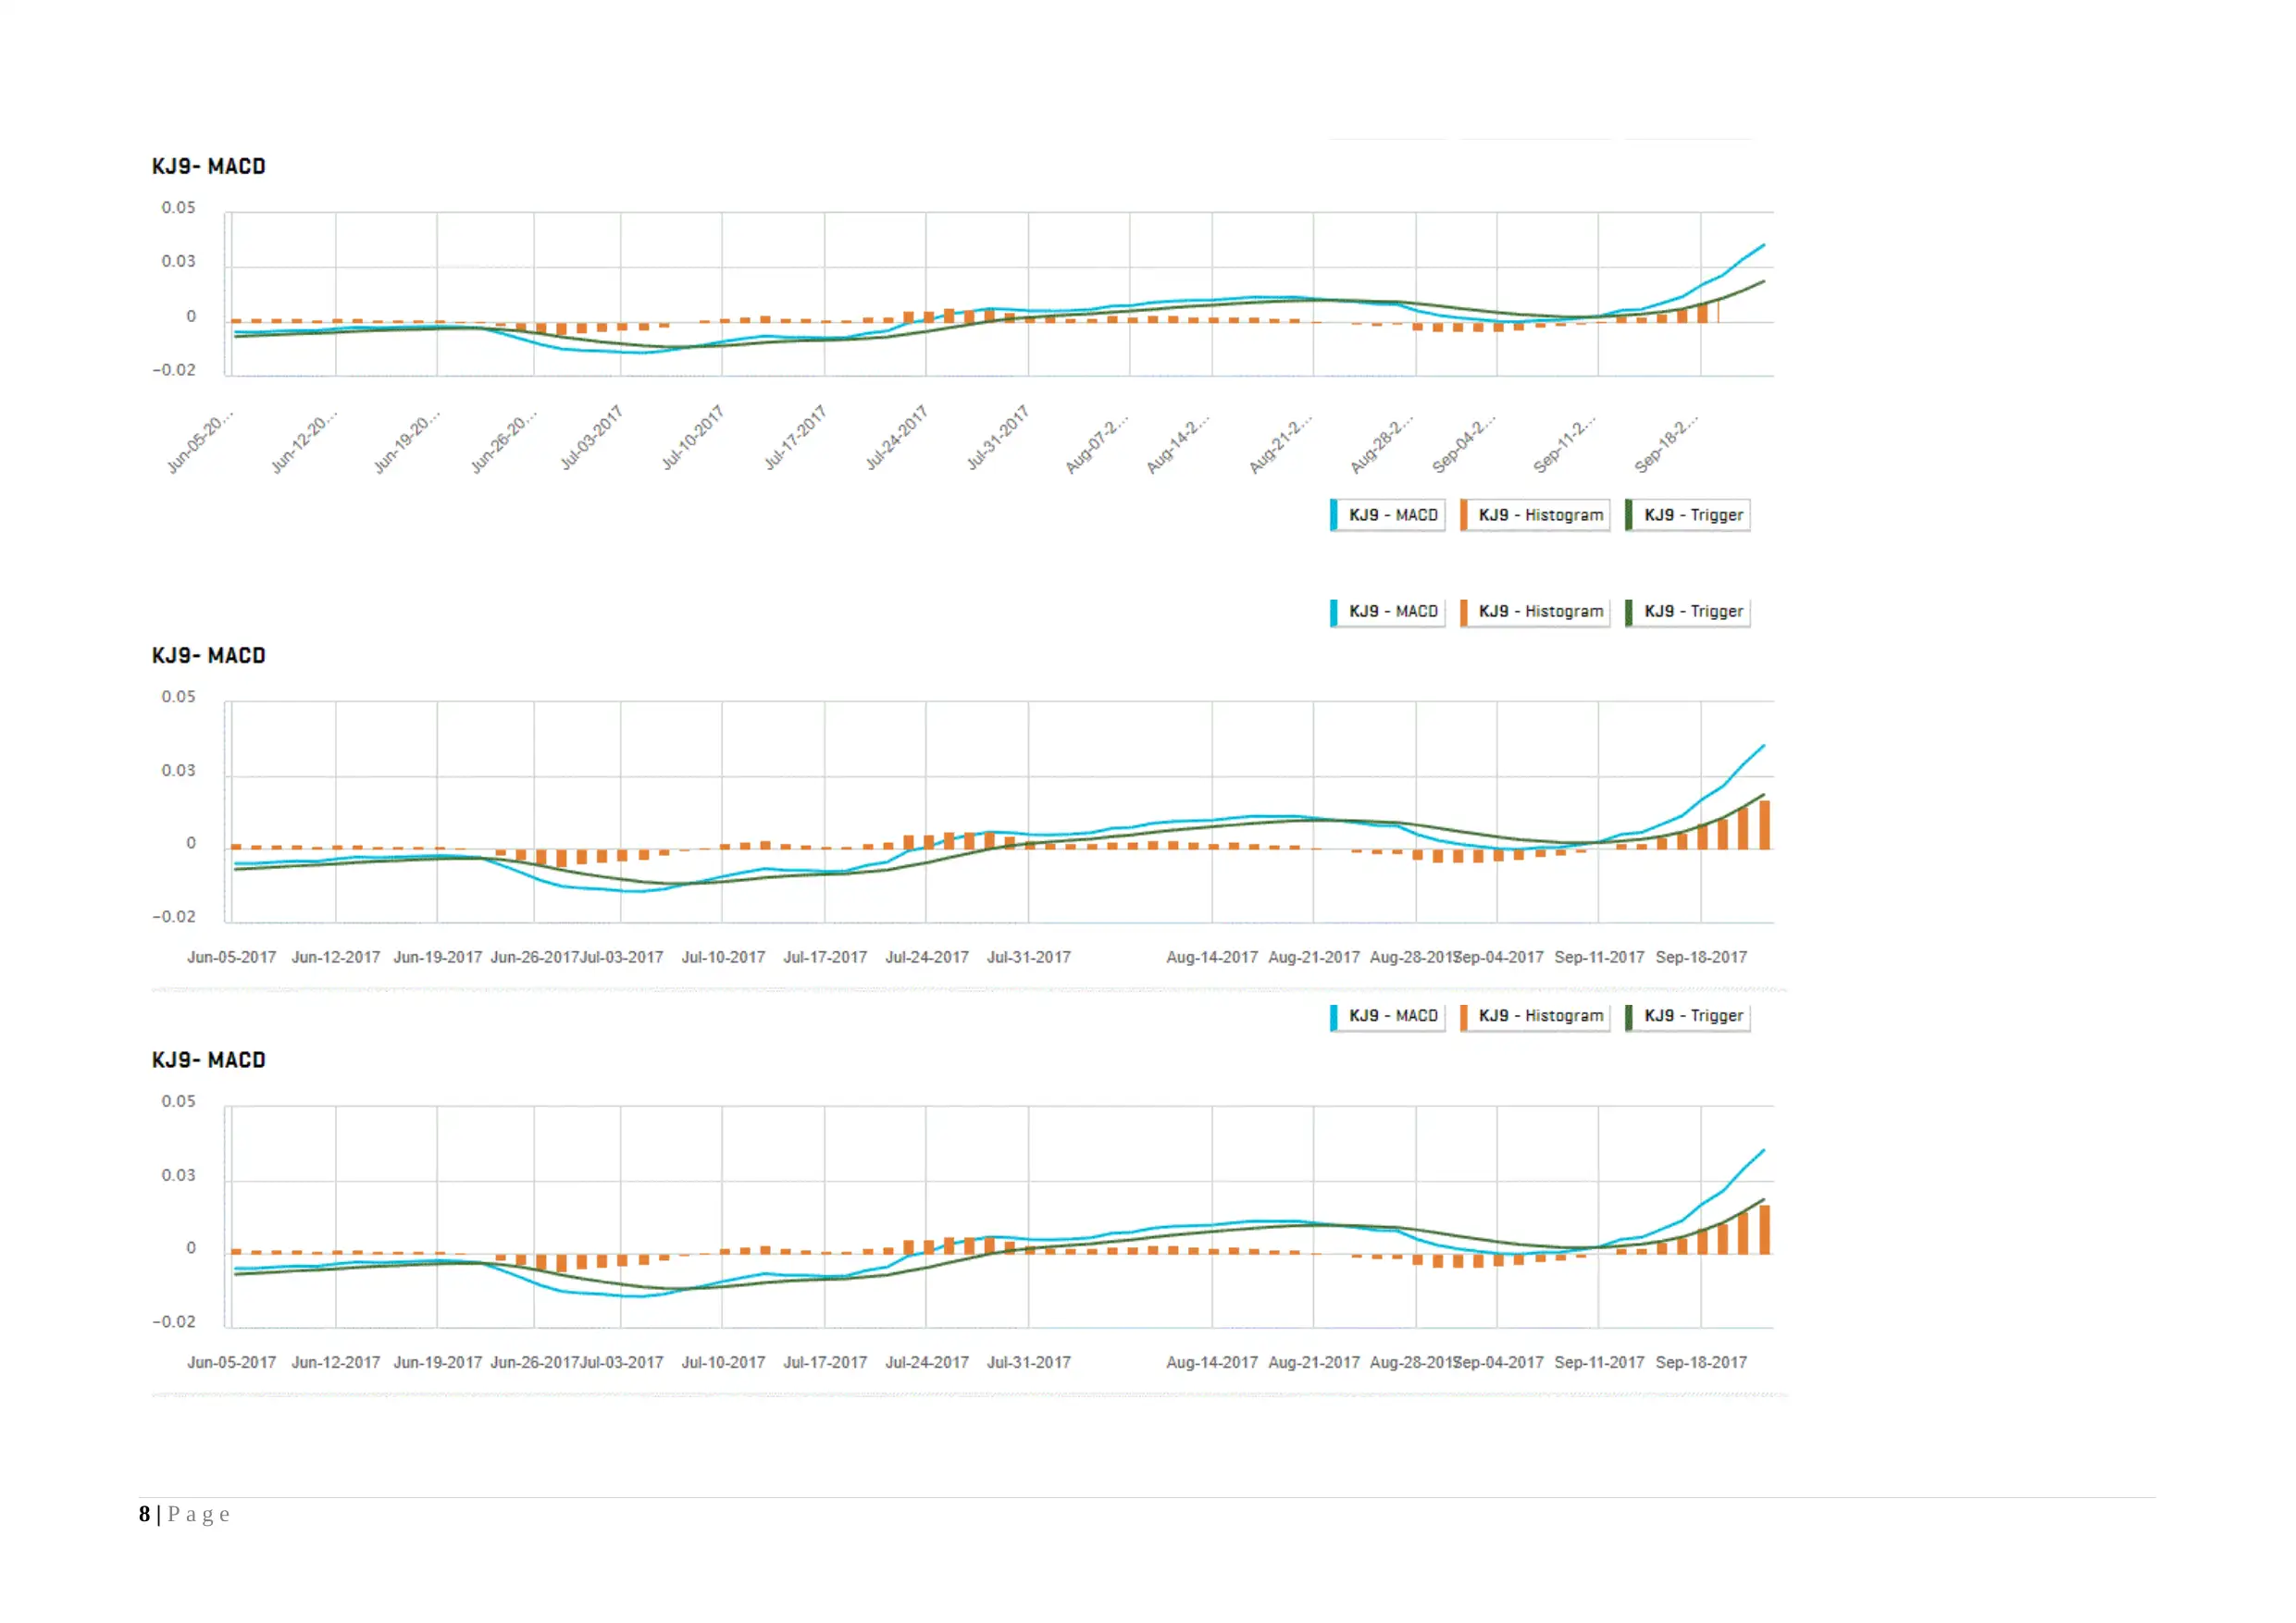
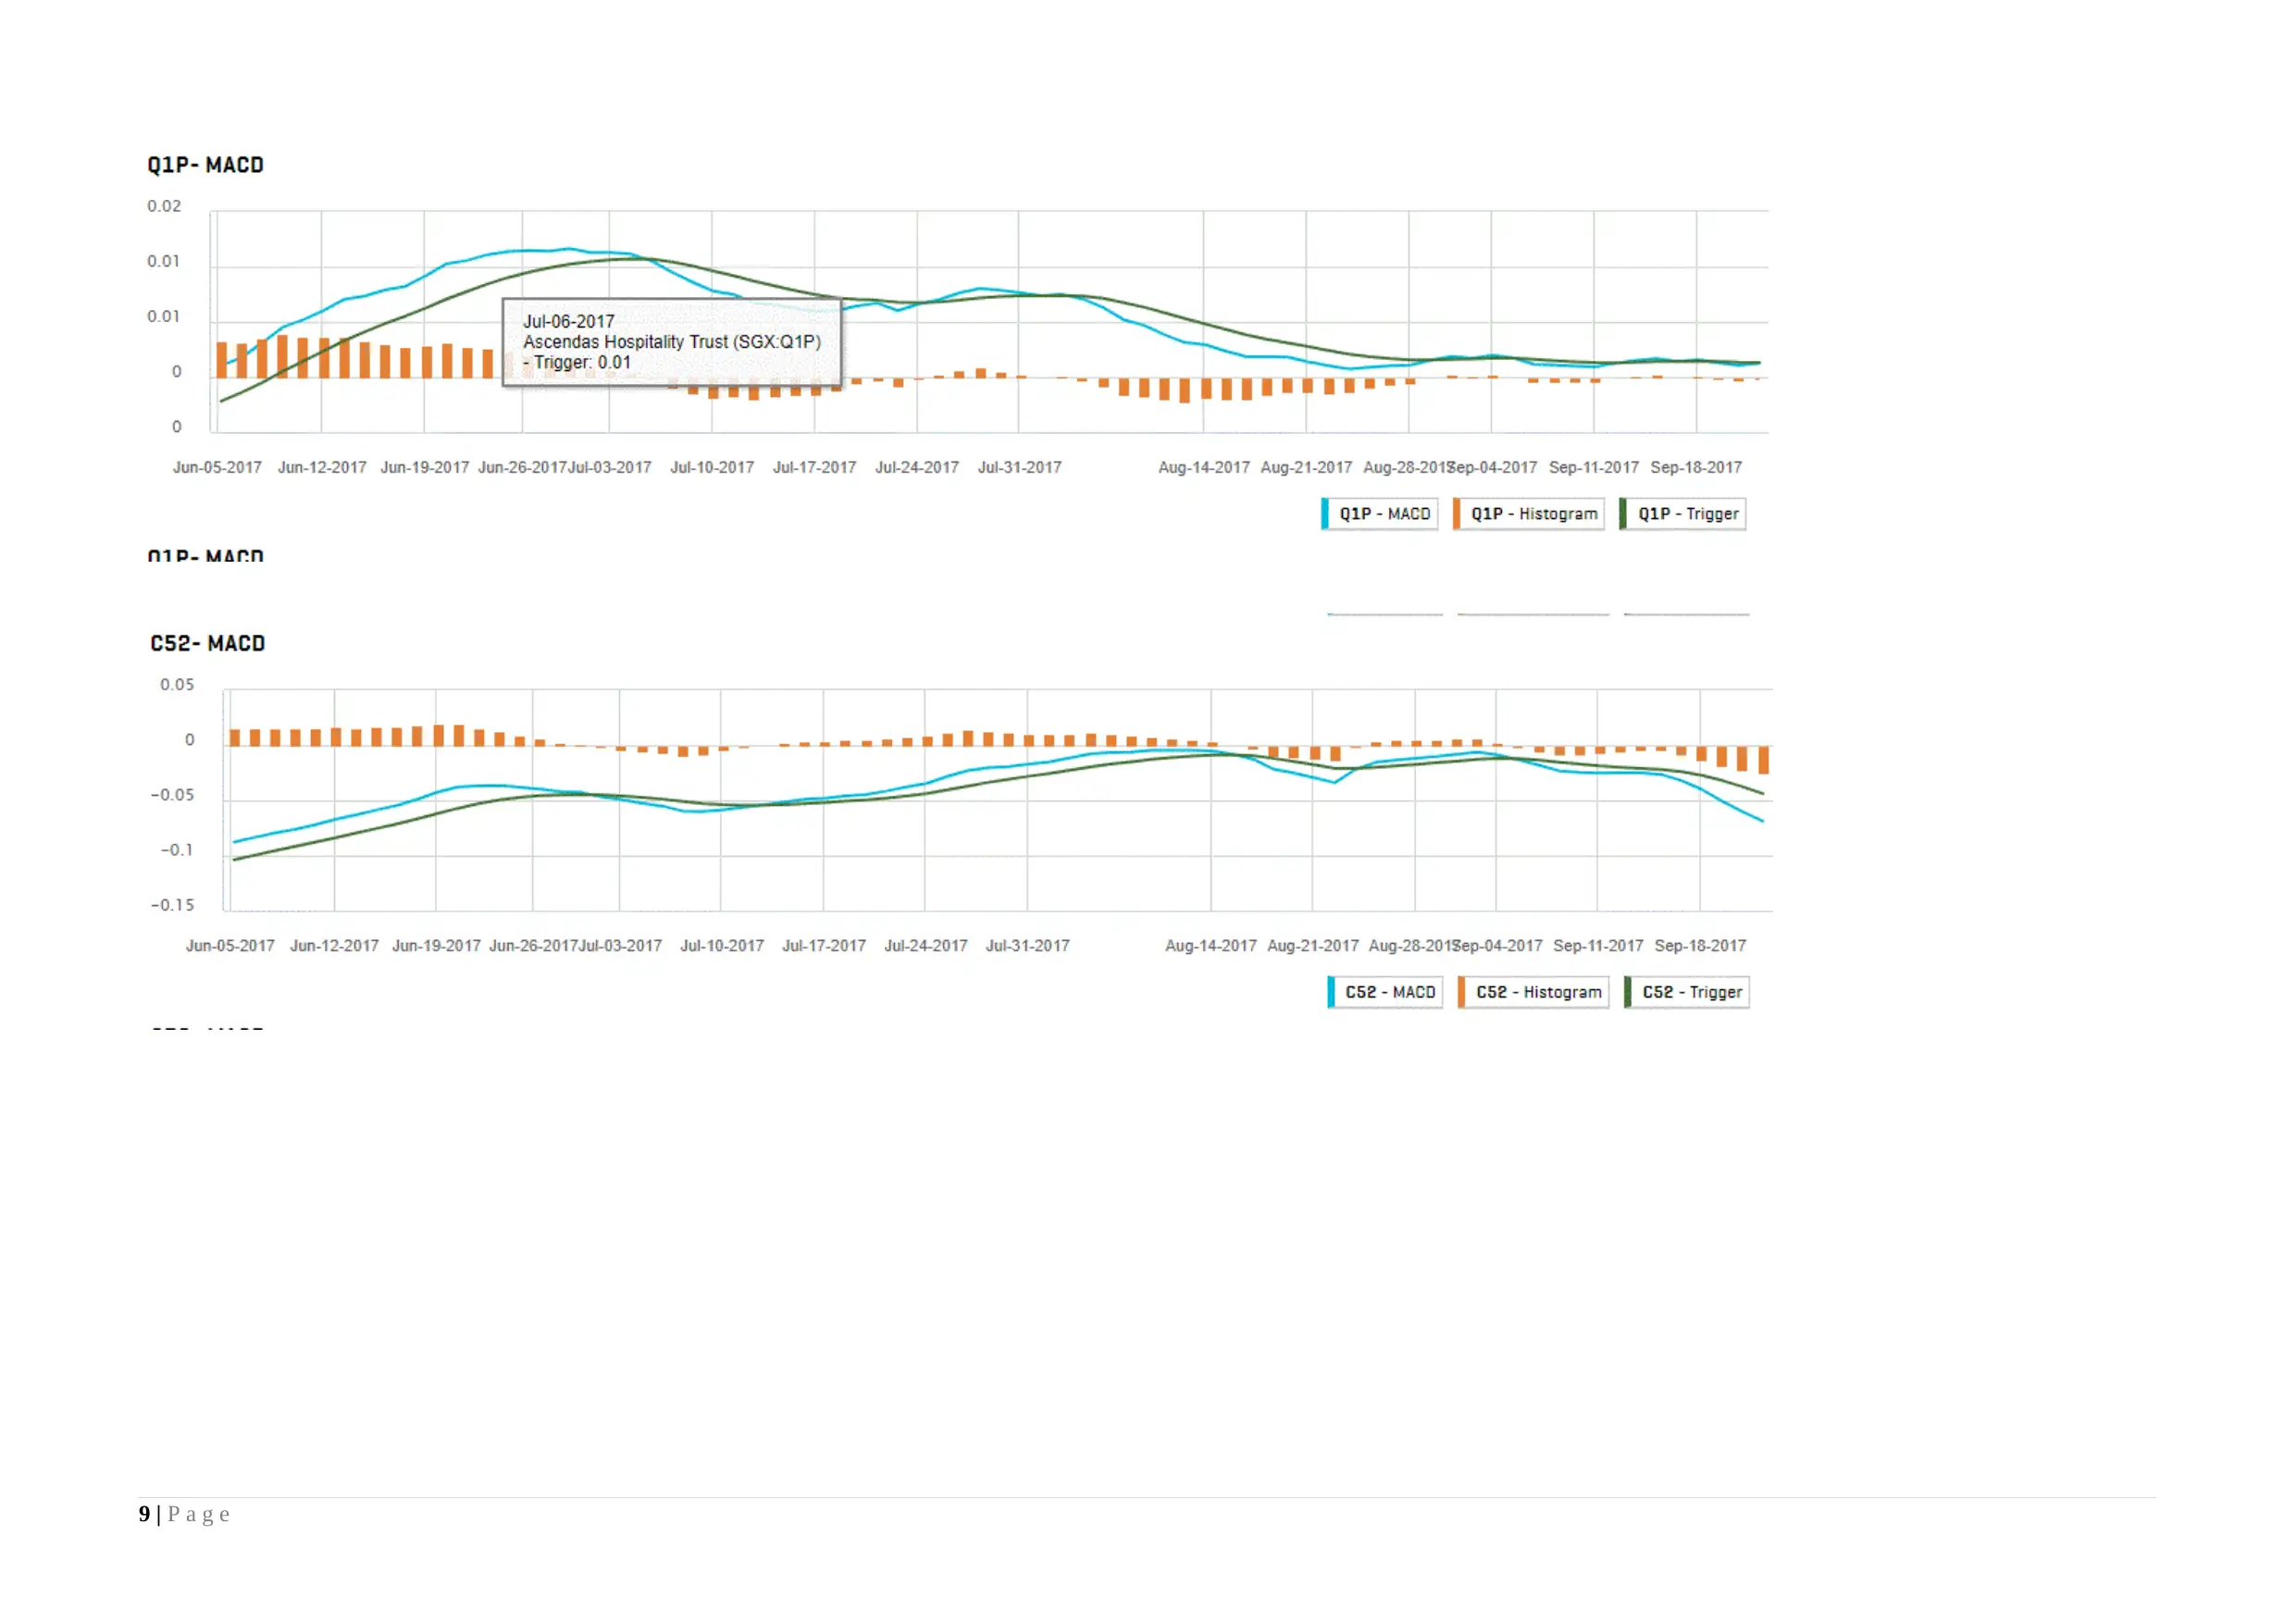
In this regard MACD and head and shoulder pattern charts are used. MACD reflect whether stock closing average price difference of 12 day and 24 day EMA is greater then 9 day moving average (MA) of this
price difference (DRURY, 2013). On this basis entry and exit time is identified. On basis of head and shoulder pattern is analyzed. Best buying opportunity is identified and in this way use of these methods is
justified in the report.
PE and PB ratio: PE ratio is the one of the most important concept which help investor in identifying whether shares are overvalued or undervalued. Usually industry PE ratio is used to identify whether shares
are overvalued. In this regard company PE ratio is compared with industry and on that basis valuation is done ( Price earnings ratio, 2017). Most often undervalued shares are purchased by investors. In current
report also PE ratio is used and under this instead of taking industry PE ratio average average PE by considering PE of all firms that are proposed to be taken in portfolio is computed. Each firm ratio is
compared with same of industry and on that basis firms are selected. In this way approach is justified. PB ratio of all stocks is low and due to this reason relevant firms are selected in the portfolio. Hence,
approach is justified.
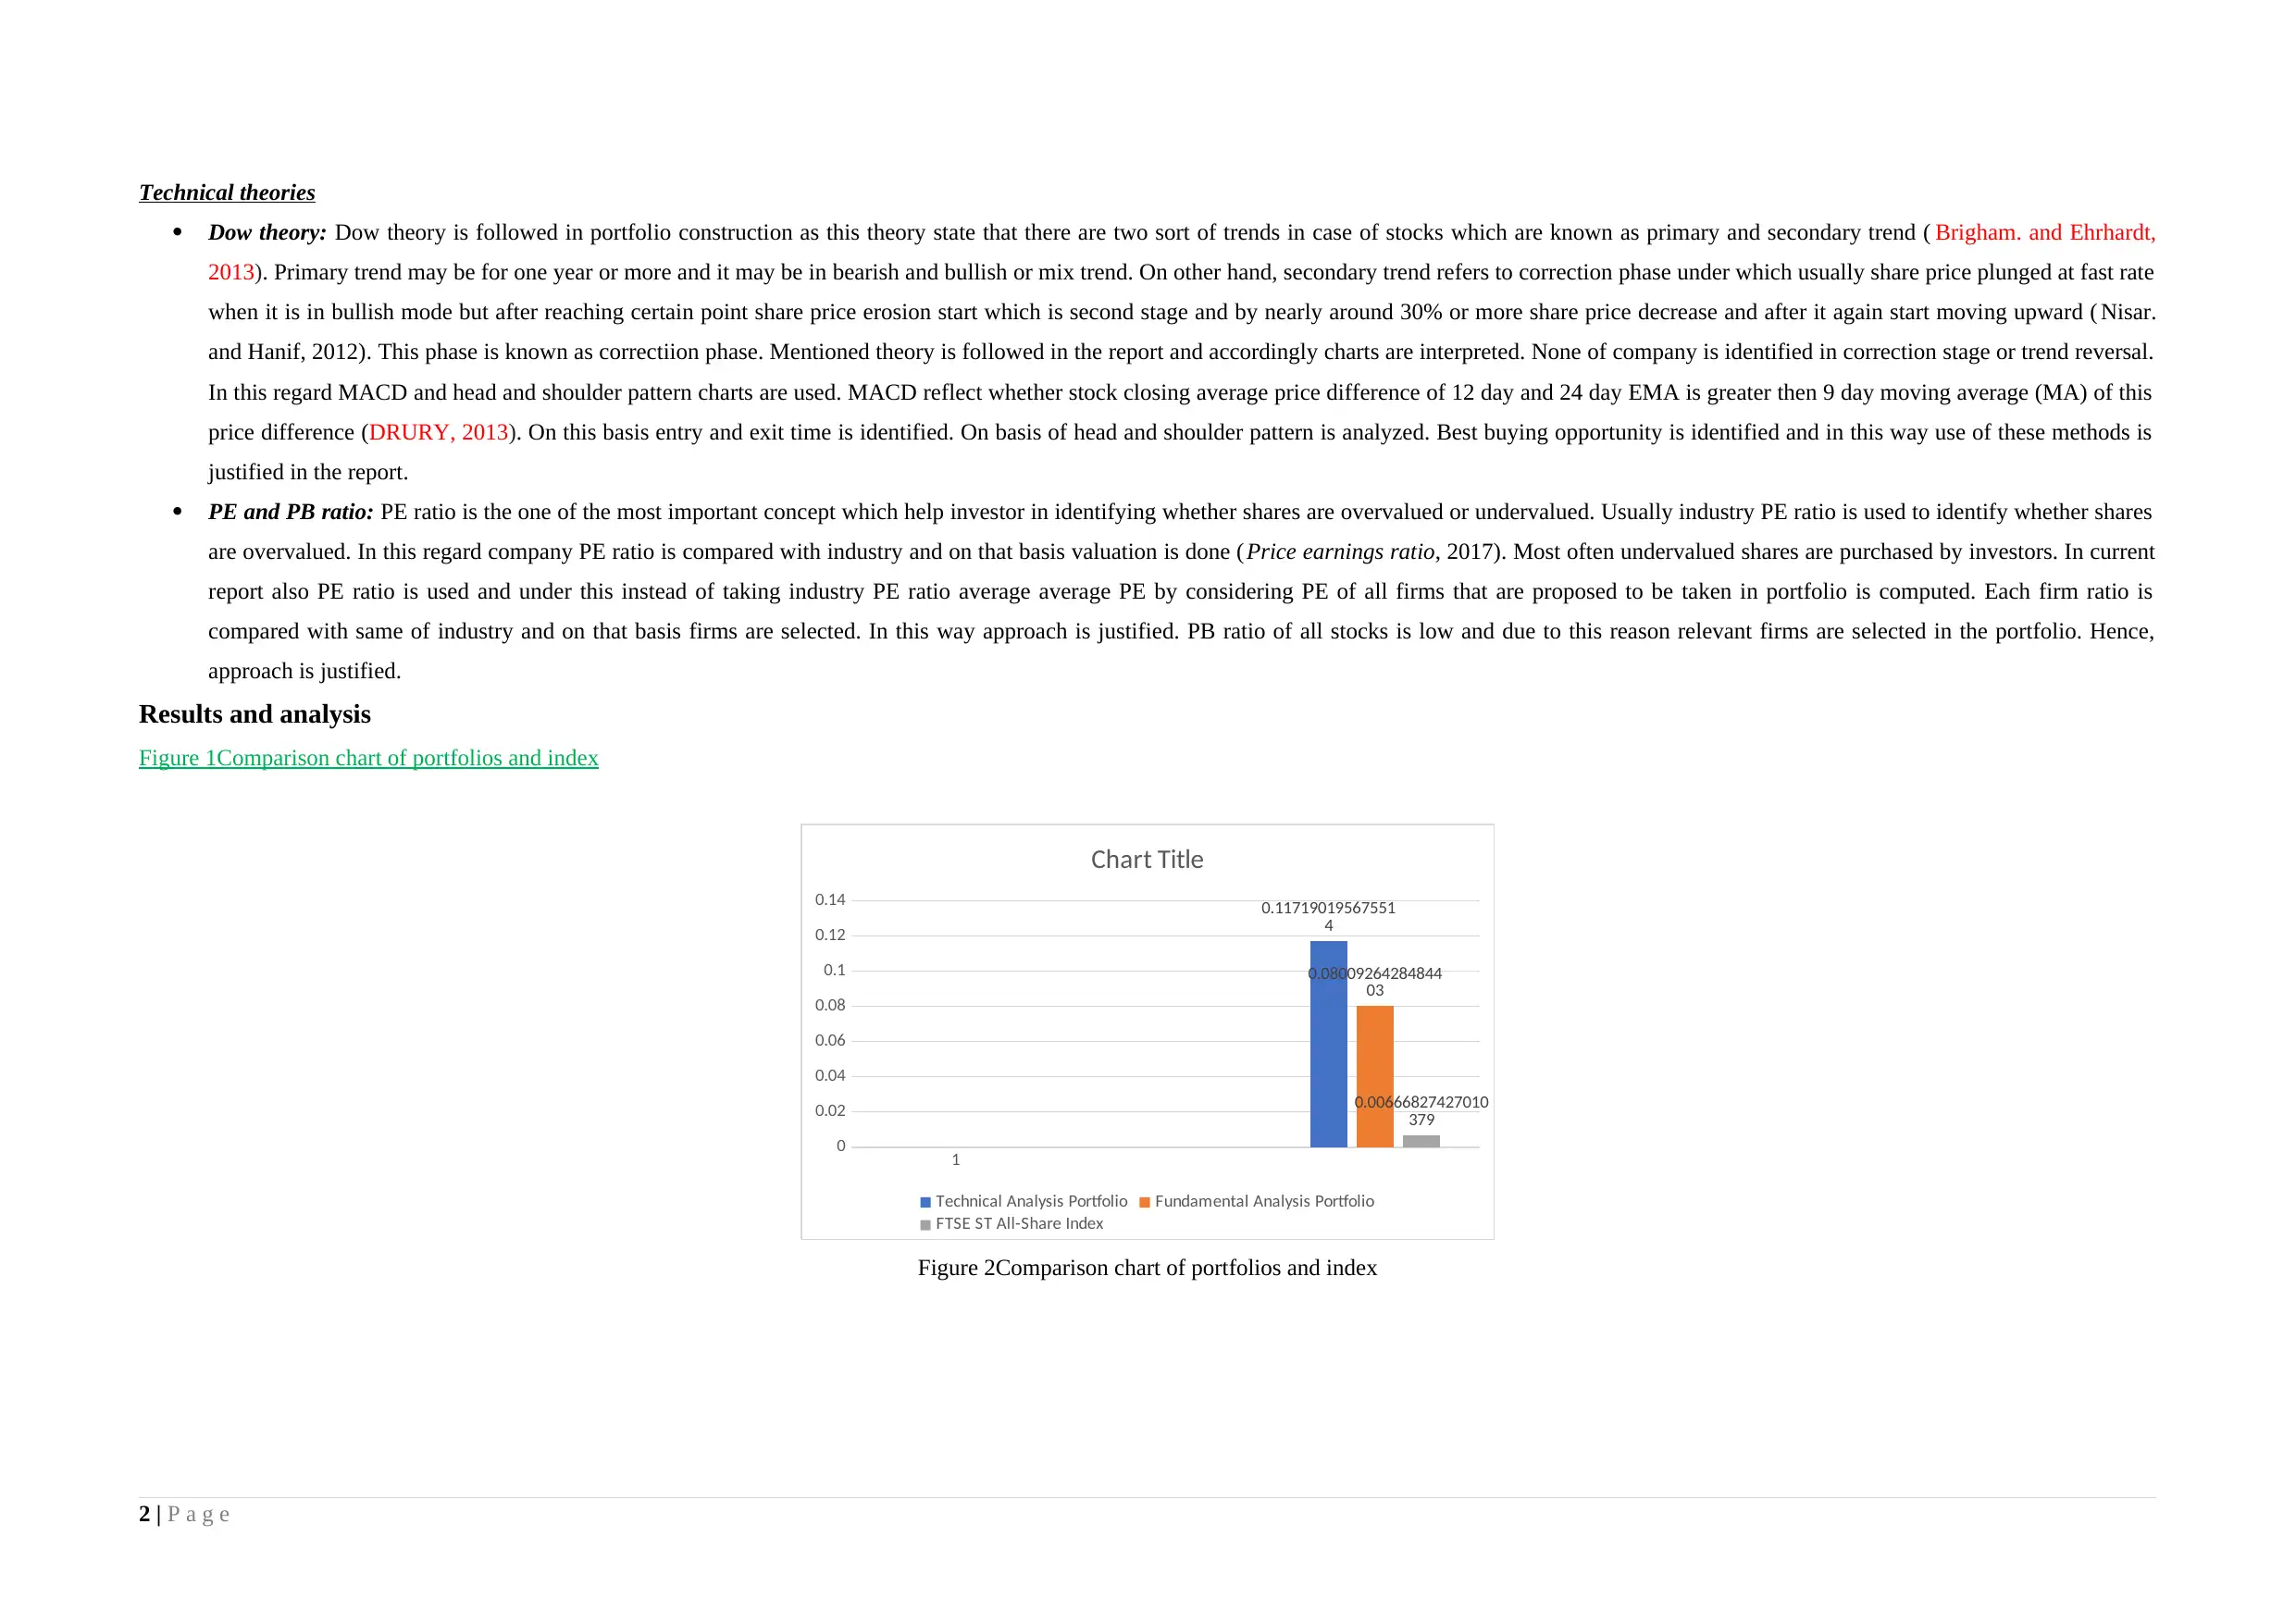
Results and analysis
Figure 1Comparison chart of portfolios and index
1
0
0.02
0.04
0.06
0.08
0.1
0.12
0.14 0.11719019567551
4
0.08009264284844
03
0.00666827427010
379
Chart Title
Technical Analysis Portfolio Fundamental Analysis Portfolio
FTSE ST All-Share Index
Figure 2Comparison chart of portfolios and index
2 | P a g e
Dow theory: Dow theory is followed in portfolio construction as this theory state that there are two sort of trends in case of stocks which are known as primary and secondary trend ( Brigham. and Ehrhardt,
2013). Primary trend may be for one year or more and it may be in bearish and bullish or mix trend. On other hand, secondary trend refers to correction phase under which usually share price plunged at fast rate
when it is in bullish mode but after reaching certain point share price erosion start which is second stage and by nearly around 30% or more share price decrease and after it again start moving upward ( Nisar.
and Hanif, 2012). This phase is known as correctiion phase. Mentioned theory is followed in the report and accordingly charts are interpreted. None of company is identified in correction stage or trend reversal.
In this regard MACD and head and shoulder pattern charts are used. MACD reflect whether stock closing average price difference of 12 day and 24 day EMA is greater then 9 day moving average (MA) of this
price difference (DRURY, 2013). On this basis entry and exit time is identified. On basis of head and shoulder pattern is analyzed. Best buying opportunity is identified and in this way use of these methods is
justified in the report.
PE and PB ratio: PE ratio is the one of the most important concept which help investor in identifying whether shares are overvalued or undervalued. Usually industry PE ratio is used to identify whether shares
are overvalued. In this regard company PE ratio is compared with industry and on that basis valuation is done ( Price earnings ratio, 2017). Most often undervalued shares are purchased by investors. In current
report also PE ratio is used and under this instead of taking industry PE ratio average average PE by considering PE of all firms that are proposed to be taken in portfolio is computed. Each firm ratio is
compared with same of industry and on that basis firms are selected. In this way approach is justified. PB ratio of all stocks is low and due to this reason relevant firms are selected in the portfolio. Hence,
approach is justified.
Results and analysis
Figure 1Comparison chart of portfolios and index
1
0
0.02
0.04
0.06
0.08
0.1
0.12
0.14 0.11719019567551
4
0.08009264284844
03
0.00666827427010
379
Chart Title
Technical Analysis Portfolio Fundamental Analysis Portfolio
FTSE ST All-Share Index
Figure 2Comparison chart of portfolios and index
2 | P a g e
Paraphrase This Document
Need a fresh take? Get an instant paraphrase of this document with our AI Paraphraser
On analysis of two portfolios it can be observed that there is not a very huge difference in values of portfolio that are prepared by using technical analysis and fundamental analysis. However, fluctuation is observed at
fast rate in case of both sort of portfolio. On comparison of both portfolio it can be observed that from week 2 to week 6 almost same trend in respect to increase and decrease in return is observed. After week 5 trend
get inversed to some extent in case of fundamental and technical analysis portfolio. It can be seen from image given above that uptrend and downtrend is much high in case of fundamental analysis portfolio then
technical analysis portfolio. This, means that if in specific weak profit is earned then its rate is high in fundamental analysis portfolio then other one vice verse. In other words it can be said that fundamental analysis
portfolio is much volatile then technical analysis portfolio. Perhaps, very few changes in the fundamental analysis portfolio is the one of main reason due to which fluctuation is observed. Opposite to this, by
considering trends time to time changes made in the technical analysis portfolio and due to this reason fluctuation is less.
Market is not outperformed in weeks but this trend is break in week 4,9 and 11. It can be said that these weeks were best from investment point of view. In Coresus huge investment was made in Jun month as
its PE ratio was higher then average and have relatively good PB ratio. It was expected that if index move up share may generate good return. Hunch prove correct and record gain made on mentioned firm shares. From
week 1 to 4 consistently appreciation observed in portfolio which was good. However, loss observed during same duration in technical analysis portfolio. From week 4 to week 6 fluctuation observed in both portfolios
in inverse direction and both underperform relative to index.
On comparison of both portfolio it can be said that till weak 6 both move in inverse direction and often remain underperformer. From week 7 to 12 again mostly portfolio remain underperformer and huge
fluctuation specially in fundamental analysis is observed. In week 9 huge gain made on Boustead and due to this reason suddently portfolio return rise at fast rate. Coresus was replacd by Cogent holding because heavy
loss observed in case of former one and opportunity was already capitalized. In week 6 in FAP Ascendas trust replaced by Capital and mall trust because already huge profit generated by former firm and there was
chances of decline in price because more investors may sale share to take advantage of profit making opportunity. Latter firm PE and PB ratio was high there was probability that market if will go up good amount of
profit can be gained. Thus, at this point of time investment made in relevant firm.
In week 3 investment made in Centurion and replace Hong Kong Land Holding because because heavy loss observed in latter firm. Again like above due to high PE and PB ratio investment made in Centurion
at that specific time so observed loss can be offset by gain made on mentioned firm. In week 3 investment is made in Coresus and 20,000 units were purchased. MACD was consistently above signal line. Consistently
line was moving upward which reflect that there is huge potential in mentioned firm. Capital and commercial trust replaced by Coresus because this week seem best from investment point of view (strong upward trend)
as it is first stage trend as per Dow theory and in former firm already moderate loss was observed. In case of Bumitama, Hong Kong Land Holding and other one investment made. This time investment made because
MACD was above signal line and upward trend was observed. This trend may remain continue as per Dow theory primary trend remain exist from few months to years. However, in case of China everbright share price
tublemed and was on correction phase as identified by considering Dow theory. On hope that correction will comes to end and thereafter good profit making opportunity will arise investment made in mentioned firm.
In week 8 investment made in Bumitama and Coresus because in case of former firm MACD and signal line were same and on past trends there were chances that MACD may move above signal line. Thus, at
this point as entry phase investment made in mentioend firm. In case of Coresus MACD was not above signal line but by considering past trend investment made in it but of small amount ( Dionne, 2013). This time is
selected for both investmement because on releavnt firms already good amount of gain was made and share price may decline further as investors may sell more shares to earn good amount of profit which would lead
to decline in share value and loss in portfolio. In week 9 Bumitama replaced by Indofood because huge loss faced in former firm and to manag profitability fesh investment made in latter firm.
Conclusion
On the basis of above discsussion it is concluded that portfolio almost remain underperformer then market index. However, if in portfolio specific stock have huge proportion and its price increase then investor
can beat market but this happened by chance. Every time this strategy can not be followed. Fundamental analysis is better then technical analysis because in single time one obtain information about company. Whereas,
in technical analysis on daily basis trend get changed and investor make irratiional decisions (behavioural finance) to outperform market. Investor believe in firm fundamentals and keep investment constantly and earn
profit on same and does not try to beat market (EMH). Thus, good amount of profit is gained on fundamental portfolio then technical analysis portfolio.
3 | P a g e

4 | P a g e
⊘ This is a preview!⊘
Do you want full access?
Subscribe today to unlock all pages.
Trusted by 1+ million students worldwide
References
Books and Journals
Baker, Singleton and Veit, 2011. Survey research in corporate finance: bridging the gap between theory and practice. Oxford University Press.
Borges, M.R., 2010. Efficient market hypothesis in European stock markets. The European Journal of Finance. 16(7). pp.711-726.
Brigham, E.F. and Ehrhardt, M.C., 2013. Financial management: Theory & practice. Cengage Learning.
Camerer, C.F., Loewenstein, G. and Rabin, M. eds., 2011. Advances in behavioral economics. Princeton University Press.
Dionne, G., 2013. Risk management: History, definition, and critique. Risk Management and Insurance Review, 16(2), pp.147-166.
DRURY, C.M., 2013. Management and cost accounting. Springer.
Lee, C.C., Lee, J.D. and Lee, C.C., 2010. Stock prices and the efficient market hypothesis: Evidence from a panel stationary test with structural breaks. Japan and the world economy. 22(1). pp.49-58.
Nisar, S. and Hanif, M., 2012. Testing weak form of efficient market hypothesis: Empirical evidence from South-Asia. World Applied Sciences Journal. 17(4). pp.414-427.
Price earnings ratio, 2017. [Online]. Available through:< http://www.myaccountingcourse.com/financial-ratios/price-earnings-ratio>. [Accessed on 28th August 2017].
Van Deventer, D.R., Imai, K. and Mesler, M., 2013. Advanced financial risk management: tools and techniques for integrated credit risk and interest rate risk management. John Wiley & Sons.
5 | P a g e
Paraphrase This Document
Need a fresh take? Get an instant paraphrase of this document with our AI Paraphraser
APPENDIX
Technical analysis
6 | P a g e
Technical analysis
6 | P a g e
7 | P a g e
⊘ This is a preview!⊘
Do you want full access?
Subscribe today to unlock all pages.
Trusted by 1+ million students worldwide
8 | P a g e
Paraphrase This Document
Need a fresh take? Get an instant paraphrase of this document with our AI Paraphraser
9 | P a g e
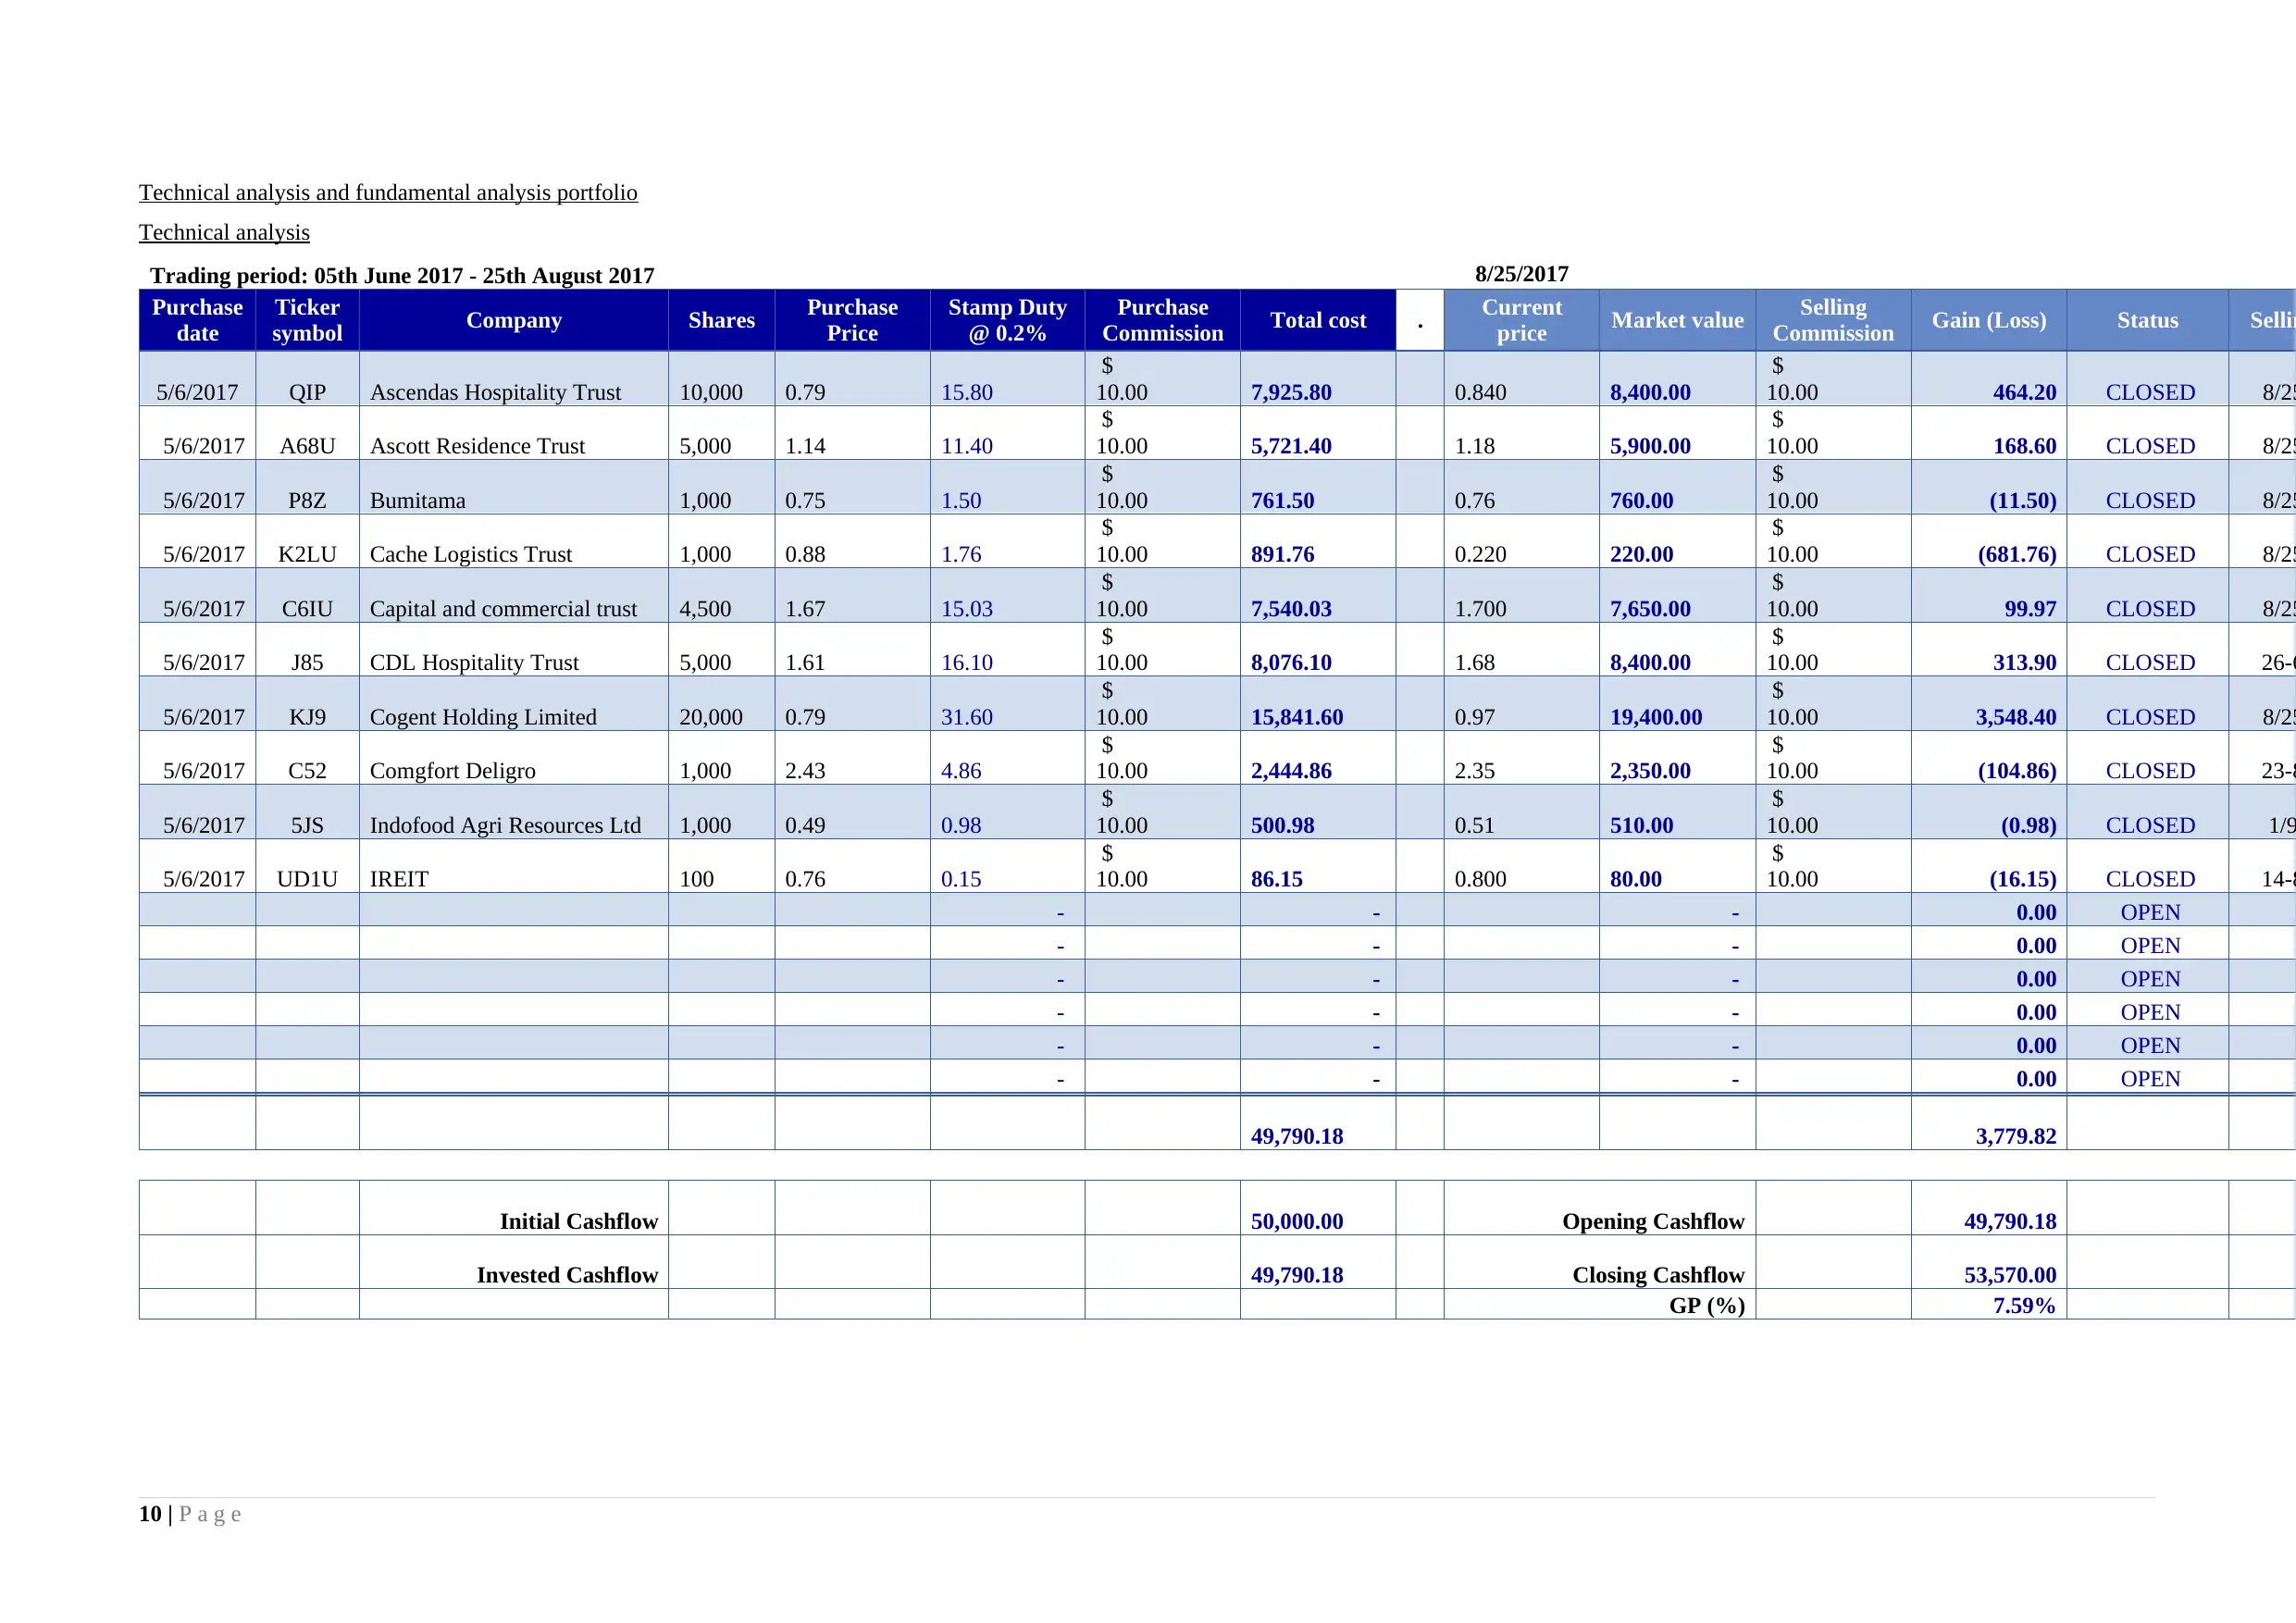
Technical analysis and fundamental analysis portfolio
Technical analysis
Trading period: 05th June 2017 - 25th August 2017 8/25/2017
Purchase
date
Ticker
symbol Company Shares Purchase
Price
Stamp Duty
@ 0.2%
Purchase
Commission Total cost . Current
price Market value Selling
Commission Gain (Loss) Status Sellin
5/6/2017 QIP Ascendas Hospitality Trust 10,000 0.79 15.80
$
10.00 7,925.80 0.840 8,400.00
$
10.00 464.20 CLOSED 8/25
5/6/2017 A68U Ascott Residence Trust 5,000 1.14 11.40
$
10.00 5,721.40 1.18 5,900.00
$
10.00 168.60 CLOSED 8/25
5/6/2017 P8Z Bumitama 1,000 0.75 1.50
$
10.00 761.50 0.76 760.00
$
10.00 (11.50) CLOSED 8/25
5/6/2017 K2LU Cache Logistics Trust 1,000 0.88 1.76
$
10.00 891.76 0.220 220.00
$
10.00 (681.76) CLOSED 8/25
5/6/2017 C6IU Capital and commercial trust 4,500 1.67 15.03
$
10.00 7,540.03 1.700 7,650.00
$
10.00 99.97 CLOSED 8/25
5/6/2017 J85 CDL Hospitality Trust 5,000 1.61 16.10
$
10.00 8,076.10 1.68 8,400.00
$
10.00 313.90 CLOSED 26-6
5/6/2017 KJ9 Cogent Holding Limited 20,000 0.79 31.60
$
10.00 15,841.60 0.97 19,400.00
$
10.00 3,548.40 CLOSED 8/25
5/6/2017 C52 Comgfort Deligro 1,000 2.43 4.86
$
10.00 2,444.86 2.35 2,350.00
$
10.00 (104.86) CLOSED 23-8
5/6/2017 5JS Indofood Agri Resources Ltd 1,000 0.49 0.98
$
10.00 500.98 0.51 510.00
$
10.00 (0.98) CLOSED 1/9
5/6/2017 UD1U IREIT 100 0.76 0.15
$
10.00 86.15 0.800 80.00
$
10.00 (16.15) CLOSED 14-8
- - - 0.00 OPEN
- - - 0.00 OPEN
- - - 0.00 OPEN
- - - 0.00 OPEN
- - - 0.00 OPEN
- - - 0.00 OPEN
49,790.18 3,779.82
Initial Cashflow 50,000.00 Opening Cashflow 49,790.18
Invested Cashflow 49,790.18 Closing Cashflow 53,570.00
GP (%) 7.59%
10 | P a g e
⊘ This is a preview!⊘
Do you want full access?
Subscribe today to unlock all pages.
Trusted by 1+ million students worldwide
1 out of 14
Related Documents


Your All-in-One AI-Powered Toolkit for Academic Success.
+13062052269
info@desklib.com
Available 24*7 on WhatsApp / Email
![[object Object]](/_next/static/media/star-bottom.7253800d.svg)
Unlock your academic potential
Copyright © 2020–2025 A2Z Services. All Rights Reserved. Developed and managed by ZUCOL.