Advanced Health Informatics: Patient Outcomes and Staffing Report

Verified

Added on  2022/09/13

|4
|416
|21
Report
AI Summary
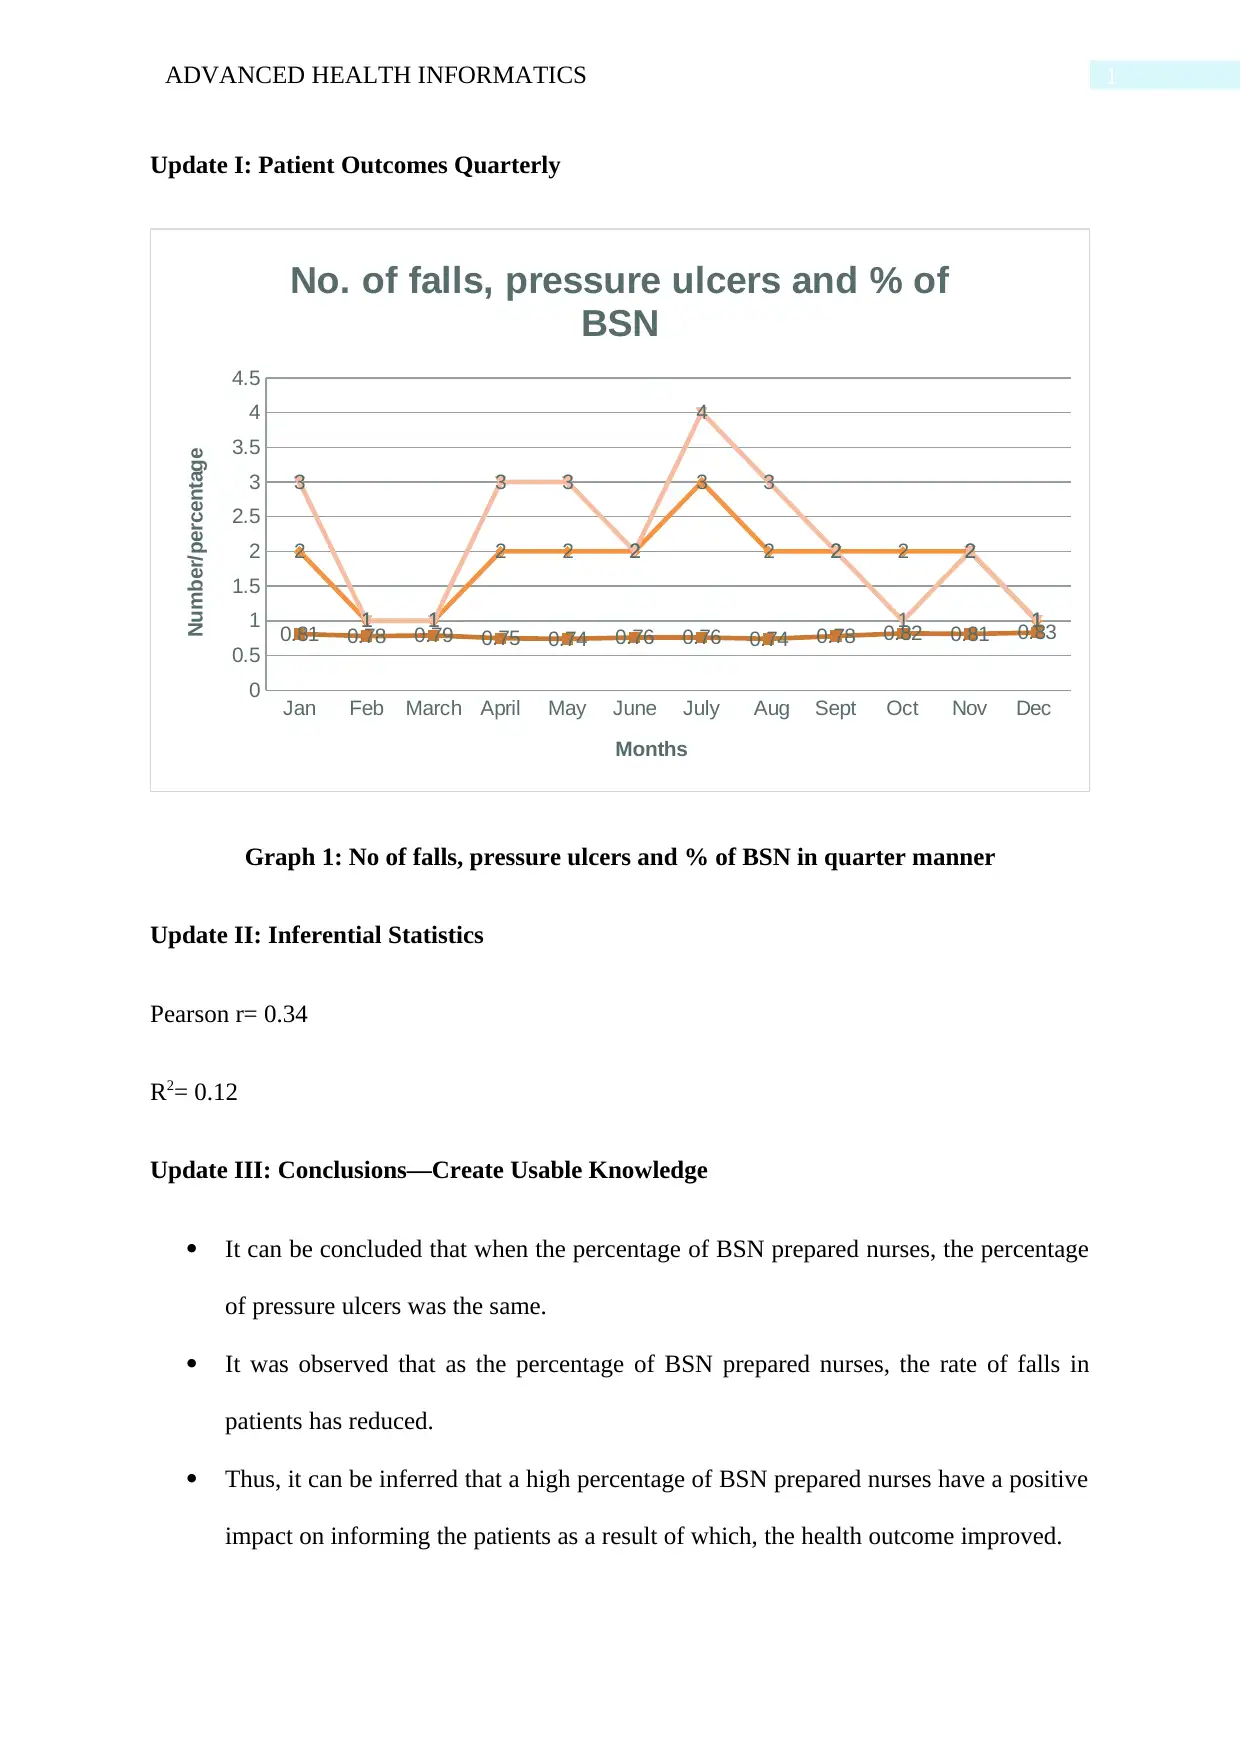
This report, titled 'Advanced Health Informatics,' presents an analysis of patient outcomes in relation to staffing levels, specifically focusing on the impact of BSN-prepared nurses. The report includes two updates: the first update organizes patient outcome data quarterly, using a run chart to visualize trends in falls, pressure ulcers, and the percentage of BSN-prepared nurses. The second update delves into inferential statistics, utilizing a scatter diagram and Pearson's correlation to assess the relationship between the number of BSN-prepared nurses and patient outcome scores. The findings suggest a positive correlation, indicating that a higher percentage of BSN-prepared nurses is associated with improved patient outcomes, including a reduction in falls and potentially lower pressure ulcer rates. The report also highlights the importance of considering the experience of BSN-prepared nurses. The statistical analysis, including Pearson's r and r2, supports the conclusion that staffing levels significantly influence patient outcomes, emphasizing the value of BSN-prepared nurses in enhancing patient care. The report refers to the 'Amb Surg Data' assignment brief, which involves a team developing a model for improvement within a healthcare setting, assessing room turnover, and creating patient brochures with discharge instructions.
Document Page
Running head: ADVANCED HEALTH INFORMATICS
ADVANCED HEALTH INFORMATICS
Name of the Student:
Name of the University:
Author’s Note:
tabler-icon-diamond-filled.svg

Paraphrase This Document

Need a fresh take? Get an instant paraphrase of this document with our AI Paraphraser
Document Page
1ADVANCED HEALTH INFORMATICS
Update I: Patient Outcomes Quarterly
Jan Feb March April May June July Aug Sept Oct Nov Dec
0
0.5
1
1.5
2
2.5
3
3.5
4
4.5
0.81 0.78 0.79 0.75 0.74 0.76 0.76 0.74 0.78 0.82 0.81 0.83
2
1 1
2 2 2
3
2 2 2 2
1
3
1 1
3 3
2
4
3
2
1
2
1
No. of falls, pressure ulcers and % of
BSN
Months
Number/percentage
Graph 1: No of falls, pressure ulcers and % of BSN in quarter manner
Update II: Inferential Statistics
Pearson r= 0.34
R2= 0.12
Update III: Conclusions—Create Usable Knowledge
It can be concluded that when the percentage of BSN prepared nurses, the percentage
of pressure ulcers was the same.
It was observed that as the percentage of BSN prepared nurses, the rate of falls in
patients has reduced.
Thus, it can be inferred that a high percentage of BSN prepared nurses have a positive
impact on informing the patients as a result of which, the health outcome improved.
Document Page
2ADVANCED HEALTH INFORMATICS
The daily patient outcome score was found to be more in case the number of BSN
prepared nurses increased
The highest score was obtained when the number of BSN qualified nurses was 6.
It needs to be noted that the experience of the BSN prepared nurses is also needs to be
considered while assessing the patient outcome in a hospital or any healthcare setting.
From the scattered diagram in the excel, it can be clearly demonstrated that the
concentration of the score was higher on 6.
The statistical result from Pearson r indicates that there is a strength of 1.34 of the
linear relationship between two variables (Armstrong, 2019).
This indicates that there is a strong relationship between the two variables, patient
score and the number of BSN-prepared nurses.
According to Howarth (2017), r2 is used for assessing the variance in the dependent
variable that is predictable from the independent variable.
From the result, it can be found that r2 was 0.12 in this case that indicates that the
variance level of the two variables is minimum that states the dependency of patient
outcomes on the nurses.
Document Page
3ADVANCED HEALTH INFORMATICS
References
Armstrong, R. A. (2019). Should Pearson's correlation coefficient be avoided?. Ophthalmic
and Physiological Optics, 39(5), 316-327.
Howarth, R. J. (2017). r2 (r-squared, R-squared, coefficient of determination) The square of
the product-moment correlation coefficient; a measure of the goodness-of-fit of a
regression.
chevron_up_icon
1 out of 4
circle_padding
hide_on_mobile
zoom_out_icon
[object Object]