University Assignment: Advanced Measurement Systems and Data Analysis
VerifiedAdded on 2022/08/12
|11
|3014
|47
Homework Assignment
AI Summary
This assignment addresses advanced measurement systems and data analysis, covering topics such as surface metrology, sensors, transducers, and coordinate measuring machines (CMM). The solution begins by identifying and evaluating suitable measurement solutions within an industrial context, considering factors like tolerance, surface roughness, and the application of various instruments like interferometry, digital holography, confocal microscopy, and contact profilometers. The assignment then delves into the operating principles, characteristics, and performance of sensors and transducers, including LVDT and optical encoders. Furthermore, it explores the functionality of CMMs, their applications, and the importance of probe selection and accuracy. The second part of the assignment focuses on measurement results, providing XY coordinates for a ring gauge and tasks the student to calculate the center and radius of the circular features using the least squares algorithm in Excel, with the provided data and graphical representations. This analysis demonstrates the practical application of data analysis techniques in measurement systems.
Advanced Measurement Systems and data analysis
1)
The largest total linear dimension of a component which is manufactured by the company =
400 nm
Tolerance ( of products ) = 50 um
Tolerance ( of precision spindles ) = 5 microns
Surface roughness = 12.5 – 0.025 um
Types of equipment for improving the measurement as well as product quality in the
company :
In surface metrology, the small scale features are measured on a surface. The major
parameters considered are
: surface roughness, fractality and surface primary form. The choice of correct instrument for
measurement based on the application is necessary. Interferometry shows large value of
vertical resolution. In digital holography, moving samples and deformable surfaces are
measured. It can measure vibrations also. The focus variation can be used for rough surfaces
and not smooth surfaces ( like Silicon wafer ). It can be used for the samples of metal, plastic
or paper. In confocal microscopy, the lateral resolution is good but the measurement on steep
flanks is not possible. In confocal chromatic aberration, the measurement of rough as well as
smooth surfaces is possible. In contact profilometer, lateral resolution is very good but the
surface contamination may occur due to contact ( Hanchett, 2012 ).
If the number of roughness parameters is more, then the accuracy is more. The 3 types of
parameters are – amplitude, spacing and hybrid parameters.
Sensors :
Paraphrase This Document
Need a fresh take? Get an instant paraphrase of this document with our AI Paraphraser
Operating Principle :
A sensor is a device which can help in detection of any change and can send this data to an
electronic device ( like a processor ). The sensors can be used to measure the physical as well
as chemical properties of a material. The sensors can also be built on a microscopic scale by
the MEMs technology ( micro sensors ).
Characteristics :
There may be some deviation in the sensor output which can decrease its accuracy. The
reasons for this deviation can be : scale range, sensitivity, offset or bias, non – linearity,
dynamic error, drift, noise, hysteresis error, quantization error, aliasing error etc ( Inga ,
2014 ).
Performance :
The sensor must be sensitive to the property being measured and insensitive to the other
properties. It must not change the property being measured.
Transducers :
Operating Principle :
The device which can convert energy from one form to the other is referred to as a
transducer. Transducers are generally used to convert the electrical energy into any other
physical quantity ( like light, force, torque etc. ) or vice versa.
Characteristics :
A transducer has the following characteristics : Dynamic range, repeatability , noise and
hysteresis. The dynamic range is given by the ratio of the largest signal amplitude to the
smallest signal amplitude which can be translated by the transducer. If the dynamic range is
more, then the sensitivity and precision are also more. If a transducer is able to get similar
output on simulation with same input, then it has good repeatability. A transducer also adds
random noise to the output. Smaller signals are affected more due to the noise. Hysteresis in a
transducer refers to the phenomenon where the output is dependent on current as well as past
input ( Zhou, 2016 ).
Performance :
The transducers can be of 2 types – Mechanical transducers and electrical transducers. The
mechanical transducer converts a physical quantity into a mechanical quantity. The electrical
transducer converts a physical quantity into an electrical quantity. For example – LVDT
( Linear Variable Differential Transformer ) which is capable of measuring the displacement.
LVDT :
The LVDT ( Linear variable differential transducer ) can be used for the measurement of
displacement.
Optical encoder :
The optical encoder is a device of electromechanical nature. It gives the output in electrical
form which gives digital data proportional to the input shaft’s angular position. The optical
encoder is a type of sensor which senses the angular position. The shaft is coupled
mechanically to the input driver. A disc is fixed rigidly to it which gets rotated. The surface
of the disc is marked with the segments successively which are of 2 types - Clear and opaque.
The clear or transparent segments present in the rotating disc allow the light emitted by
diodes (which emit infra red light) to reach the infrared receivers. This leads to the generation
⊘ This is a preview!⊘
Do you want full access?
Subscribe today to unlock all pages.
Trusted by 1+ million students worldwide
of an analog signal. This analog signal is passed through an amplifier and then converted to
digital format. The data is then passed to a data processor.
The operating principle of an optical encoder can be understood in 3 parts : Encoder shaft
mechanics, Engraved disc optics and reading and output signal electronics ( Zanobini,
2016 ).
CMM ( Co – ordinate measuring machine ) :
CMM is used for testing an assembly or a part as per the design specification. The generation
of point clouds can be used for constructing the feature by analysis using the regression
method. An operator can manually position the probe or it can be an automated process for
the collection of the points. The programming for CMM can be done in such a manner that it
can give the measurement of similar parts repetitively. An industrial robot can be assumed to
be a special type of CMM which uses automation. A CMM consists of 3 major parts. They
are: the system for probing, the system for collecting and reducing data and the main frame
having the 3 axis of movement. The frame which moves can be made up of steel, granite,
Aluminium alloys, ceramics or Silicon carbide. The Z axis for CMM must have good
stiffness ( Janiszewski, 2012 ).
Operating Principle :
A probe is used in this device to sense the points discretely which are present on an object’s
surface. This helps in the measurement of the geometry of an object under consideration. The
probe can be chosen from various types- laser,optical, mechanical, White light etc.
The position of the probe can be controlled in 2 ways- by a computer or by an operator in a
manual fashion. The position of the probe is specified with respect to a reference point in the
3- dimensional space. The displacement from this reference point is considered. The position
is specified in Cartesian coordinate system (as x,y and z).
In the 3-dimensional bridge CMM, the probe can be moved in 3 directions of x,y and z axis
that are mutually perpendicular to one another. There is a sensor present on every axis for
Paraphrase This Document
Need a fresh take? Get an instant paraphrase of this document with our AI Paraphraser
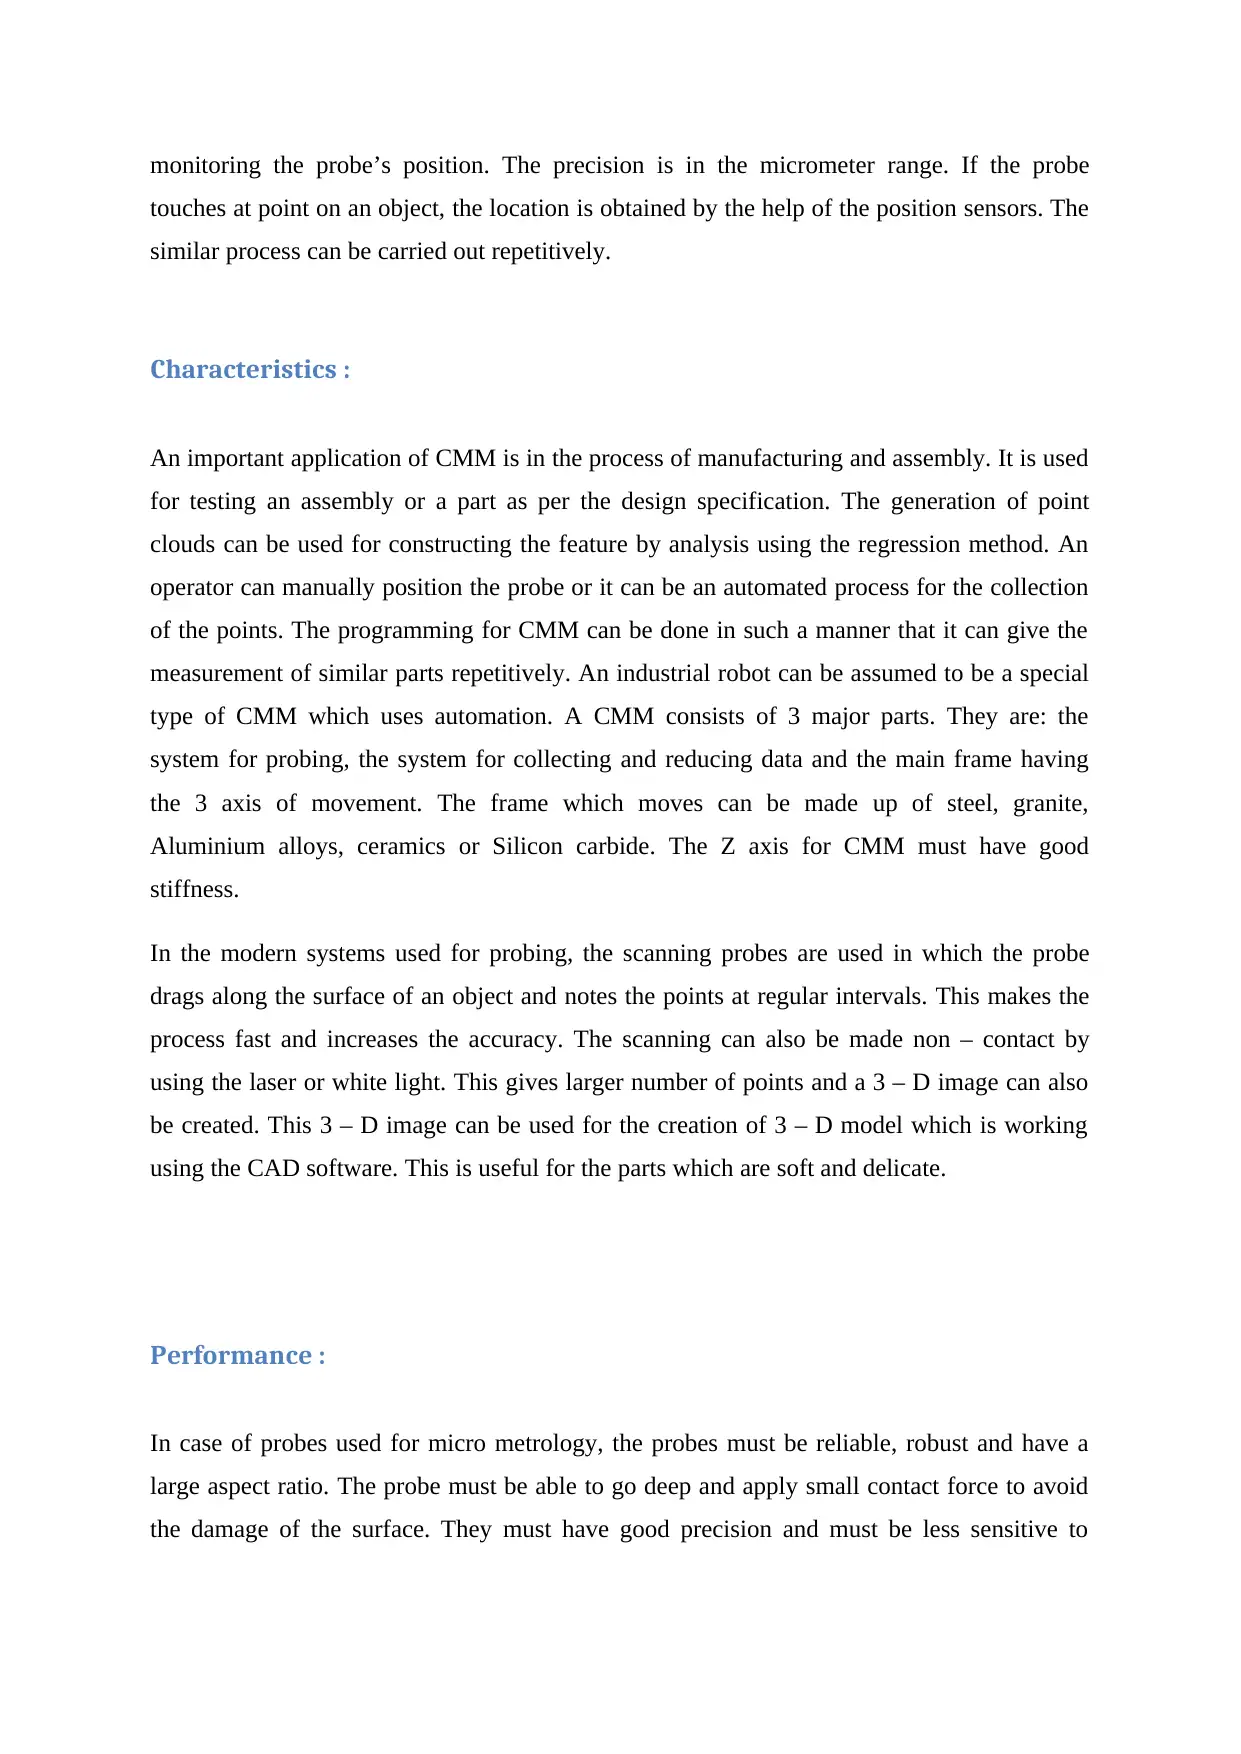
monitoring the probe’s position. The precision is in the micrometer range. If the probe
touches at point on an object, the location is obtained by the help of the position sensors. The
similar process can be carried out repetitively.
Characteristics :
An important application of CMM is in the process of manufacturing and assembly. It is used
for testing an assembly or a part as per the design specification. The generation of point
clouds can be used for constructing the feature by analysis using the regression method. An
operator can manually position the probe or it can be an automated process for the collection
of the points. The programming for CMM can be done in such a manner that it can give the
measurement of similar parts repetitively. An industrial robot can be assumed to be a special
type of CMM which uses automation. A CMM consists of 3 major parts. They are: the
system for probing, the system for collecting and reducing data and the main frame having
the 3 axis of movement. The frame which moves can be made up of steel, granite,
Aluminium alloys, ceramics or Silicon carbide. The Z axis for CMM must have good
stiffness.
In the modern systems used for probing, the scanning probes are used in which the probe
drags along the surface of an object and notes the points at regular intervals. This makes the
process fast and increases the accuracy. The scanning can also be made non – contact by
using the laser or white light. This gives larger number of points and a 3 – D image can also
be created. This 3 – D image can be used for the creation of 3 – D model which is working
using the CAD software. This is useful for the parts which are soft and delicate.
Performance :
In case of probes used for micro metrology, the probes must be reliable, robust and have a
large aspect ratio. The probe must be able to go deep and apply small contact force to avoid
the damage of the surface. They must have good precision and must be less sensitive to
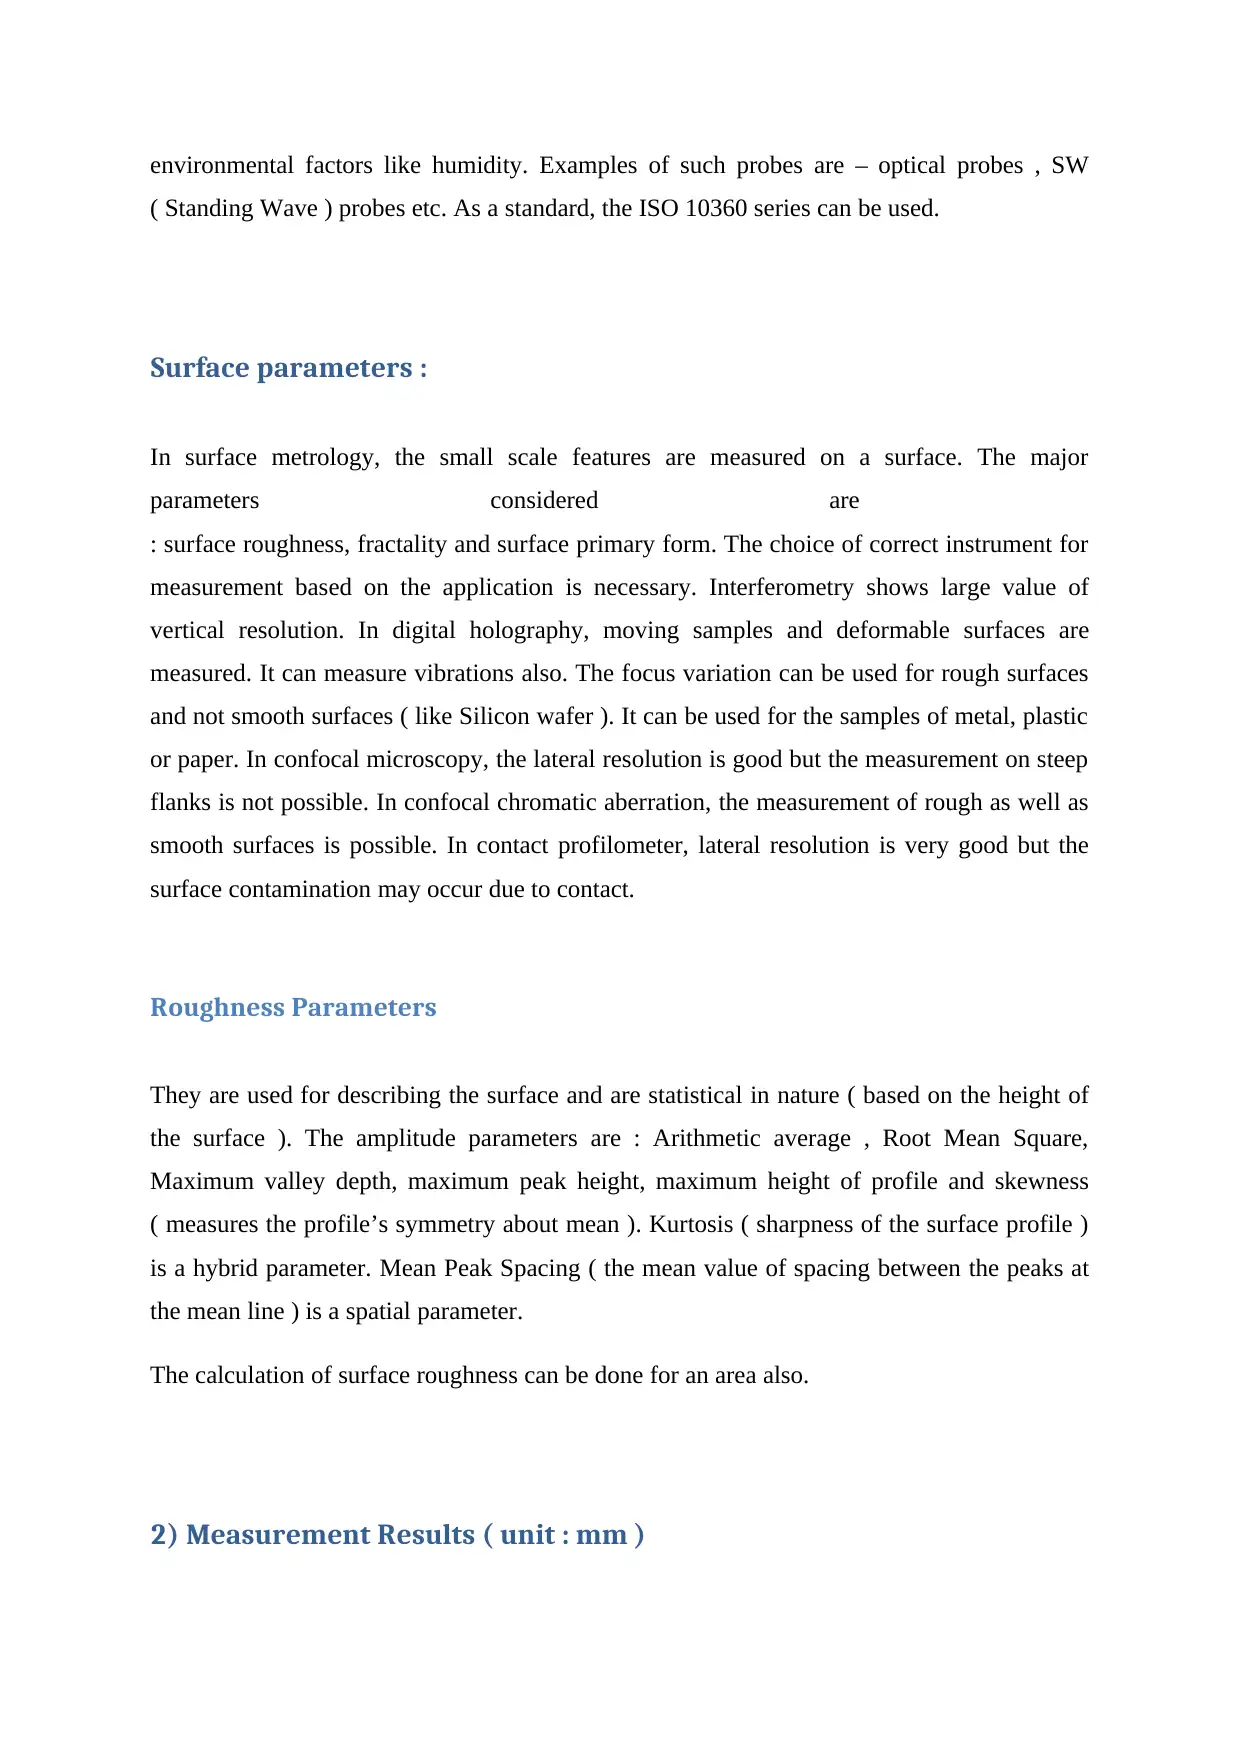
environmental factors like humidity. Examples of such probes are – optical probes , SW
( Standing Wave ) probes etc. As a standard, the ISO 10360 series can be used.
Surface parameters :
In surface metrology, the small scale features are measured on a surface. The major
parameters considered are
: surface roughness, fractality and surface primary form. The choice of correct instrument for
measurement based on the application is necessary. Interferometry shows large value of
vertical resolution. In digital holography, moving samples and deformable surfaces are
measured. It can measure vibrations also. The focus variation can be used for rough surfaces
and not smooth surfaces ( like Silicon wafer ). It can be used for the samples of metal, plastic
or paper. In confocal microscopy, the lateral resolution is good but the measurement on steep
flanks is not possible. In confocal chromatic aberration, the measurement of rough as well as
smooth surfaces is possible. In contact profilometer, lateral resolution is very good but the
surface contamination may occur due to contact.
Roughness Parameters
They are used for describing the surface and are statistical in nature ( based on the height of
the surface ). The amplitude parameters are : Arithmetic average , Root Mean Square,
Maximum valley depth, maximum peak height, maximum height of profile and skewness
( measures the profile’s symmetry about mean ). Kurtosis ( sharpness of the surface profile )
is a hybrid parameter. Mean Peak Spacing ( the mean value of spacing between the peaks at
the mean line ) is a spatial parameter.
The calculation of surface roughness can be done for an area also.
2) Measurement Results ( unit : mm )
⊘ This is a preview!⊘
Do you want full access?
Subscribe today to unlock all pages.
Trusted by 1+ million students worldwide
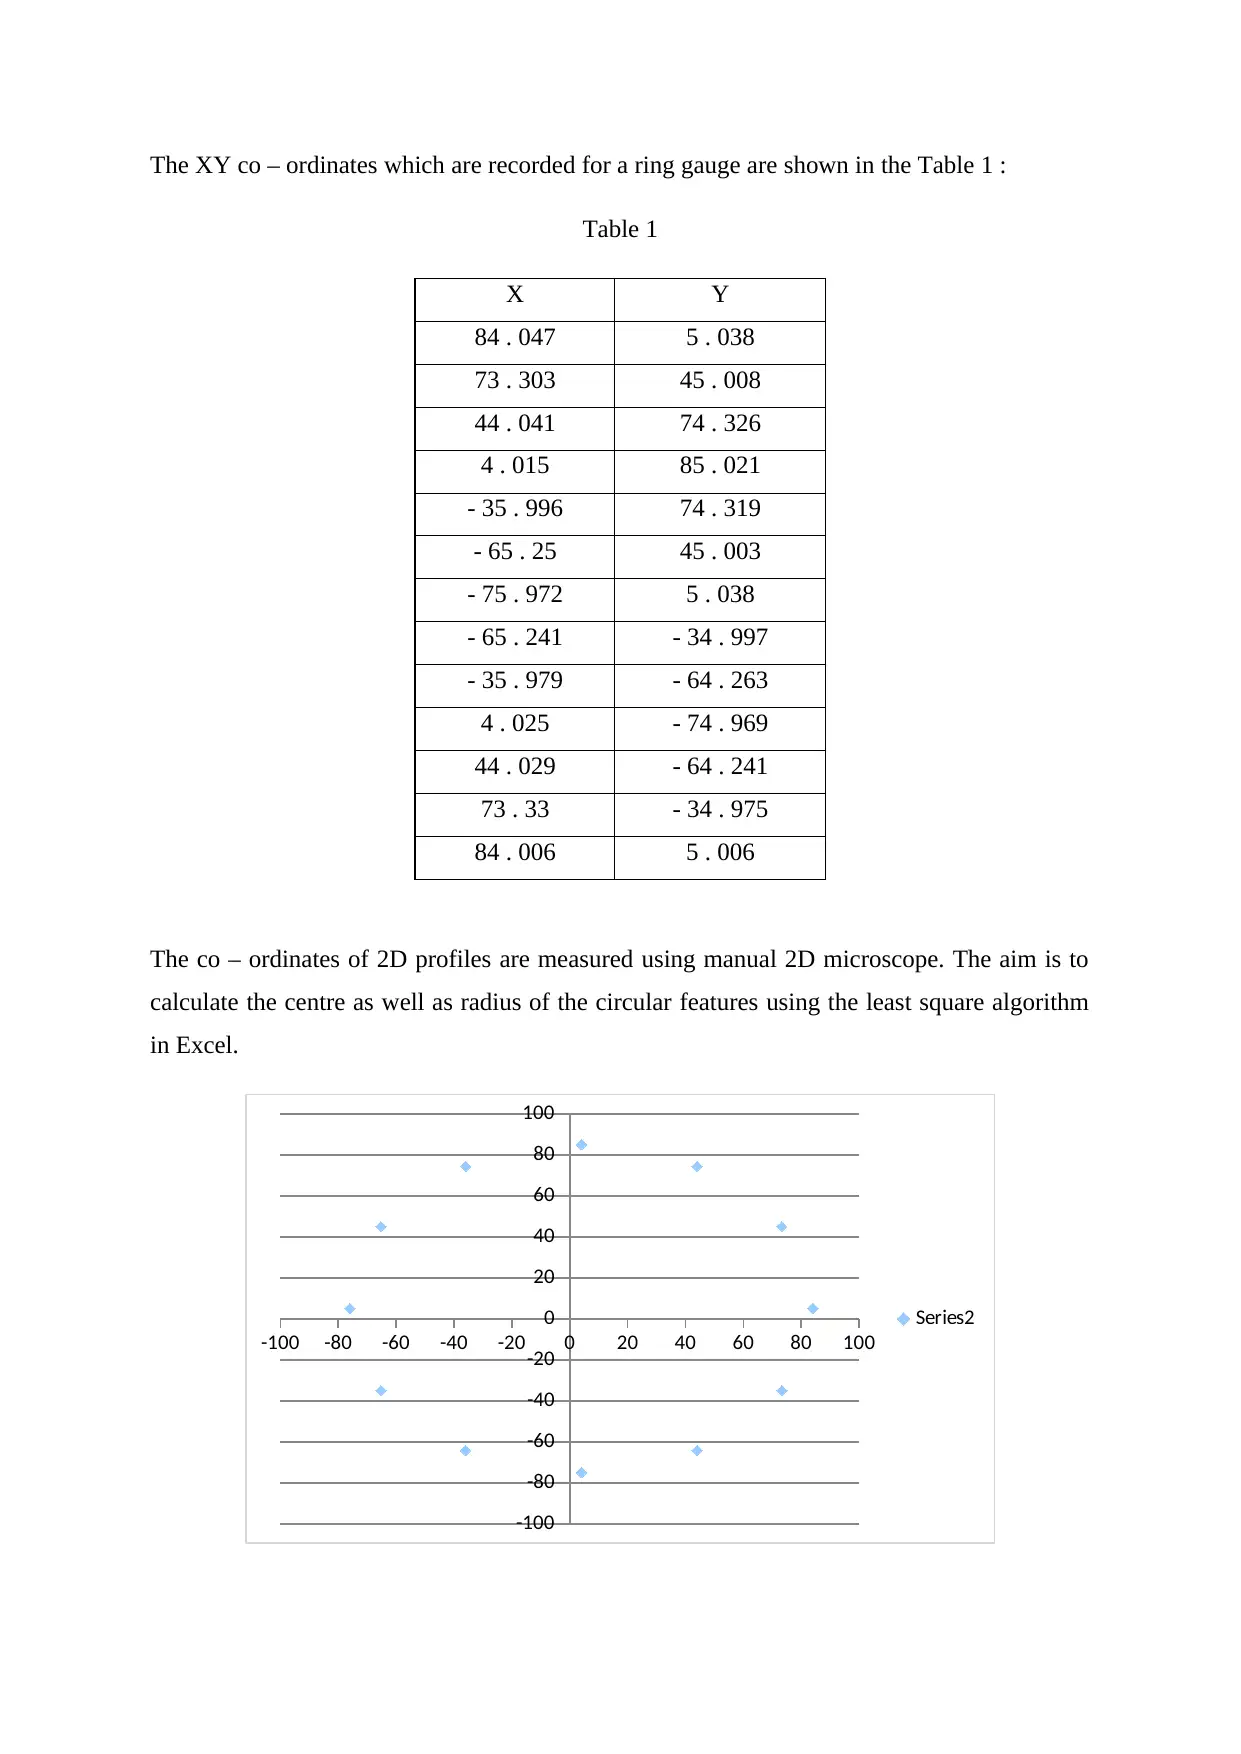
The XY co – ordinates which are recorded for a ring gauge are shown in the Table 1 :
Table 1
X Y
84 . 047 5 . 038
73 . 303 45 . 008
44 . 041 74 . 326
4 . 015 85 . 021
- 35 . 996 74 . 319
- 65 . 25 45 . 003
- 75 . 972 5 . 038
- 65 . 241 - 34 . 997
- 35 . 979 - 64 . 263
4 . 025 - 74 . 969
44 . 029 - 64 . 241
73 . 33 - 34 . 975
84 . 006 5 . 006
The co – ordinates of 2D profiles are measured using manual 2D microscope. The aim is to
calculate the centre as well as radius of the circular features using the least square algorithm
in Excel.
-100 -80 -60 -40 -20 0 20 40 60 80 100
-100
-80
-60
-40
-20
0
20
40
60
80
100
Series2
Paraphrase This Document
Need a fresh take? Get an instant paraphrase of this document with our AI Paraphraser
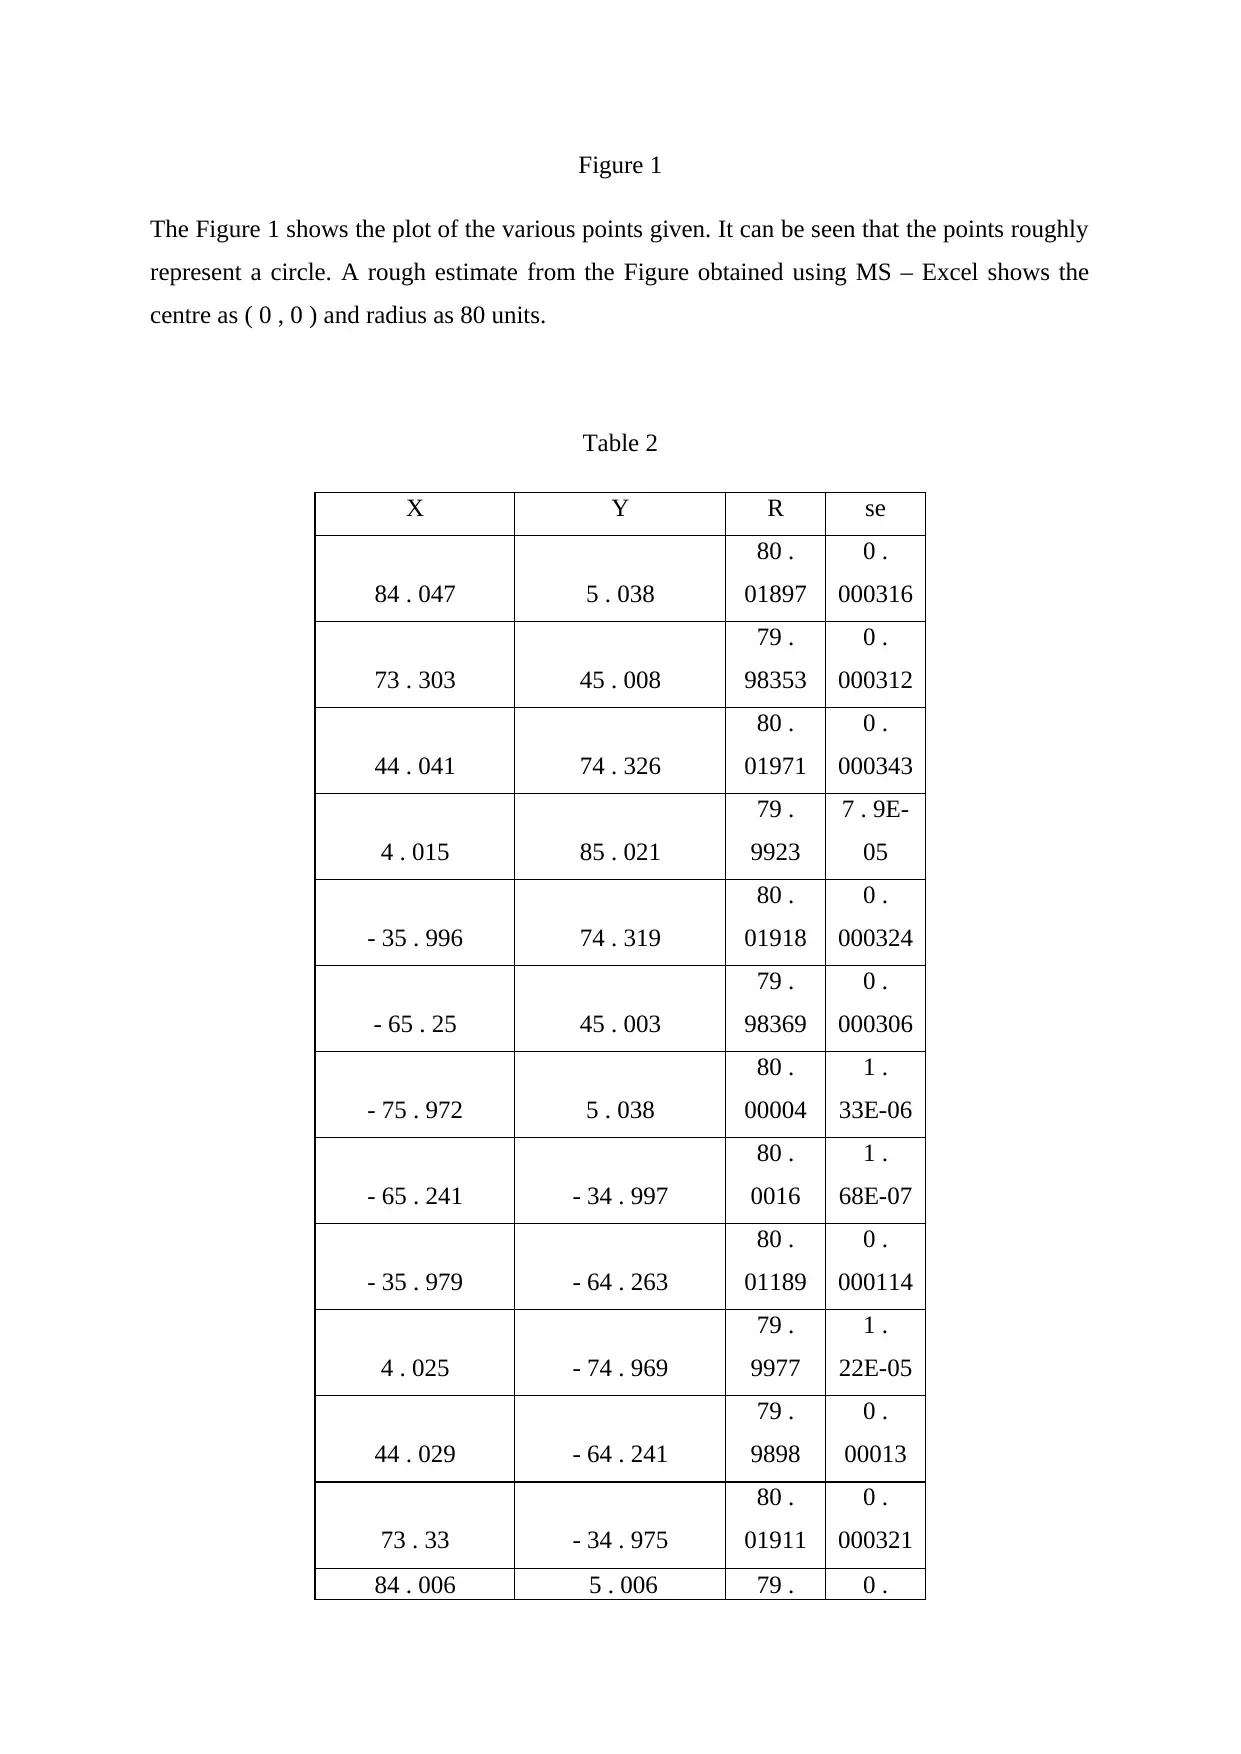
Figure 1
The Figure 1 shows the plot of the various points given. It can be seen that the points roughly
represent a circle. A rough estimate from the Figure obtained using MS – Excel shows the
centre as ( 0 , 0 ) and radius as 80 units.
Table 2
X Y R se
84 . 047 5 . 038
80 .
01897
0 .
000316
73 . 303 45 . 008
79 .
98353
0 .
000312
44 . 041 74 . 326
80 .
01971
0 .
000343
4 . 015 85 . 021
79 .
9923
7 . 9E-
05
- 35 . 996 74 . 319
80 .
01918
0 .
000324
- 65 . 25 45 . 003
79 .
98369
0 .
000306
- 75 . 972 5 . 038
80 .
00004
1 .
33E-06
- 65 . 241 - 34 . 997
80 .
0016
1 .
68E-07
- 35 . 979 - 64 . 263
80 .
01189
0 .
000114
4 . 025 - 74 . 969
79 .
9977
1 .
22E-05
44 . 029 - 64 . 241
79 .
9898
0 .
00013
73 . 33 - 34 . 975
80 .
01911
0 .
000321
84 . 006 5 . 006 79 . 0 .
97797 000539
Sum
0 .
002798
centre x 4 . 028034706 0
centre y 5 . 028698389 0
radius 80 . 0011884 80
var Fix
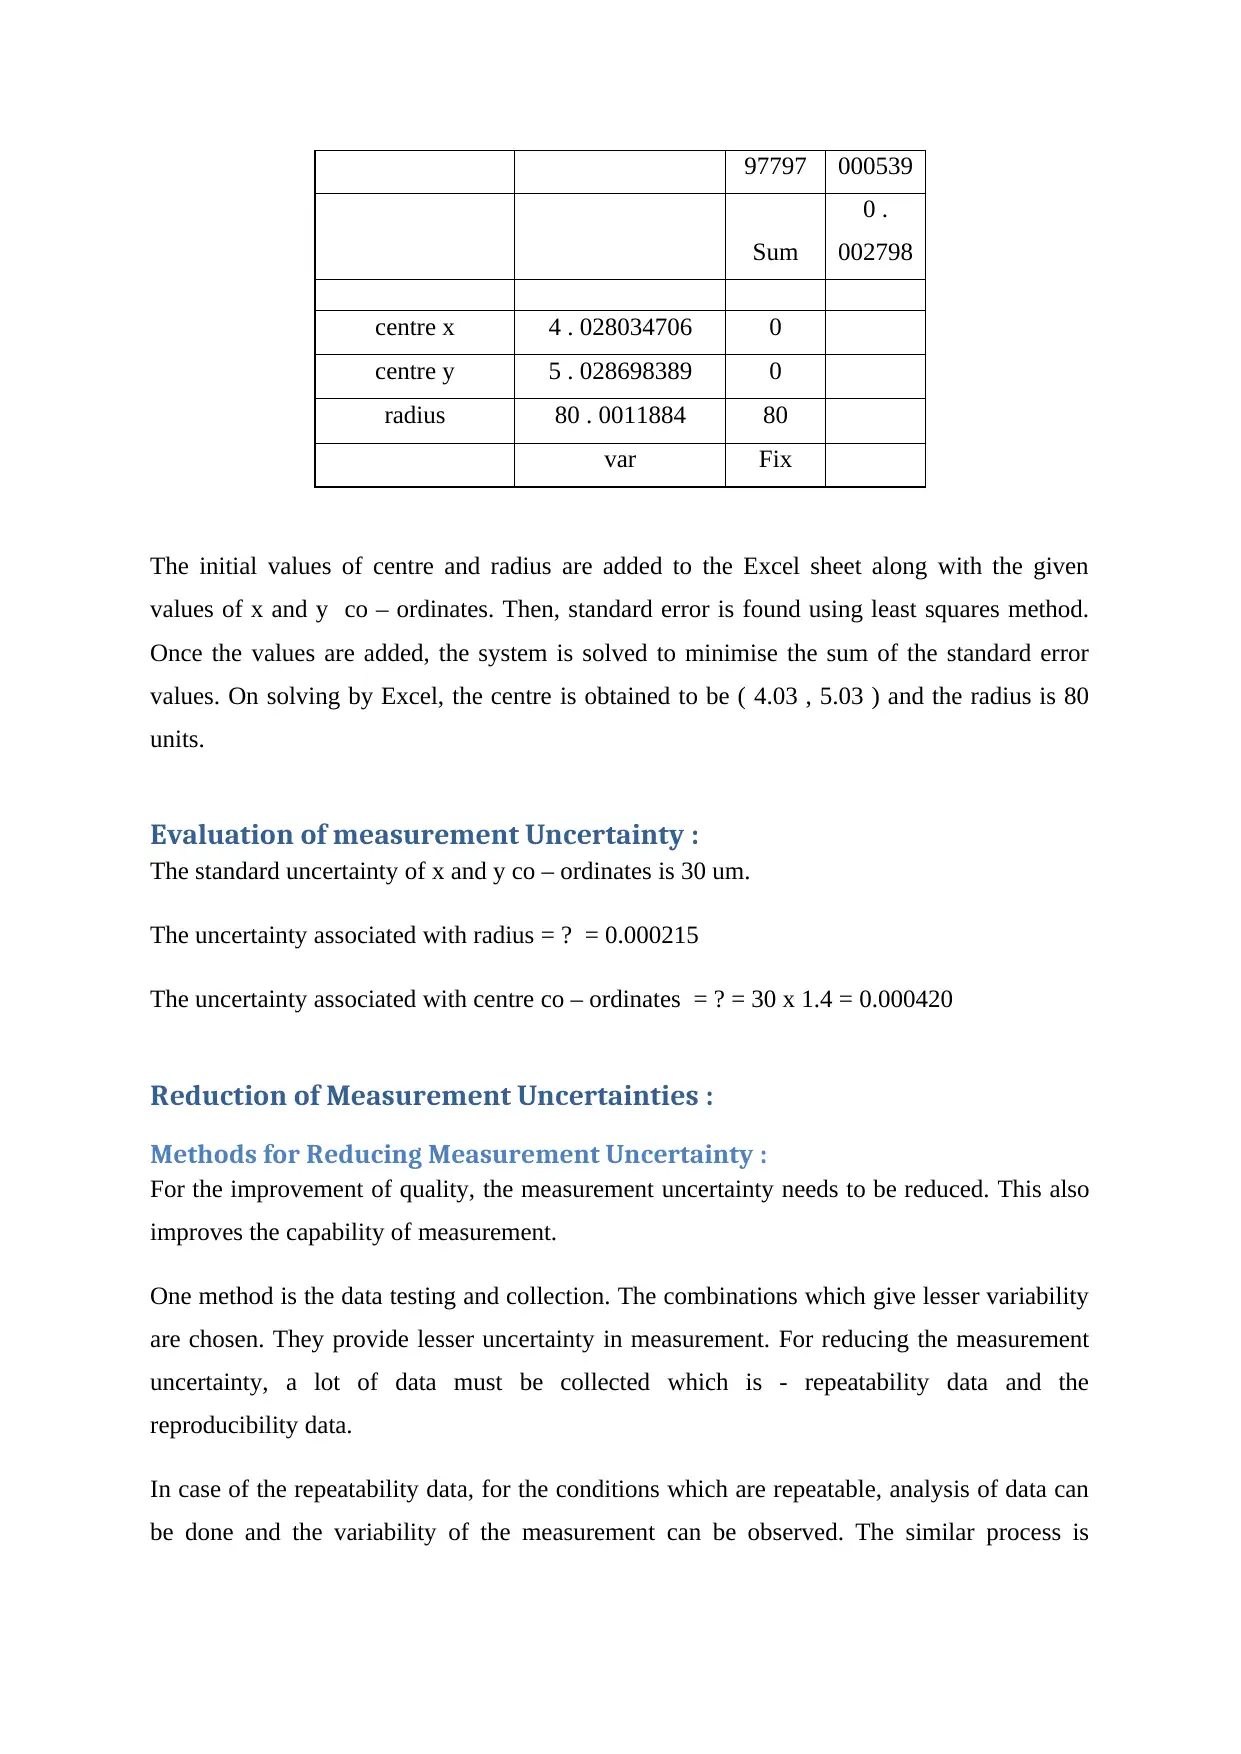
The initial values of centre and radius are added to the Excel sheet along with the given
values of x and y co – ordinates. Then, standard error is found using least squares method.
Once the values are added, the system is solved to minimise the sum of the standard error
values. On solving by Excel, the centre is obtained to be ( 4.03 , 5.03 ) and the radius is 80
units.
Evaluation of measurement Uncertainty :
The standard uncertainty of x and y co – ordinates is 30 um.
The uncertainty associated with radius = ? = 0.000215
The uncertainty associated with centre co – ordinates = ? = 30 x 1.4 = 0.000420
Reduction of Measurement Uncertainties :
Methods for Reducing Measurement Uncertainty :
For the improvement of quality, the measurement uncertainty needs to be reduced. This also
improves the capability of measurement.
One method is the data testing and collection. The combinations which give lesser variability
are chosen. They provide lesser uncertainty in measurement. For reducing the measurement
uncertainty, a lot of data must be collected which is - repeatability data and the
reproducibility data.
In case of the repeatability data, for the conditions which are repeatable, analysis of data can
be done and the variability of the measurement can be observed. The similar process is
Sum
0 .
002798
centre x 4 . 028034706 0
centre y 5 . 028698389 0
radius 80 . 0011884 80
var Fix
The initial values of centre and radius are added to the Excel sheet along with the given
values of x and y co – ordinates. Then, standard error is found using least squares method.
Once the values are added, the system is solved to minimise the sum of the standard error
values. On solving by Excel, the centre is obtained to be ( 4.03 , 5.03 ) and the radius is 80
units.
Evaluation of measurement Uncertainty :
The standard uncertainty of x and y co – ordinates is 30 um.
The uncertainty associated with radius = ? = 0.000215
The uncertainty associated with centre co – ordinates = ? = 30 x 1.4 = 0.000420
Reduction of Measurement Uncertainties :
Methods for Reducing Measurement Uncertainty :
For the improvement of quality, the measurement uncertainty needs to be reduced. This also
improves the capability of measurement.
One method is the data testing and collection. The combinations which give lesser variability
are chosen. They provide lesser uncertainty in measurement. For reducing the measurement
uncertainty, a lot of data must be collected which is - repeatability data and the
reproducibility data.
In case of the repeatability data, for the conditions which are repeatable, analysis of data can
be done and the variability of the measurement can be observed. The similar process is
⊘ This is a preview!⊘
Do you want full access?
Subscribe today to unlock all pages.
Trusted by 1+ million students worldwide
repeated again and again and the data is analysed. If the repetition frequency is increased,
then better results are obtained.
In case of the reproducibility data, some elements are altered which are common in the
process of measurement. The variability to reproduce the results of measurement are analysed
and observed. The elements which can be altered are: equipment used, time, operator,
environmental factors, days etc. When the results are evaluated, the combinations which give
smaller variability are chosen. This leads to smaller value of uncertainty in measurement. A
combination of the variables giving smaller uncertainty of the results of measurement is
obtained.
The second method is the selection of a good laboratory for calibration. The uncertainty
which is related to the calibration results must be reduced by the selection of good labs and
good service providers for calibration. This also leads to a lower value of uncertainty related
to the process of measurement. A lab can be selected for providing the service, its
accreditation scope must be studied.
The third method is the removal of bias and characterization. In case of the critical and
precision calibration, the significant comparison values’ list is taken to find the standards and
artefacts. Any type of measurement bias must be removed to decrease the uncertainty. The
systematic error which is linked with the calibration value of the standard is called bias. The
results obtained must be compared to the actual value. A list of significant values for
comparison must be prepared for enhancing the quality.
References
Hanchett, M. and Hartl, J., Advanced Measurement Systems, 2012. Single laser beam
measurement system. U.S. Patent 8,319,979.
Inga, E., Arévalo, G. and Hincapié, R., 2014, June. Optimal deployment of cellular networks
for Advanced Measurement Infrastructure in Smart Grid. In 2014 IEEE Colombian
Conference on Communications and Computing (COLCOM) (pp. 1-6). IEEE.
Zhou, D., Guo, J., Zhang, Y., Chai, J., Liu, H., Liu, Y., Huang, C., Gui, X. and Liu, Y., 2016.
Distributed data analytics platform for wide-area synchrophasor measurement systems. IEEE
Transactions on Smart Grid, 7(5), pp.2397-2405.
Paraphrase This Document
Need a fresh take? Get an instant paraphrase of this document with our AI Paraphraser

Zanobini, A., Sereni, B., Catelani, M. and Ciani, L., 2016. Repeatability and reproducibility
techniques for the analysis of measurement systems. Measurement, 86, pp.125-132.
Janiszewski, J., 2012. Measurement procedure of ring motion with the use of highspeed
camera during electromagnetic expansion. Metrology and measurement systems, 19(4),
pp.797-804.
techniques for the analysis of measurement systems. Measurement, 86, pp.125-132.
Janiszewski, J., 2012. Measurement procedure of ring motion with the use of highspeed
camera during electromagnetic expansion. Metrology and measurement systems, 19(4),
pp.797-804.
1 out of 11
Related Documents


Your All-in-One AI-Powered Toolkit for Academic Success.
+13062052269
info@desklib.com
Available 24*7 on WhatsApp / Email
![[object Object]](/_next/static/media/star-bottom.7253800d.svg)
Unlock your academic potential
Copyright © 2020–2025 A2Z Services. All Rights Reserved. Developed and managed by ZUCOL.