Factor Analysis: Determining Underlying Variables
Added on 2023-01-16
26 Pages4005 Words54 Views
Advanced Quantitative
Methods
Methods
Table of Contents
Question 1...................................................................................................................................4
Question 2.................................................................................................................................10
Question 3.................................................................................................................................20
Question 4.................................................................................................................................22
Question 5.................................................................................................................................23
REFERENCES .............................................................................................................................26
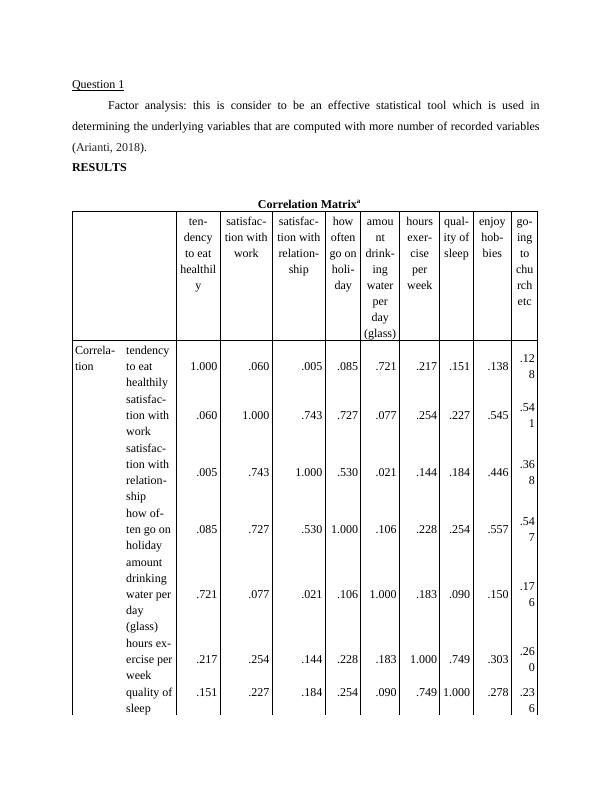
Question 1
Factor analysis: this is consider to be an effective statistical tool which is used in
determining the underlying variables that are computed with more number of recorded variables
(Arianti, 2018).
RESULTS
Correlation Matrixa
ten-
dency
to eat
healthil
y
satisfac-
tion with
work
satisfac-
tion with
relation-
ship
how
often
go on
holi-
day
amou
nt
drink-
ing
water
per
day
(glass)
hours
exer-
cise
per
week
qual-
ity of
sleep
enjoy
hob-
bies
go-
ing
to
chu
rch
etc
Correla-
tion
tendency
to eat
healthily
1.000 .060 .005 .085 .721 .217 .151 .138 .12
8
satisfac-
tion with
work
.060 1.000 .743 .727 .077 .254 .227 .545 .54
1
satisfac-
tion with
relation-
ship
.005 .743 1.000 .530 .021 .144 .184 .446 .36
8
how of-
ten go on
holiday
.085 .727 .530 1.000 .106 .228 .254 .557 .54
7
amount
drinking
water per
day
(glass)
.721 .077 .021 .106 1.000 .183 .090 .150 .17
6
hours ex-
ercise per
week
.217 .254 .144 .228 .183 1.000 .749 .303 .26
0
quality of
sleep
.151 .227 .184 .254 .090 .749 1.000 .278 .23
6
enjoy
hobbies .138 .545 .446 .557 .150 .303 .278 1.000 .77
5
going to
church
etc
.128 .541 .368 .547 .176 .260 .236 .775 1.0
00
Sig. (1-
tailed)
tendency
to eat
healthily
.172 .466 .090 .000 .000 .008 .014 .02
2
satisfac-
tion with
work
.172 .000 .000 .114 .000 .000 .000 .00
0
satisfac-
tion with
relation-
ship
.466 .000 .000 .368 .011 .002 .000 .00
0
how of-
ten go on
holiday
.090 .000 .000 .046 .000 .000 .000 .00
0
amount
drinking
water per
day
(glass)
.000 .114 .368 .046 .002 .078 .009 .00
3
hours ex-
ercise per
week
.000 .000 .011 .000 .002 .000 .000 .00
0
quality of
sleep .008 .000 .002 .000 .078 .000 .000 .00
0
enjoy
hobbies .014 .000 .000 .000 .009 .000 .000 .00
0
going to
church
etc
.022 .000 .000 .000 .003 .000 .000 .000
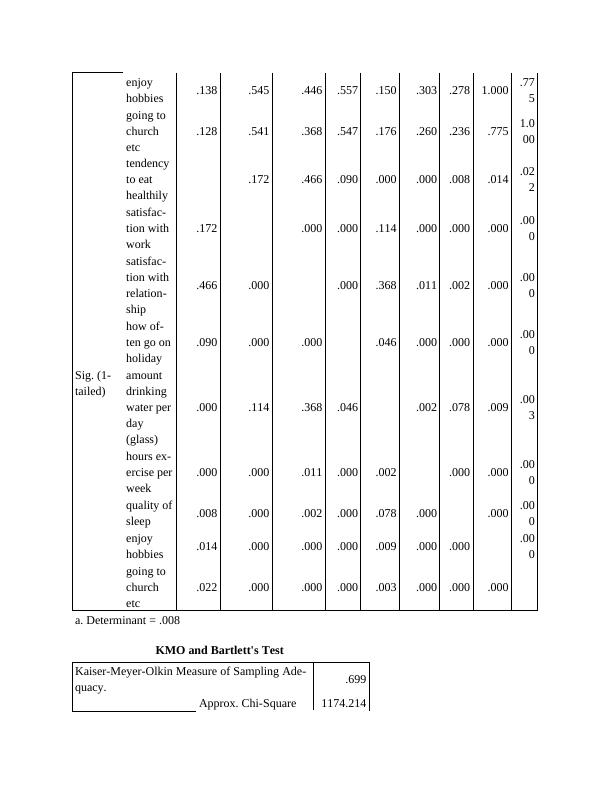
a. Determinant = .008
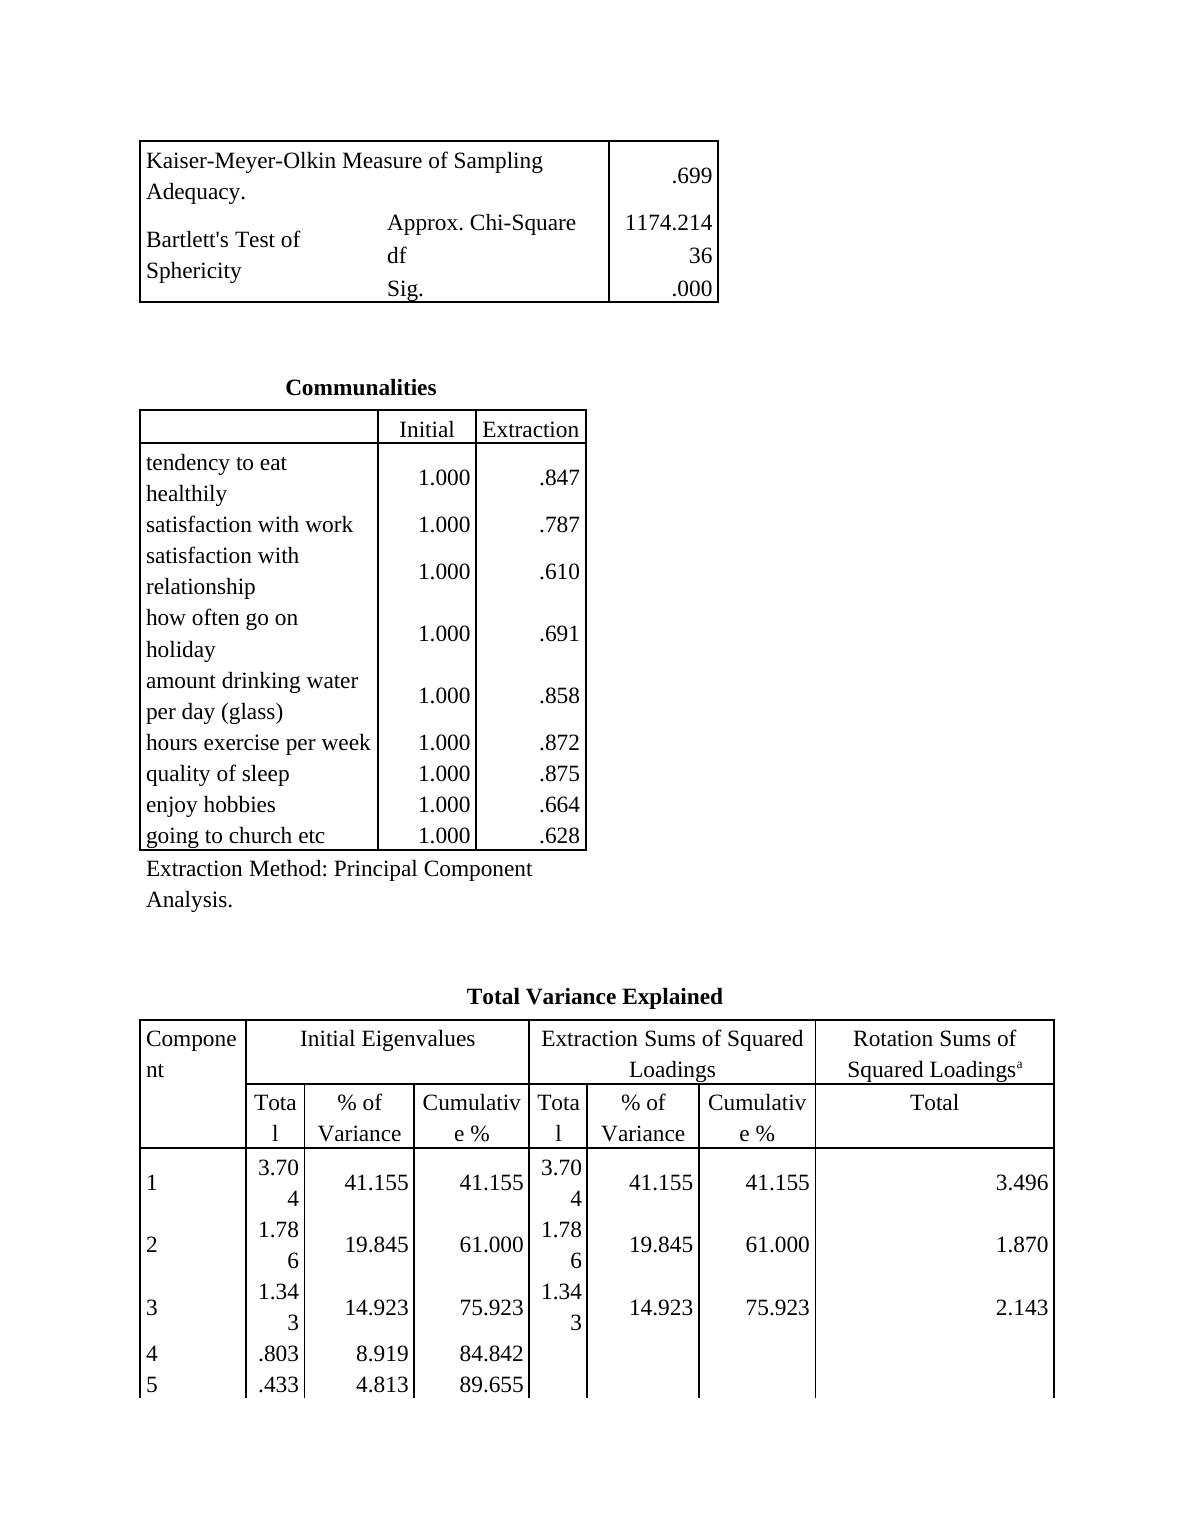
KMO and Bartlett's Test
Kaiser-Meyer-Olkin Measure of Sampling Ade-
quacy. .699
Approx. Chi-Square 1174.214
hobbies .138 .545 .446 .557 .150 .303 .278 1.000 .77
5
going to
church
etc
.128 .541 .368 .547 .176 .260 .236 .775 1.0
00
Sig. (1-
tailed)
tendency
to eat
healthily
.172 .466 .090 .000 .000 .008 .014 .02
2
satisfac-
tion with
work
.172 .000 .000 .114 .000 .000 .000 .00
0
satisfac-
tion with
relation-
ship
.466 .000 .000 .368 .011 .002 .000 .00
0
how of-
ten go on
holiday
.090 .000 .000 .046 .000 .000 .000 .00
0
amount
drinking
water per
day
(glass)
.000 .114 .368 .046 .002 .078 .009 .00
3
hours ex-
ercise per
week
.000 .000 .011 .000 .002 .000 .000 .00
0
quality of
sleep .008 .000 .002 .000 .078 .000 .000 .00
0
enjoy
hobbies .014 .000 .000 .000 .009 .000 .000 .00
0
going to
church
etc
.022 .000 .000 .000 .003 .000 .000 .000
a. Determinant = .008
KMO and Bartlett's Test
Kaiser-Meyer-Olkin Measure of Sampling Ade-
quacy. .699
Approx. Chi-Square 1174.214
Bartlett's Test of
Sphericity
df 36
Sig. .000
Communalities
Initial Extraction
tendency to eat
healthily 1.000 .847
satisfaction with work 1.000 .787
satisfaction with rela-
tionship 1.000 .610
how often go on holi-
day 1.000 .691
amount drinking water
per day (glass) 1.000 .858
hours exercise per week 1.000 .872
quality of sleep 1.000 .875
enjoy hobbies 1.000 .664
going to church etc 1.000 .628
Extraction Method: Principal Component
Analysis.
Total Variance Explained
Compo-
nent
Initial Eigenvalues Extraction Sums of Squared
Loadings
Rotation Sums of
Squared Loadingsa
To-
tal
% of
Variance
Cumula-
tive %
To-
tal
% of
Variance
Cumula-
tive %
Total
1 3.70
4 41.155 41.155 3.70
4 41.155 41.155 3.496
2 1.78
6 19.845 61.000 1.78
6 19.845 61.000 1.870
3 1.34
3 14.923 75.923 1.34
3 14.923 75.923 2.143
4 .803 8.919 84.842
5 .433 4.813 89.655
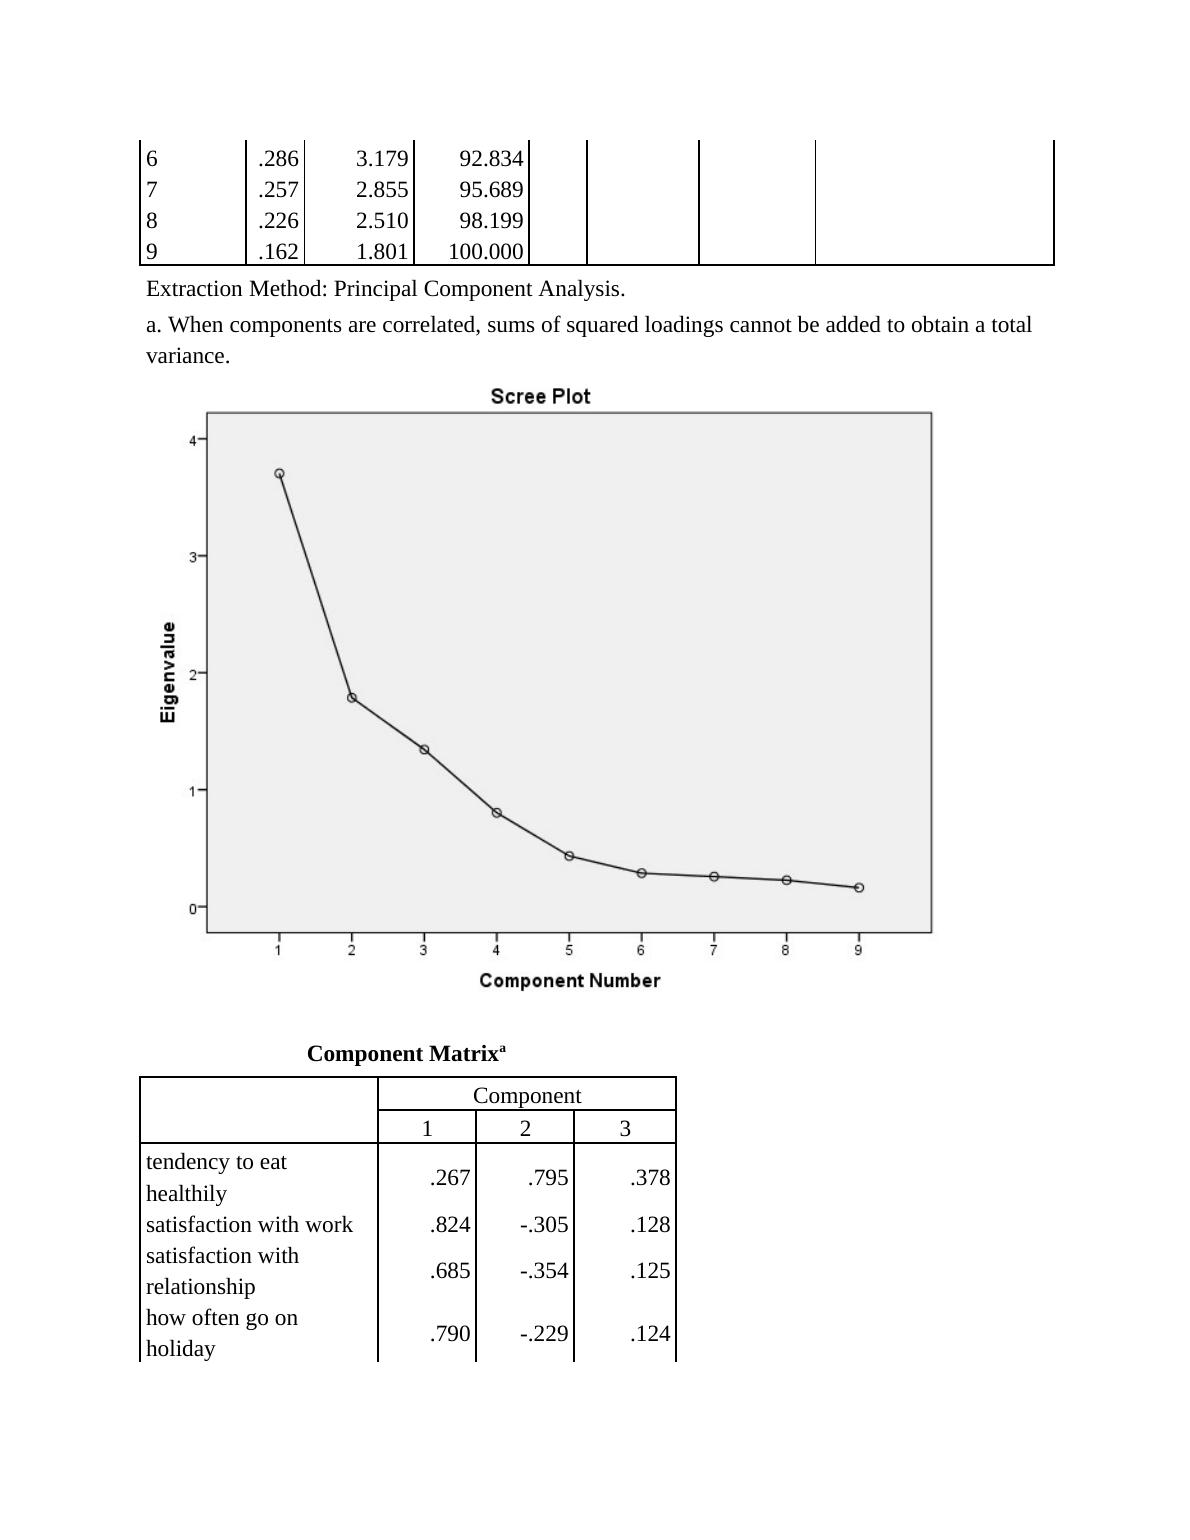
6 .286 3.179 92.834
7 .257 2.855 95.689
8 .226 2.510 98.199
Sphericity
df 36
Sig. .000
Communalities
Initial Extraction
tendency to eat
healthily 1.000 .847
satisfaction with work 1.000 .787
satisfaction with rela-
tionship 1.000 .610
how often go on holi-
day 1.000 .691
amount drinking water
per day (glass) 1.000 .858
hours exercise per week 1.000 .872
quality of sleep 1.000 .875
enjoy hobbies 1.000 .664
going to church etc 1.000 .628
Extraction Method: Principal Component
Analysis.
Total Variance Explained
Compo-
nent
Initial Eigenvalues Extraction Sums of Squared
Loadings
Rotation Sums of
Squared Loadingsa
To-
tal
% of
Variance
Cumula-
tive %
To-
tal
% of
Variance
Cumula-
tive %
Total
1 3.70
4 41.155 41.155 3.70
4 41.155 41.155 3.496
2 1.78
6 19.845 61.000 1.78
6 19.845 61.000 1.870
3 1.34
3 14.923 75.923 1.34
3 14.923 75.923 2.143
4 .803 8.919 84.842
5 .433 4.813 89.655
6 .286 3.179 92.834
7 .257 2.855 95.689
8 .226 2.510 98.199
9 .162 1.801 100.000
Extraction Method: Principal Component Analysis.
a. When components are correlated, sums of squared loadings cannot be added to obtain a total
variance.
Component Matrixa
Component
1 2 3
tendency to eat
healthily .267 .795 .378
satisfaction with work .824 -.305 .128
satisfaction with rela-
tionship .685 -.354 .125
how often go on holi-
day .790 -.229 .124
amount drinking water
per day (glass) .279 .758 .453
hours exercise per week .527 .421 -.646
quality of sleep .510 .337 -.708
End of preview
Want to access all the pages? Upload your documents or become a member.