Aerodynamics of Ground Vehicles: CFD Analysis of Trucks and Trailers
VerifiedAdded on 2020/04/13
|31
|3622
|171
Project
AI Summary
This project investigates the aerodynamics of ground vehicles, specifically trucks with trailers, using Computational Fluid Dynamics (CFD). The study focuses on how variations in trailer height and the gap between the cab and trailer impact aerodynamic drag and lift forces. The research employs ANSYS FLUENT software to simulate airflow around the vehicles under steady-state, non-compressible conditions. The methodology involves creating 3D CAD models, meshing the geometry, and applying boundary conditions to simulate different scenarios, including varying trailer heights and cab-trailer gaps. The results are analyzed in terms of pressure and velocity contours, pathlines, and drag/lift coefficients. The project aims to quantify the aerodynamic performance of trucks and trailers and how design choices influence these critical parameters. The analysis includes a baseline case and two variations in trailer height to determine the impact on aerodynamic performance. The findings are presented in terms of drag and lift coefficients and total drag/lift forces. The results demonstrate that changes in trailer height significantly affect the aerodynamic drag experienced by the truck and trailer assembly. The project provides valuable insights into the design considerations for improving the aerodynamic efficiency of heavy vehicles and reducing fuel consumption.
University of Huddersfield
School of Computing and Engineering
Aerodynamics of ground vehicles
Abstract
The pressure distribution occurring on a truck when it is traveling with trailer is investigated using
three dimensional (3D) Computational Fluid Dynamics (CFD). The height of the trailer is varied
keeping the gap between cab and trailer constant and the gap among cab and the trailer is varied
keeping the height constant. Assuming that the comparative velocity of the vehicles has an
insignificant effect on the flow distribution over the both vehicles. The analysis is done using the
steady state with non-compressible condition. Numerical flow around the passenger car because of the
trailer variations, is the subject of present work. C. In this report, the truck is studied with the vehicles
at different variables, with steady flow conditions. Simulation outcomes have been examined and
related in terms of detected values of aerodynamic drag coefficients.
Introduction
In the conventional meaning, reducing the aerodynamic drag is associated with appropriate shaping of
the front and rear of a vehicle, in conjunction with change of the bluff bodied shapes to streamlined
ones. In case of a truck, where a cargo box is located directly behind the cab, there is only one
overpressure zone covering the front face of the cab and an upper part (above the cab) of the cargo
box, and only one zone of underpressure located behind the truck rear face. One of the important
forces that us acting on the vehicle is drag force. This Aerodynamic drag force grow into an important
obstruction at greater speeds and the performance of the vehicle and fuel consumption are greatly
influenced. Since, the aerodynamic drag force always increases proportional to the square of the
speed. The weighty vehicles do cruising at high speed in intercity and take way too much over the
years. The vehicle producers invest too much in aerodynamic studies in order to escalate vehicle
performance. This important step makes the decreasing aerodynamics drag force more important
matter for heavy vehicles which do a large portion of the transportation in and out of the city. In case
of an articulated vehicle there is an additional free clearance gap between the rear face of tractor and
the front face of semi-trailer, resulting in underpressure at rear face of the tractor, and overpressure at
front face of the trailer. In these simulations the main focus was put on determining the effect of
aerodynamic interference processes taking place between tractor, semi-trailer and a passenger car, and
on the aerodynamic drag level. In this study, only primary, rectilinear geometric forms of the tractor
and trailer were considered. The models did not have any roundings or aerodynamic drag reduction
devices. A numerical simulation of flow around vehicles in which truck having different height and
different gap between trailer and cab is achieved using commercial fluid dynamic software ANSYS
FLUENT. The study concentrates on CFD based drag calculation on the car and truck body. A three-
dimensional CAD model of a car and truck is used as the basic model in this report which is created in
the commercial software ANSYS WORKBENCH.
Problem Definition
A CAD geometry of the Truck (cab) with a trailer is need to be analysed for 3 different conditions of
trailer height and calculate the effect of varying height on the drag and lift forces. The design velocity
should be 56mph. The second case is to vary the distance between the cab and the trailer and see how
they reflect on the aerodynamics of the truck. The body of the cab is made separately and then
Paraphrase This Document
Need a fresh take? Get an instant paraphrase of this document with our AI Paraphraser
combined with the geometry of the trailer. Both were assembled using different mating features in
Solidworks.
Methodology
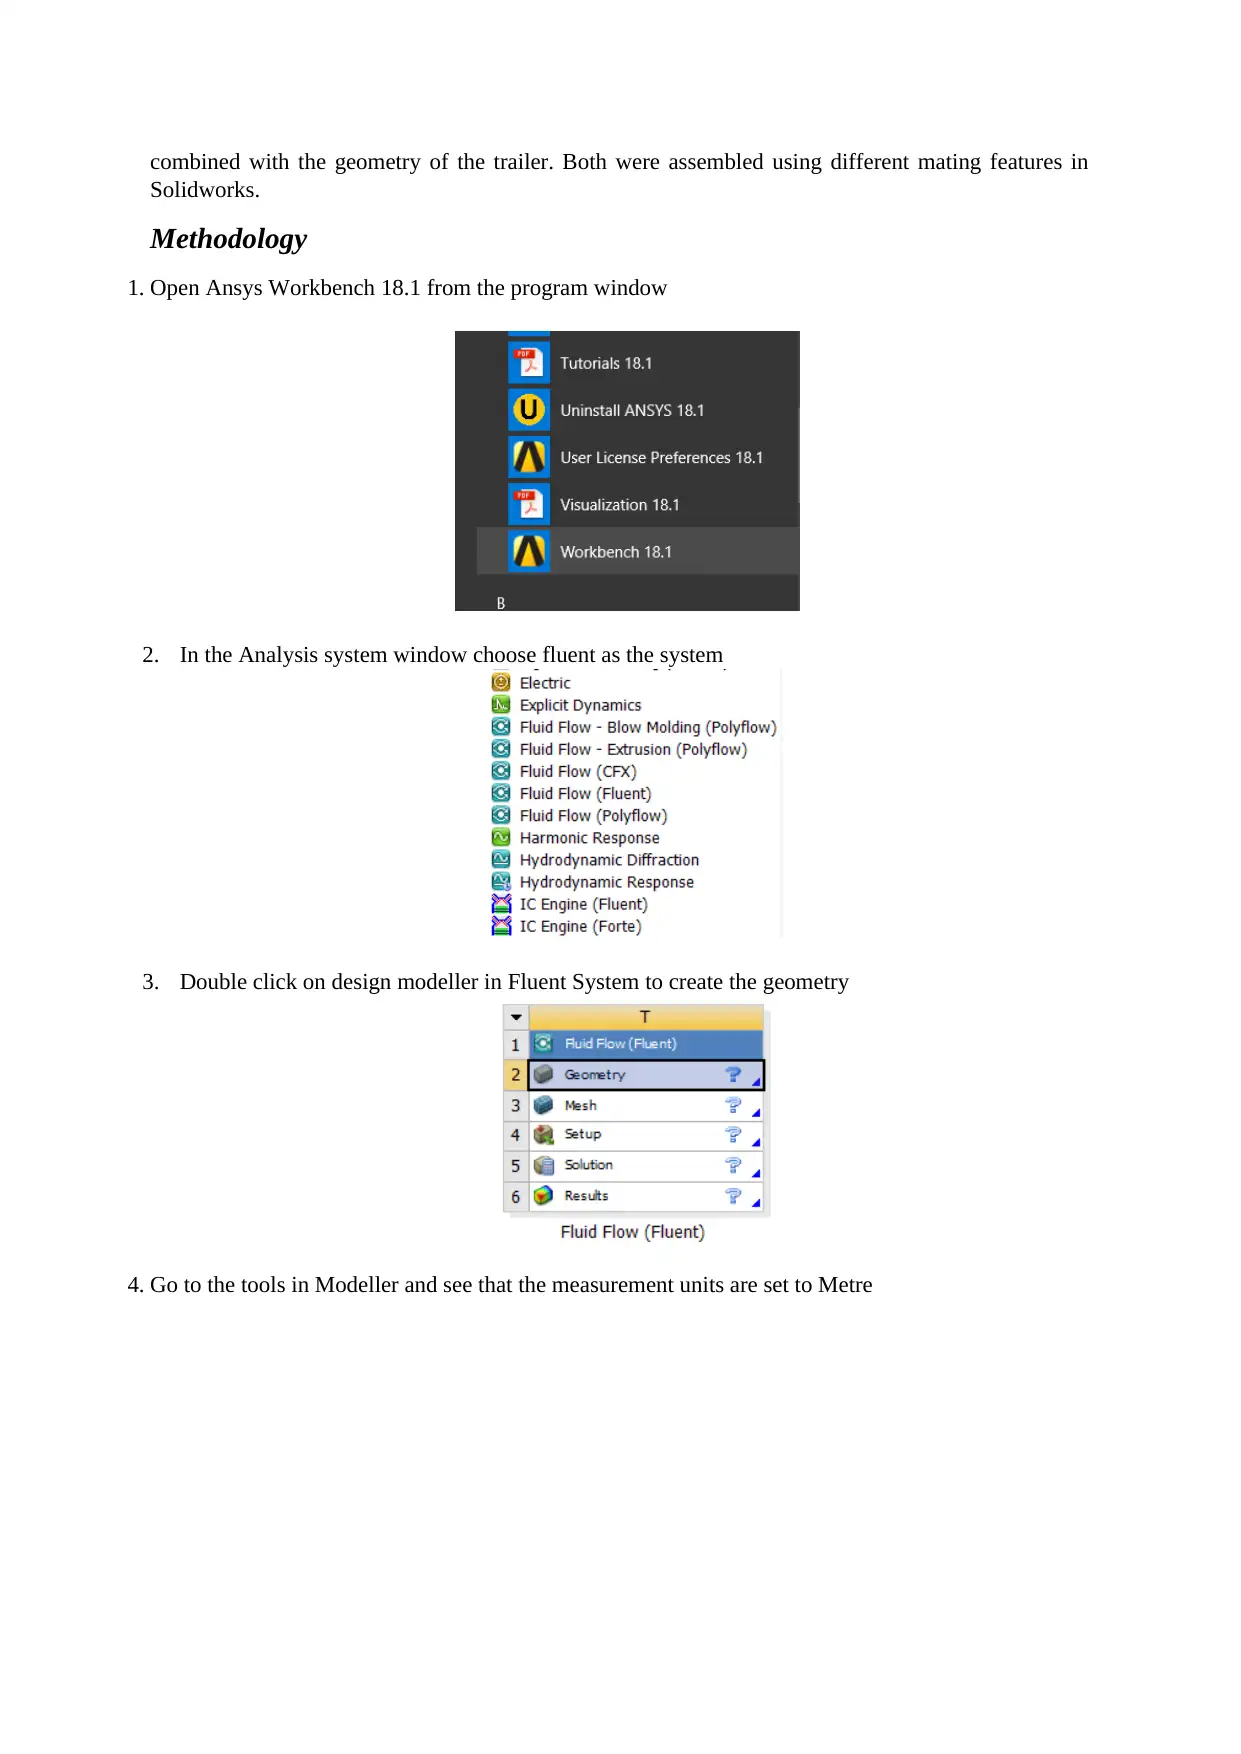
1. Open Ansys Workbench 18.1 from the program window
2. In the Analysis system window choose fluent as the system
3. Double click on design modeller in Fluent System to create the geometry
4. Go to the tools in Modeller and see that the measurement units are set to Metre
Solidworks.
Methodology
1. Open Ansys Workbench 18.1 from the program window
2. In the Analysis system window choose fluent as the system
3. Double click on design modeller in Fluent System to create the geometry
4. Go to the tools in Modeller and see that the measurement units are set to Metre
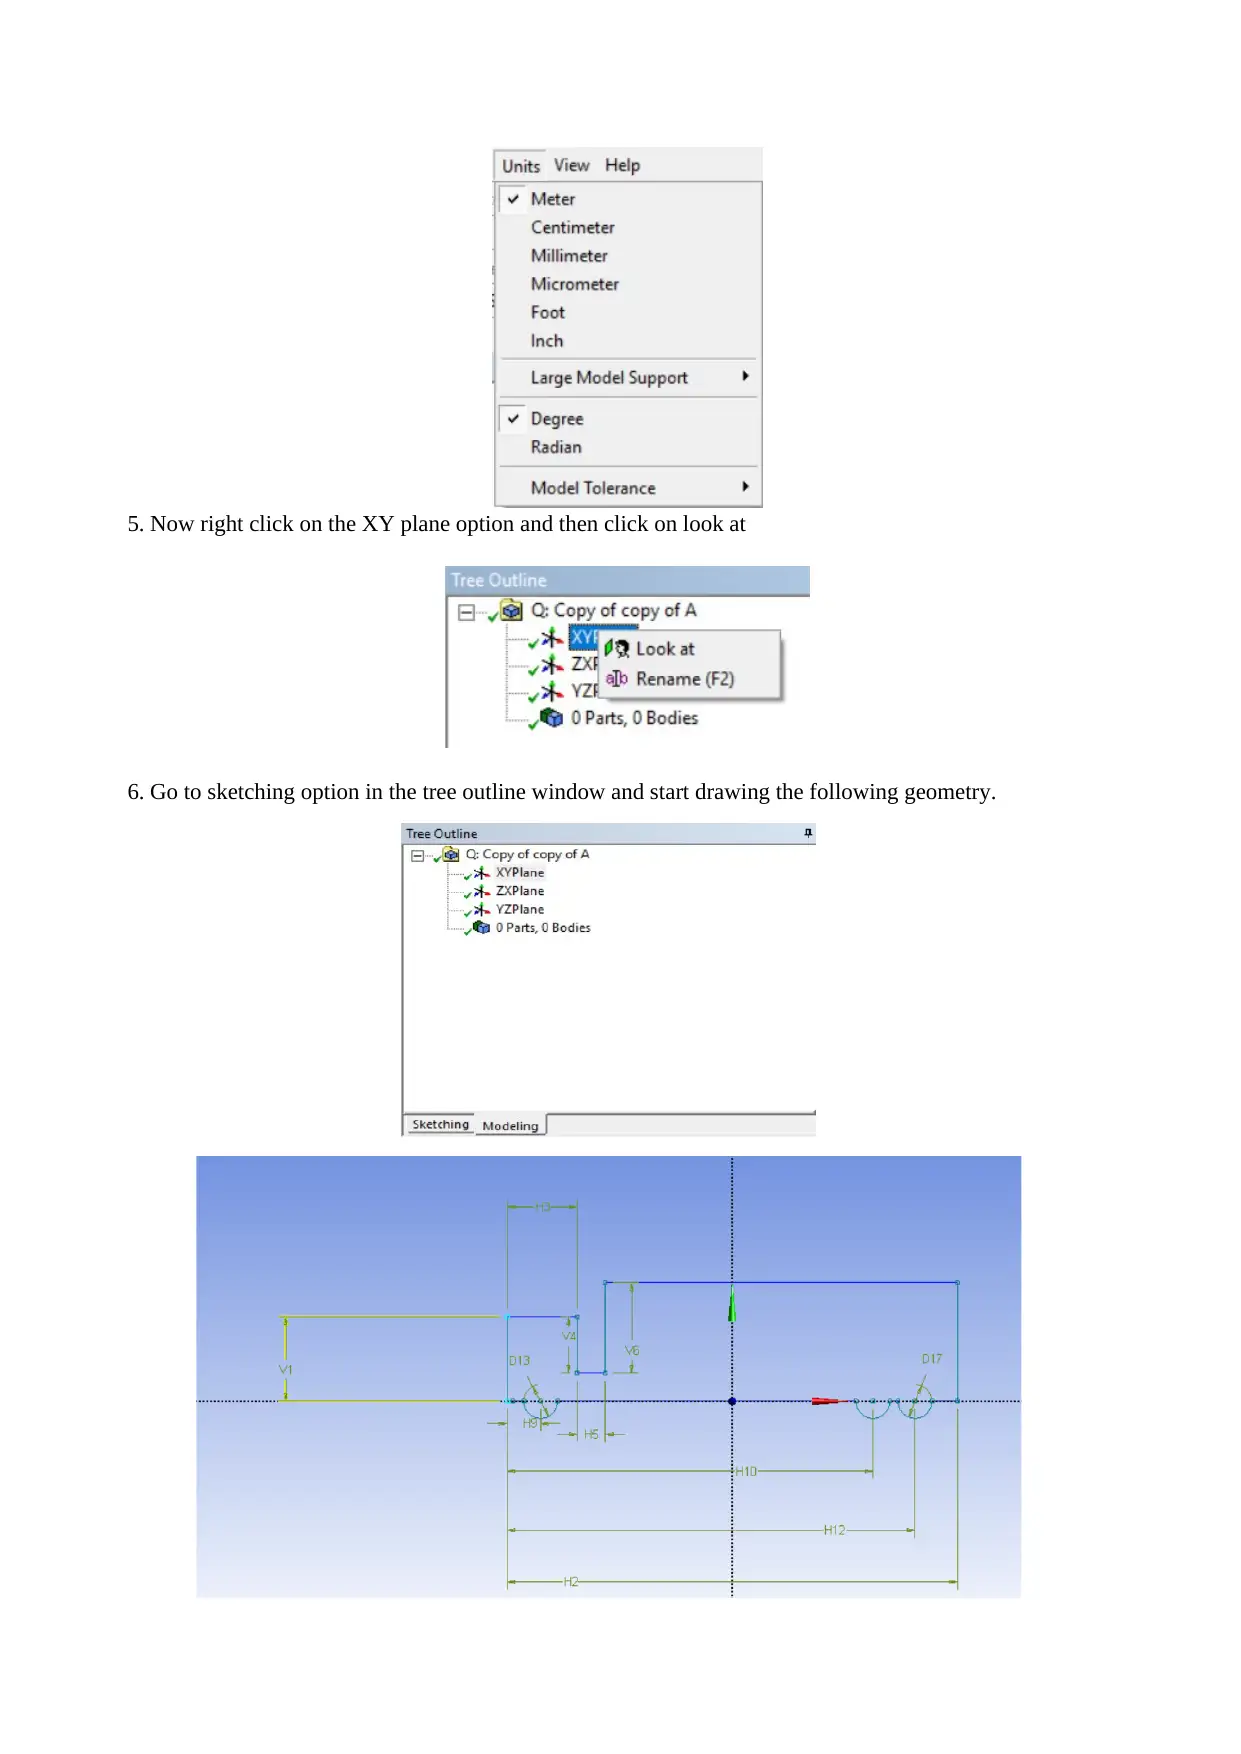
5. Now right click on the XY plane option and then click on look at
6. Go to sketching option in the tree outline window and start drawing the following geometry.
6. Go to sketching option in the tree outline window and start drawing the following geometry.
⊘ This is a preview!⊘
Do you want full access?
Subscribe today to unlock all pages.

Trusted by 1+ million students worldwide
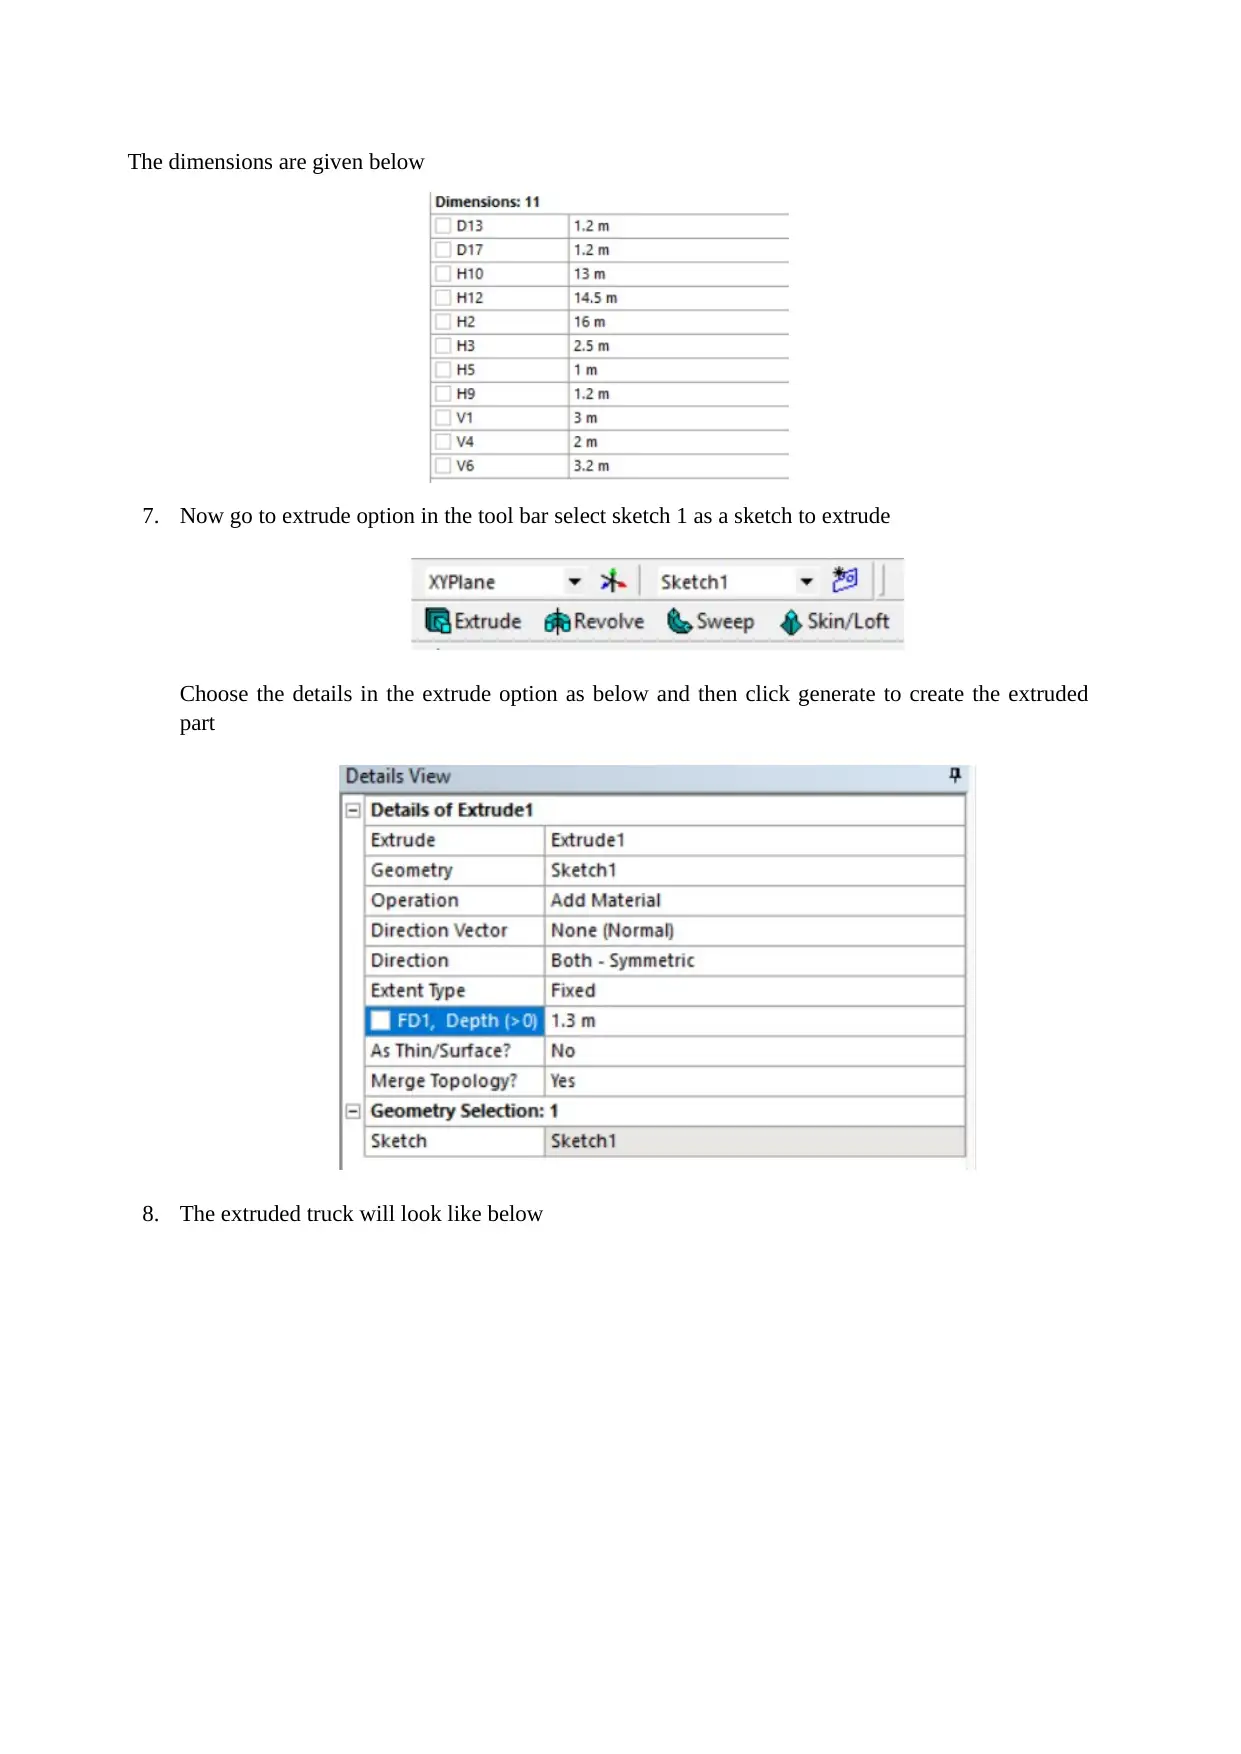
The dimensions are given below
7. Now go to extrude option in the tool bar select sketch 1 as a sketch to extrude
Choose the details in the extrude option as below and then click generate to create the extruded
part
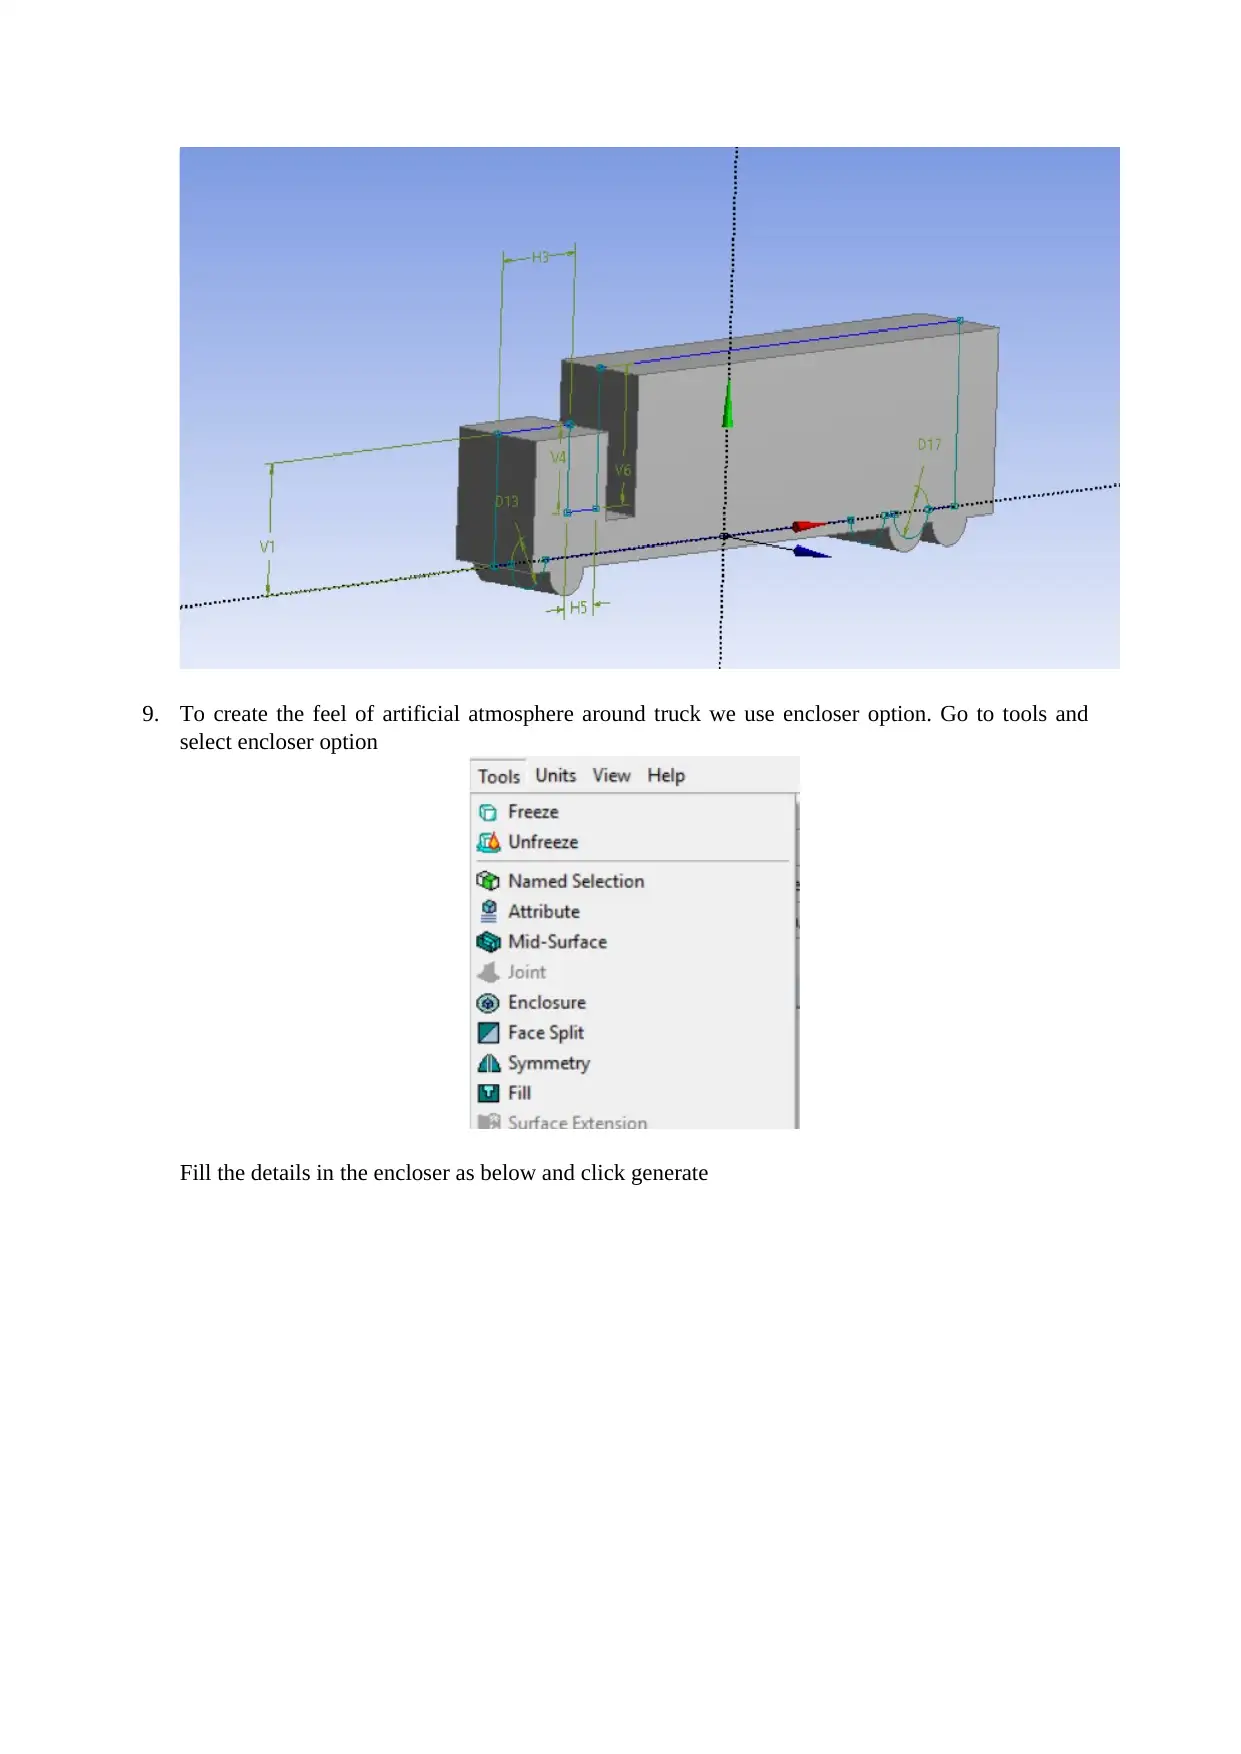
8. The extruded truck will look like below
7. Now go to extrude option in the tool bar select sketch 1 as a sketch to extrude
Choose the details in the extrude option as below and then click generate to create the extruded
part
8. The extruded truck will look like below
Paraphrase This Document
Need a fresh take? Get an instant paraphrase of this document with our AI Paraphraser
9. To create the feel of artificial atmosphere around truck we use encloser option. Go to tools and
select encloser option
Fill the details in the encloser as below and click generate
select encloser option
Fill the details in the encloser as below and click generate
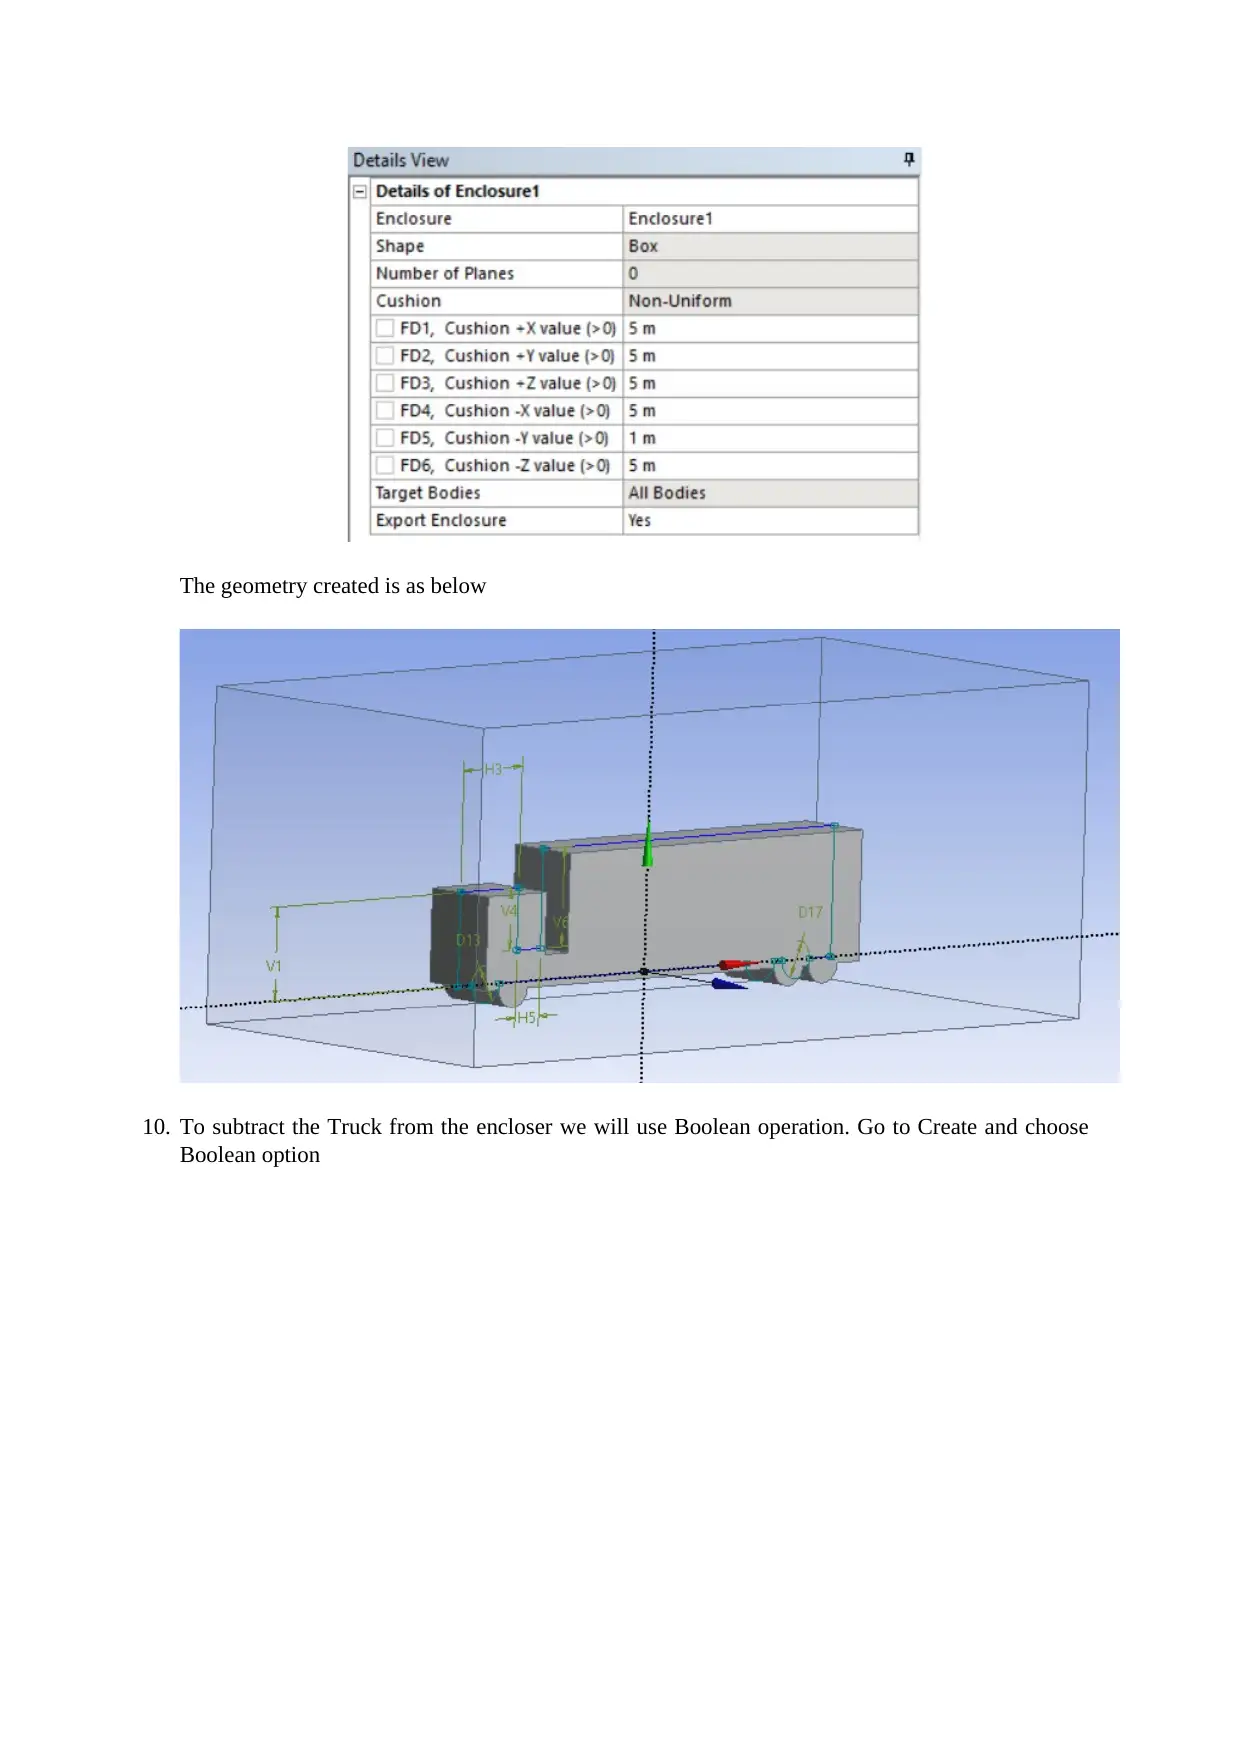
The geometry created is as below
10. To subtract the Truck from the encloser we will use Boolean operation. Go to Create and choose
Boolean option
10. To subtract the Truck from the encloser we will use Boolean operation. Go to Create and choose
Boolean option
⊘ This is a preview!⊘
Do you want full access?
Subscribe today to unlock all pages.

Trusted by 1+ million students worldwide
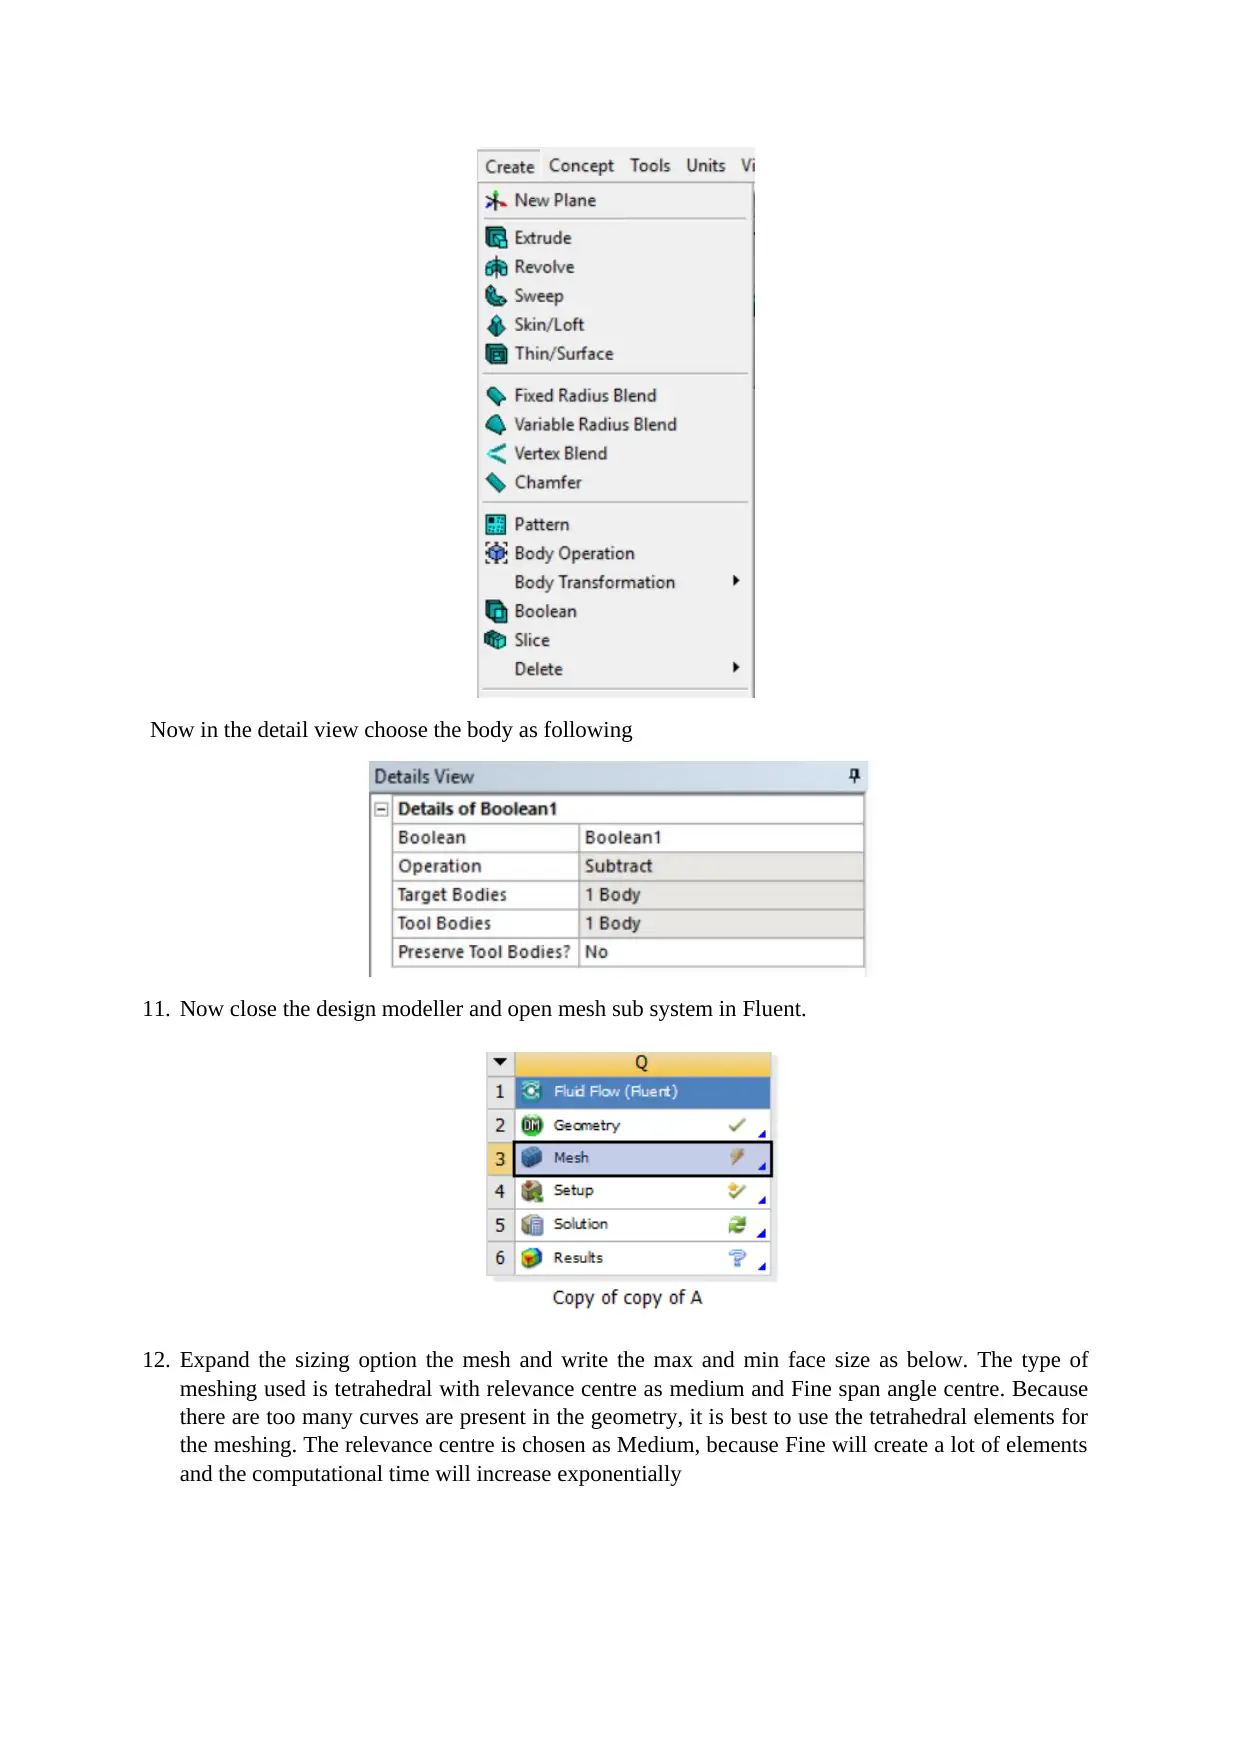
Now in the detail view choose the body as following
11. Now close the design modeller and open mesh sub system in Fluent.
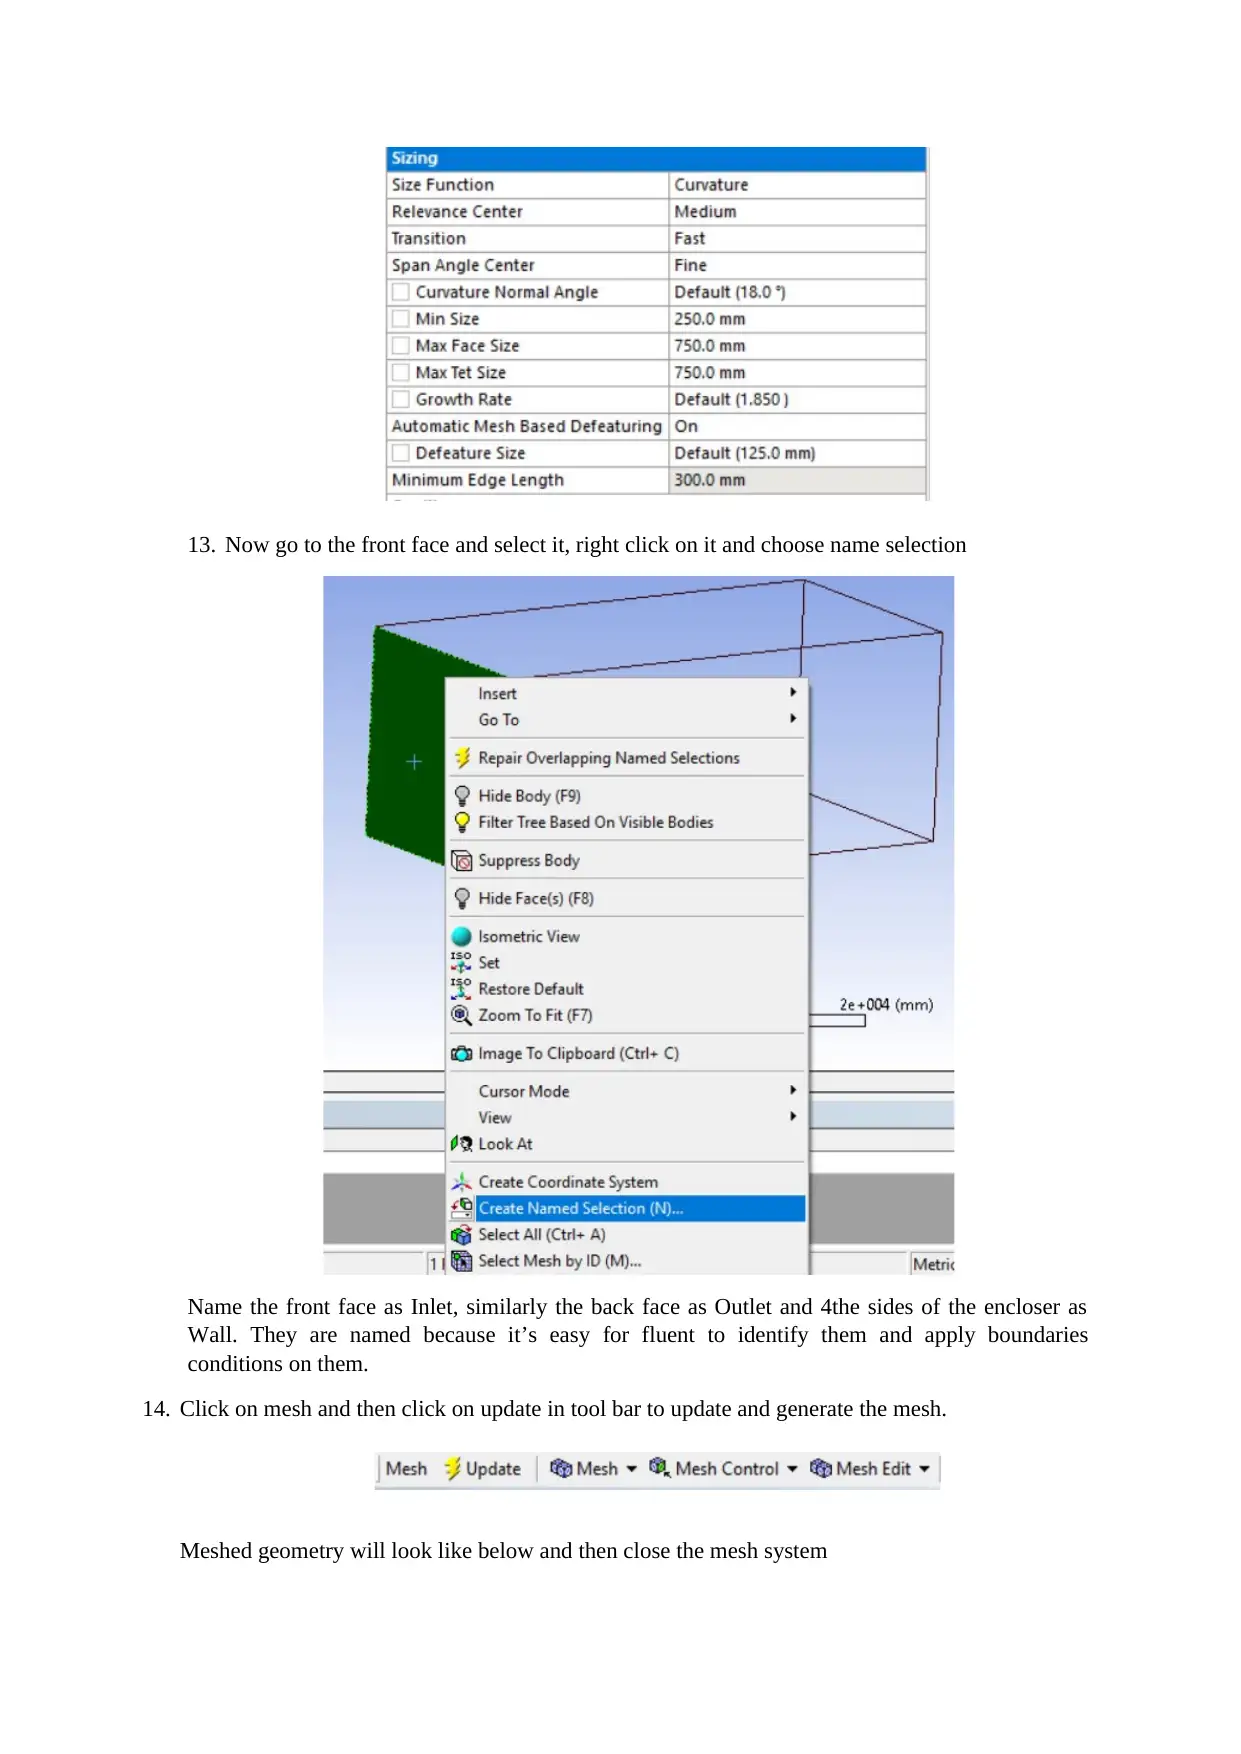
12. Expand the sizing option the mesh and write the max and min face size as below. The type of
meshing used is tetrahedral with relevance centre as medium and Fine span angle centre. Because
there are too many curves are present in the geometry, it is best to use the tetrahedral elements for
the meshing. The relevance centre is chosen as Medium, because Fine will create a lot of elements
and the computational time will increase exponentially
Paraphrase This Document
Need a fresh take? Get an instant paraphrase of this document with our AI Paraphraser
13. Now go to the front face and select it, right click on it and choose name selection
Name the front face as Inlet, similarly the back face as Outlet and 4the sides of the encloser as
Wall. They are named because it’s easy for fluent to identify them and apply boundaries
conditions on them.
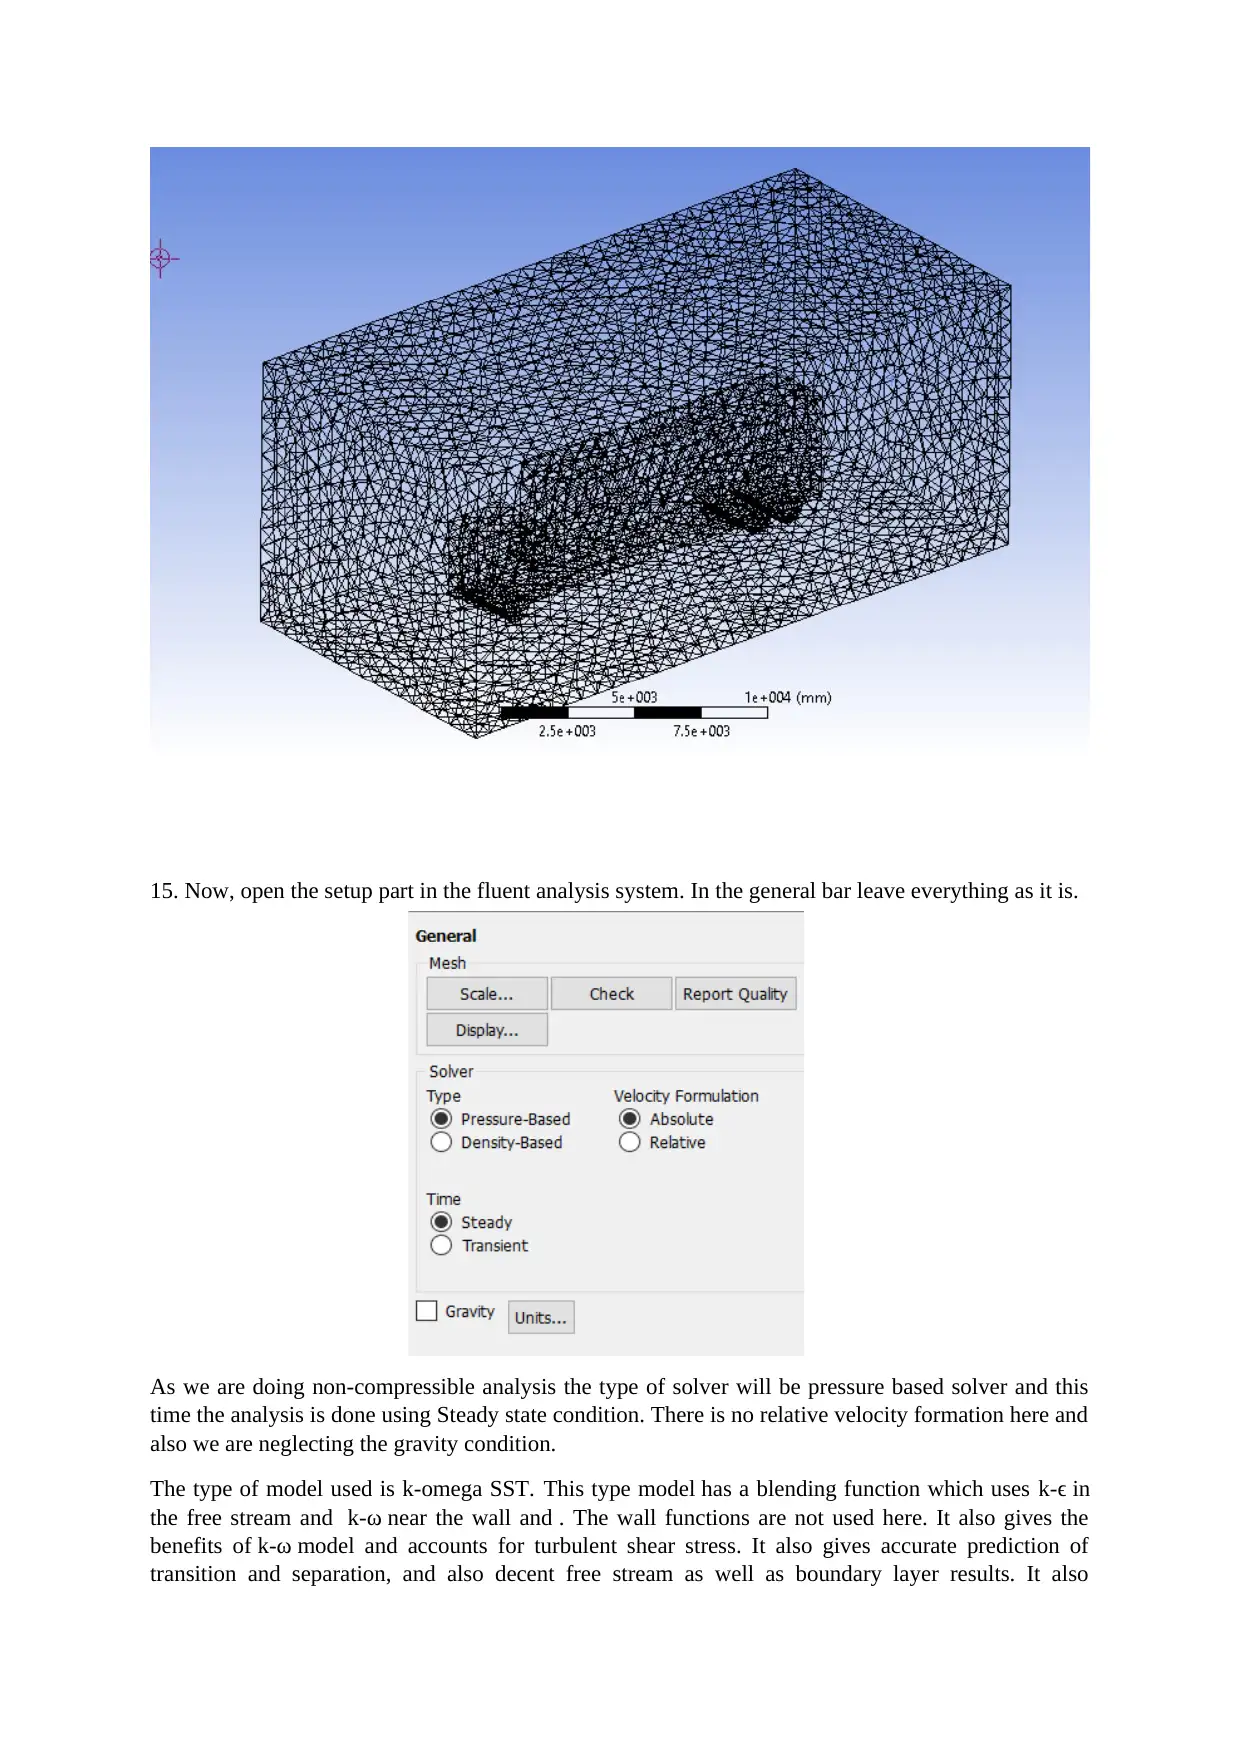
14. Click on mesh and then click on update in tool bar to update and generate the mesh.
Meshed geometry will look like below and then close the mesh system
15. Now, open the setup part in the fluent analysis system. In the general bar leave everything as it is.
As we are doing non-compressible analysis the type of solver will be pressure based solver and this
time the analysis is done using Steady state condition. There is no relative velocity formation here and
also we are neglecting the gravity condition.
The type of model used is k-omega SST. This type model has a blending function which uses k-ϵ in
the free stream and k-ω near the wall and . The wall functions are not used here. It also gives the
benefits of k-ω model and accounts for turbulent shear stress. It also gives accurate prediction of
transition and separation, and also decent free stream as well as boundary layer results. It also
⊘ This is a preview!⊘
Do you want full access?
Subscribe today to unlock all pages.

Trusted by 1+ million students worldwide
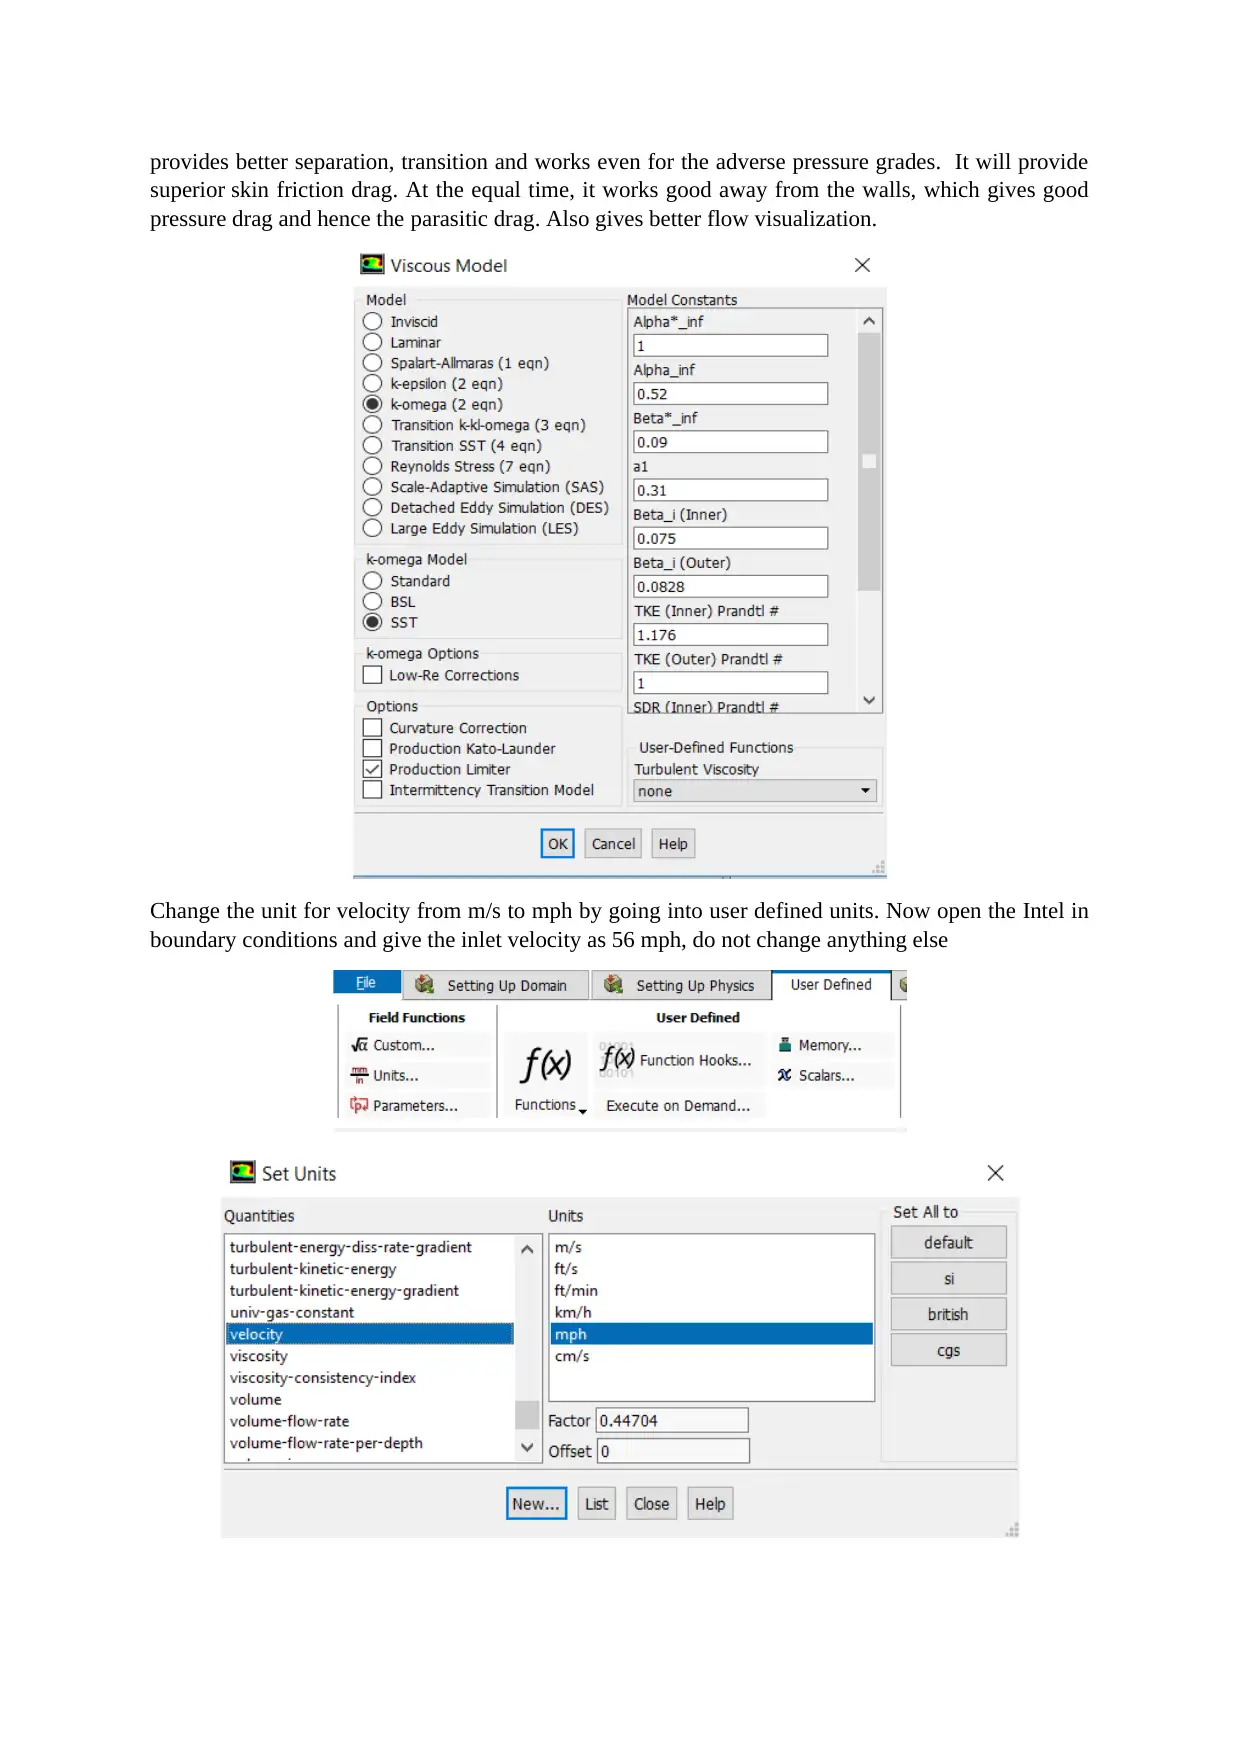
provides better separation, transition and works even for the adverse pressure grades. It will provide
superior skin friction drag. At the equal time, it works good away from the walls, which gives good
pressure drag and hence the parasitic drag. Also gives better flow visualization.
Change the unit for velocity from m/s to mph by going into user defined units. Now open the Intel in
boundary conditions and give the inlet velocity as 56 mph, do not change anything else
Paraphrase This Document
Need a fresh take? Get an instant paraphrase of this document with our AI Paraphraser
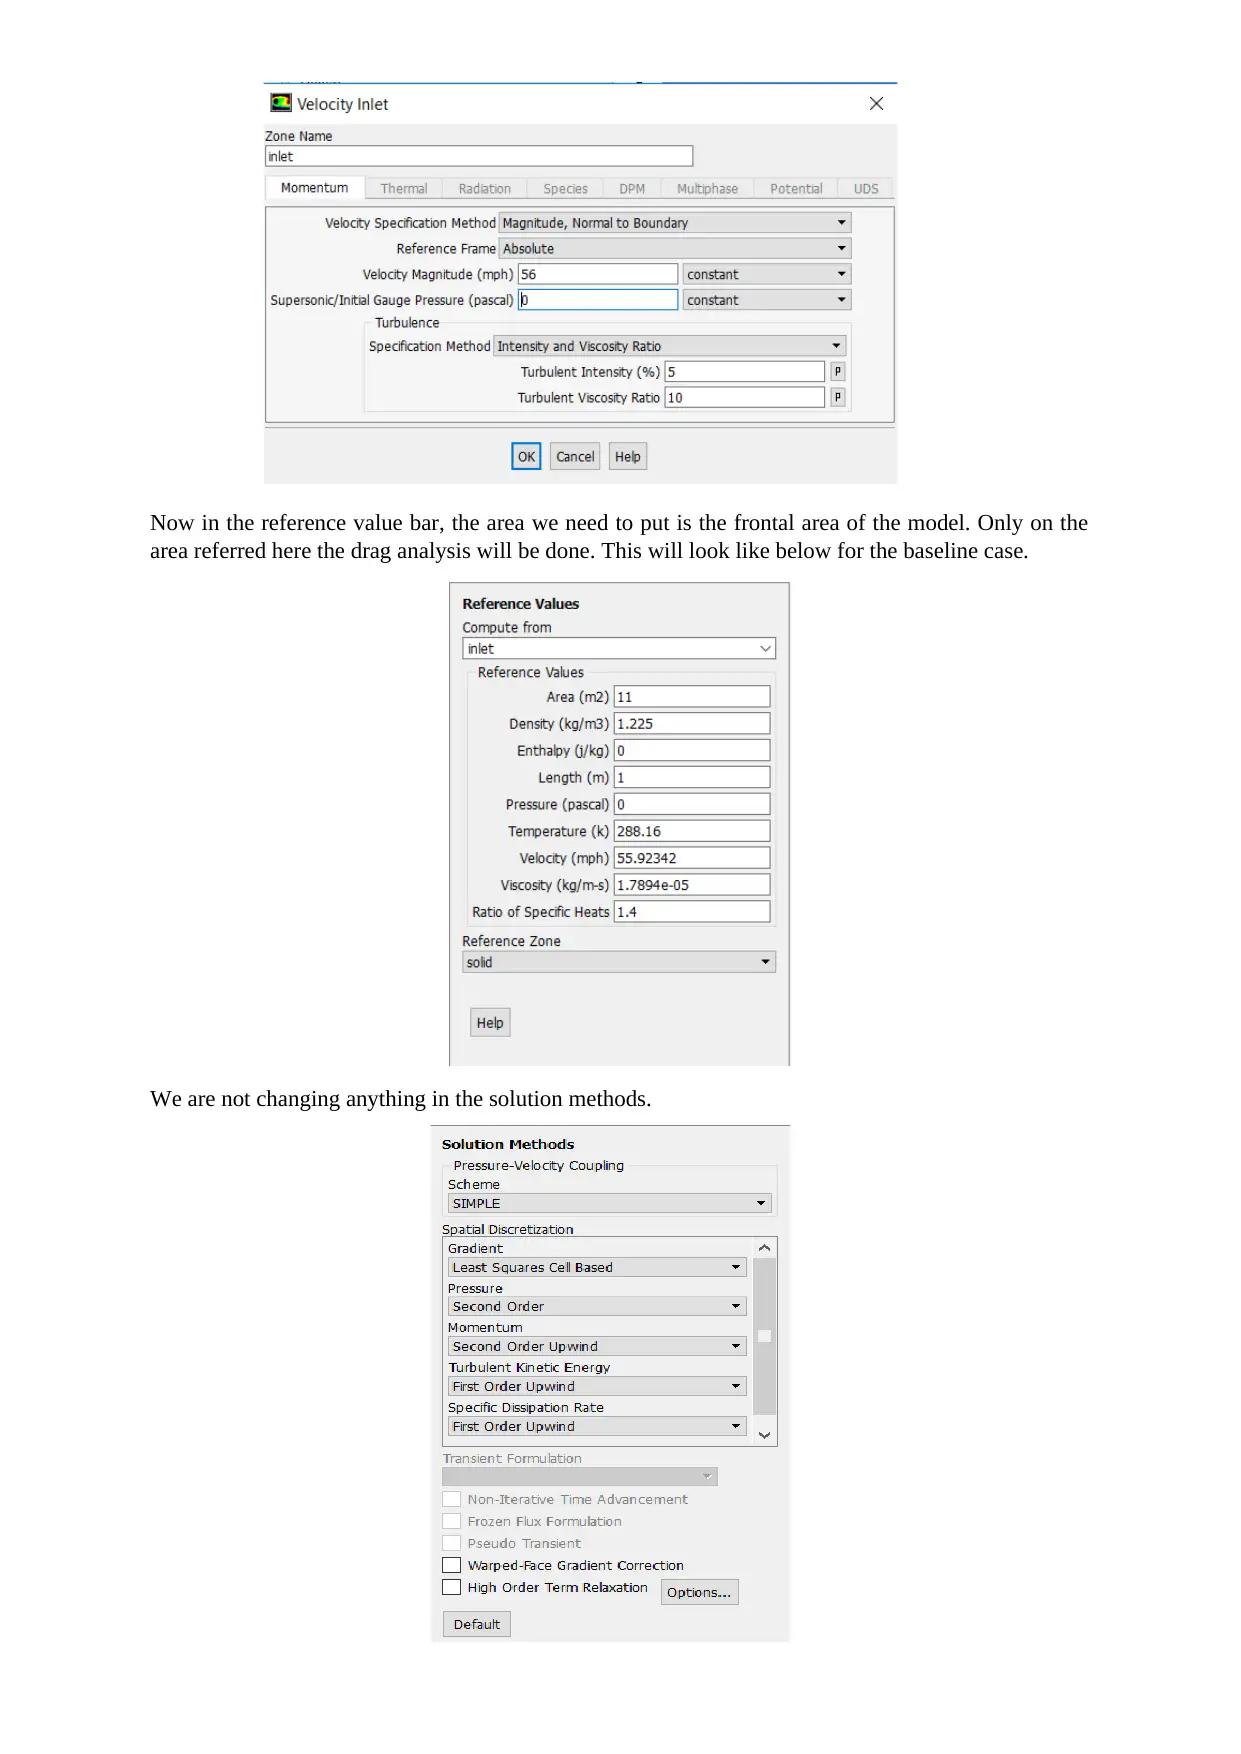
Now in the reference value bar, the area we need to put is the frontal area of the model. Only on the
area referred here the drag analysis will be done. This will look like below for the baseline case.
We are not changing anything in the solution methods.
We are not changing anything in the solution methods We are not changing anything in the solution
methods We are not changing anything in the solution methods We are not changing anything in the
solution methods We are not changing anything in the solution methods We are not changing
anything in the solution methods We are not changing anything in the solution methods We are not
changing anything in the solution methods We are not changing anything in the solution methods We
are not changing anything in the solution methods We are not changing anything in the solution
methods We are not changing anything in the solution methods We are not changing anything in the
solution methods We are not changing anything in the solution methods We are not changing
anything in the solution methods
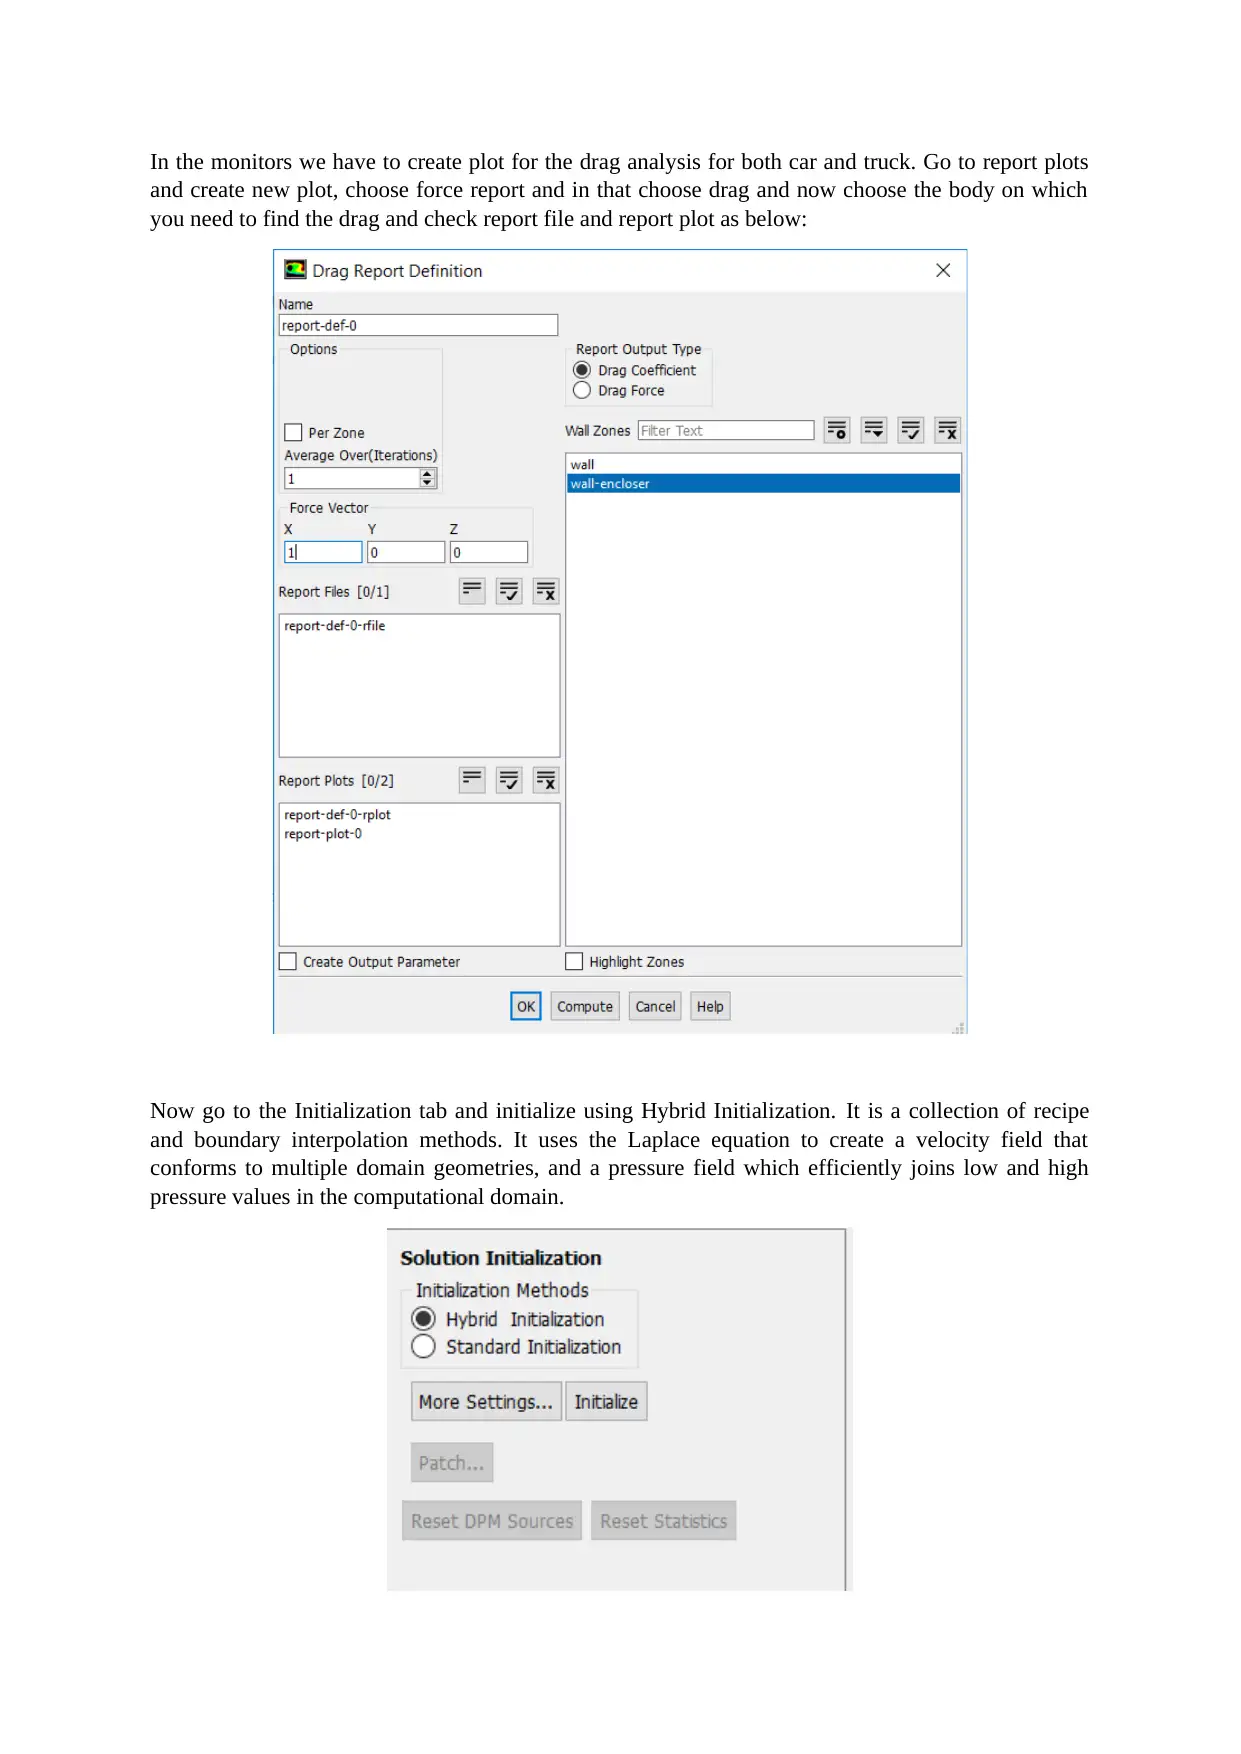
In the monitors we have to create plot for the drag analysis for both car and truck. Go to report plots
and create new plot, choose force report and in that choose drag and now choose the body on which
you need to find the drag and check report file and report plot as below:
Now go to the Initialization tab and initialize using Hybrid Initialization. It is a collection of recipe
and boundary interpolation methods. It uses the Laplace equation to create a velocity field that
conforms to multiple domain geometries, and a pressure field which efficiently joins low and high
pressure values in the computational domain.
⊘ This is a preview!⊘
Do you want full access?
Subscribe today to unlock all pages.

Trusted by 1+ million students worldwide
1 out of 31
Your All-in-One AI-Powered Toolkit for Academic Success.
+13062052269
info@desklib.com
Available 24*7 on WhatsApp / Email
![[object Object]](/_next/static/media/star-bottom.7253800d.svg)
Unlock your academic potential
Copyright © 2020–2025 A2Z Services. All Rights Reserved. Developed and managed by ZUCOL.

