Economic Analysis: Investment Project Techniques and Tools
VerifiedAdded on 2024/05/31
|28
|5207
|184
Report
AI Summary
This report provides a detailed overview of various economic analysis techniques and tools used for evaluating project investments, focusing on their application in assessing the economic performance of a business organization. It covers methods such as Equivalent Uniform Annual Cash Flow (EUAC), Net Present Value (NPV), Internal Rate of Return (IRR), Modified IRR (MIRR), and Cost-Benefit Analysis (CBA). The report includes a case study involving AGL Energy Limited, an integrated energy resource company, evaluating two options for replacing solar energy machines, Frosto solar machine and Agentica solar plant machine, detailing their cash flows and outflows. It also discusses other decision-making models like the Multi-Attribute Decision-Making Model, Analytical Hierarchy Process (AHP), and best practices for business growth, along with sensitivity analysis and non-financial decision-making factors. The analysis recommends investment choices based on profitability and risk assessment, highlighting the importance of considering both financial and non-financial aspects for effective decision-making.

Assignment 1: Applied Project
1
1
Paraphrase This Document
Need a fresh take? Get an instant paraphrase of this document with our AI Paraphraser
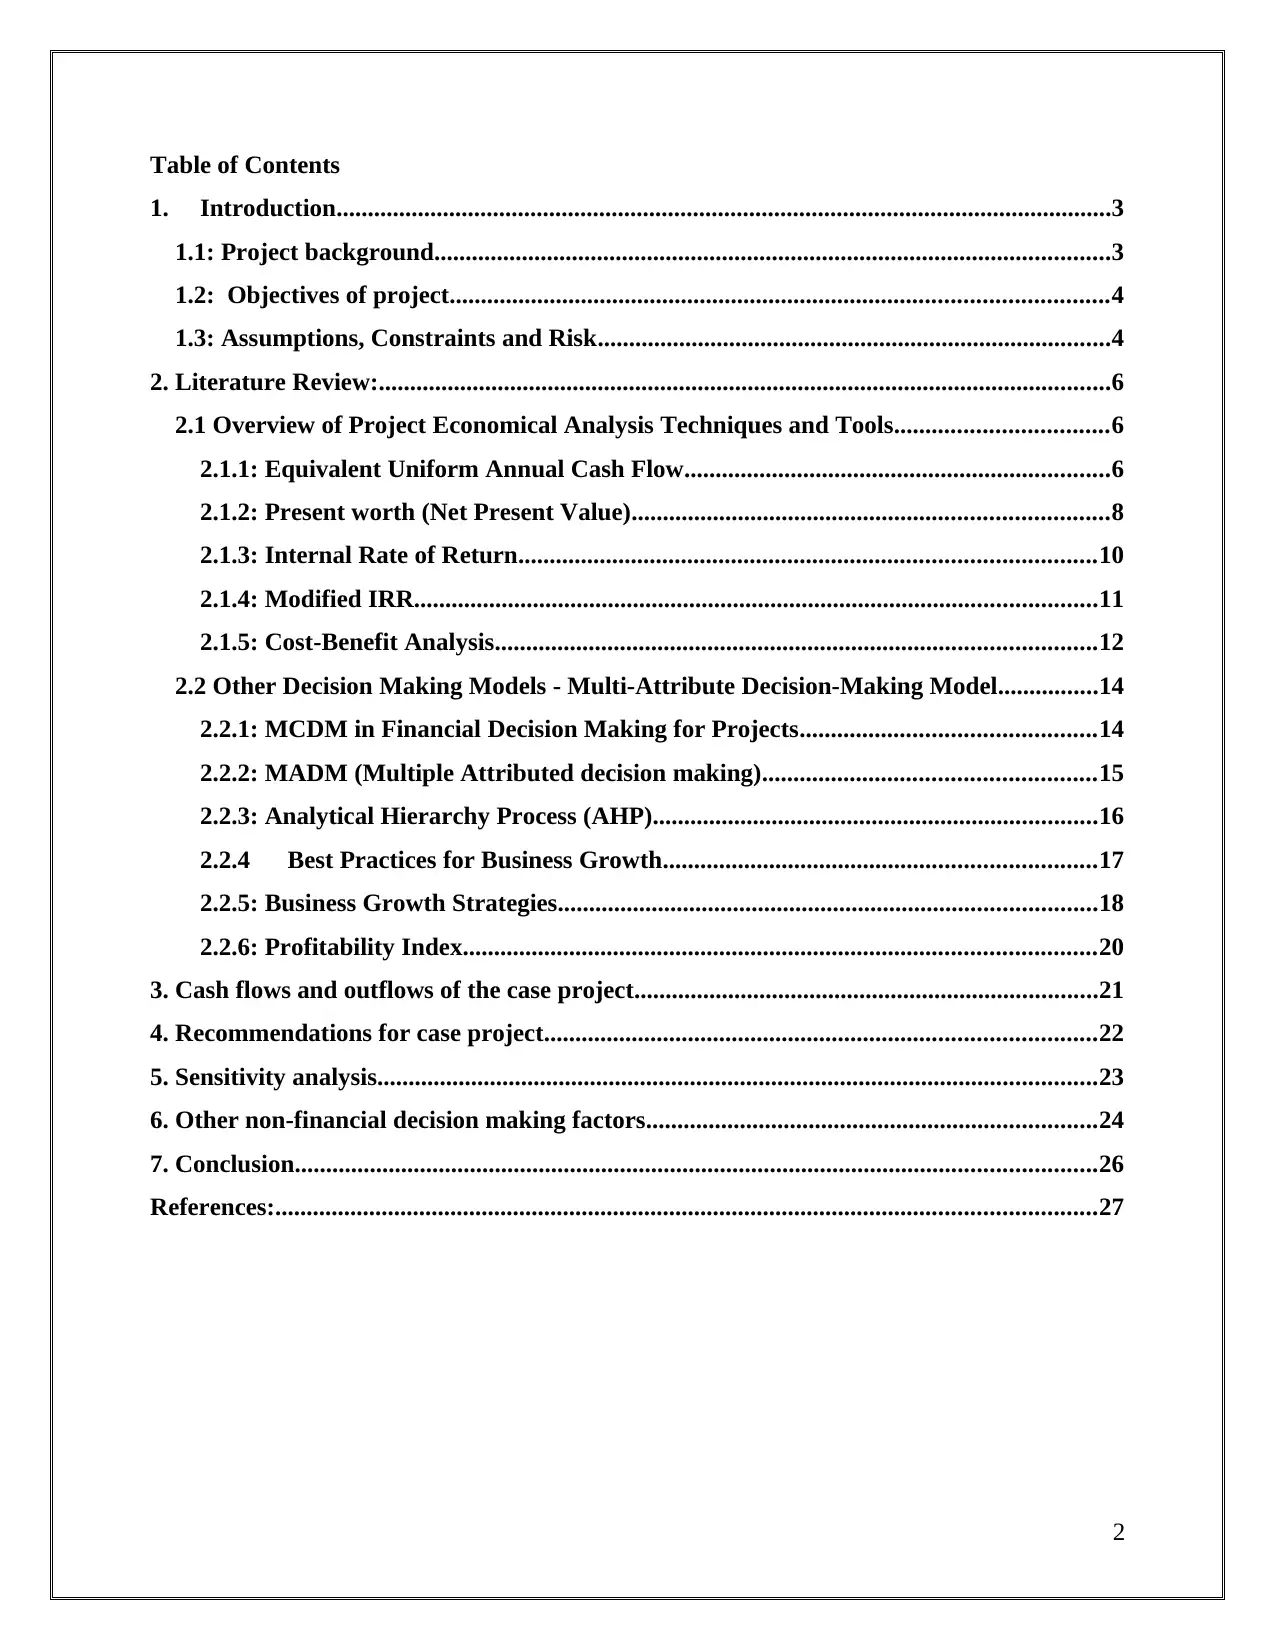
Table of Contents
1. Introduction............................................................................................................................3
1.1: Project background............................................................................................................3
1.2: Objectives of project.........................................................................................................4
1.3: Assumptions, Constraints and Risk..................................................................................4
2. Literature Review:.....................................................................................................................6
2.1 Overview of Project Economical Analysis Techniques and Tools..................................6
2.1.1: Equivalent Uniform Annual Cash Flow....................................................................6
2.1.2: Present worth (Net Present Value)............................................................................8
2.1.3: Internal Rate of Return............................................................................................10
2.1.4: Modified IRR.............................................................................................................11
2.1.5: Cost-Benefit Analysis................................................................................................12
2.2 Other Decision Making Models - Multi-Attribute Decision-Making Model................14
2.2.1: MCDM in Financial Decision Making for Projects...............................................14
2.2.2: MADM (Multiple Attributed decision making).....................................................15
2.2.3: Analytical Hierarchy Process (AHP).......................................................................16
2.2.4 Best Practices for Business Growth.....................................................................17
2.2.5: Business Growth Strategies......................................................................................18
2.2.6: Profitability Index.....................................................................................................20
3. Cash flows and outflows of the case project..........................................................................21
4. Recommendations for case project........................................................................................22
5. Sensitivity analysis...................................................................................................................23
6. Other non-financial decision making factors........................................................................24
7. Conclusion................................................................................................................................26
References:...................................................................................................................................27
2
1. Introduction:
The report helps the users in developing the knowledge about various techniques available for
economic analysis while considering the economic performance of a business organization. The
use of these techniques will help ten organization in assessing the profitability and adequacy of
funding operating along with the allocation of various resources in an organization.
1.1: Project background:
The company AGL energy limited in an integrated energy resource company which is engaged
in providing gas, electricity and related products along with the various services to its customers.
The operations of the company are extending to retail and wholesale marketing in Australia. The
company utilizes various types of solar energy machines which are helpful in generating
electricity through thermal, natural gas and storage along with wind power generation plants.
The solar energy machines being used by the company has to be replaced in about 5 years and
this has been a major issue of capital budgeting decision for the management of the company
(Creemers, 2017).
Analysing the current investment available for the company, there are two options one of which
sin associated with purchasing the machine from the supplier of Germany and the machine name
is Frosto solar machine and the other option is concerned with purchasing the machine from
North Asia region in which Agentica solar plant machine will be purchased. Both of these
investment options has their cash flows as described below:
Project A Project B
Particulars Amount AUD Amount AUD
Income Year 1 350000 400000
Income Year 2 250000 360000
Income Year 3 230000 320000
Income Year 4 200000 305000
Income Year 5 180000 300000
Income Year 6 170000 280000
Income Year 7 160000 150000
Total Incomes 1540000 2115000
Investment at Initial Level 1000000 1400000
3
⊘ This is a preview!⊘
Do you want full access?
Subscribe today to unlock all pages.
Trusted by 1+ million students worldwide
The discount rate has been considered to be 12% in both the cases while considering the market
interest rate and the risk prevailing in the economy.
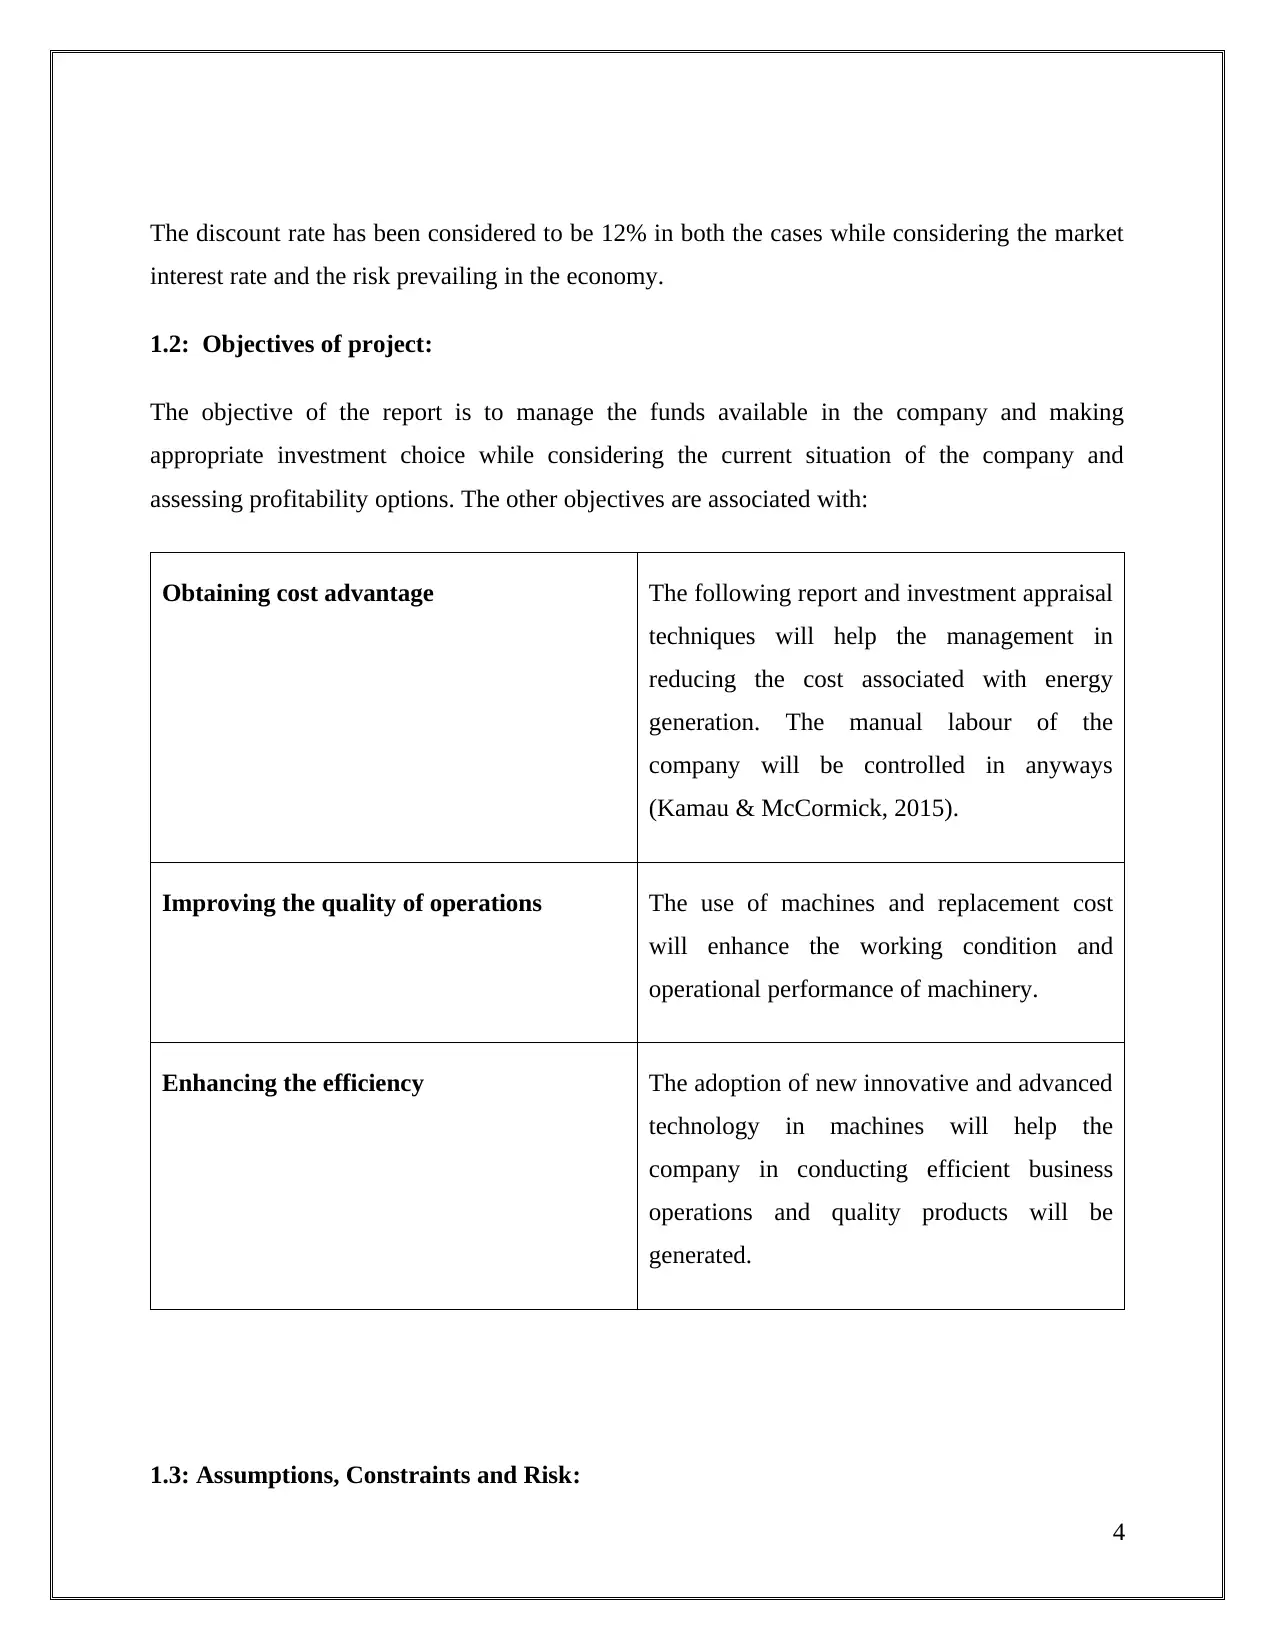
1.2: Objectives of project:
The objective of the report is to manage the funds available in the company and making
appropriate investment choice while considering the current situation of the company and
assessing profitability options. The other objectives are associated with:
Obtaining cost advantage The following report and investment appraisal
techniques will help the management in
reducing the cost associated with energy
generation. The manual labour of the
company will be controlled in anyways
(Kamau & McCormick, 2015).
Improving the quality of operations The use of machines and replacement cost
will enhance the working condition and
operational performance of machinery.
Enhancing the efficiency The adoption of new innovative and advanced
technology in machines will help the
company in conducting efficient business
operations and quality products will be
generated.
1.3: Assumptions, Constraints and Risk:
4
interest rate and the risk prevailing in the economy.
1.2: Objectives of project:
The objective of the report is to manage the funds available in the company and making
appropriate investment choice while considering the current situation of the company and
assessing profitability options. The other objectives are associated with:
Obtaining cost advantage The following report and investment appraisal
techniques will help the management in
reducing the cost associated with energy
generation. The manual labour of the
company will be controlled in anyways
(Kamau & McCormick, 2015).
Improving the quality of operations The use of machines and replacement cost
will enhance the working condition and
operational performance of machinery.
Enhancing the efficiency The adoption of new innovative and advanced
technology in machines will help the
company in conducting efficient business
operations and quality products will be
generated.
1.3: Assumptions, Constraints and Risk:
4
Paraphrase This Document
Need a fresh take? Get an instant paraphrase of this document with our AI Paraphraser

The discount rate which has to be considered for considering the value of money has been 12%
for both the projects as the alternative investment plan will yield a return of 12% to the company.
The management has a perception that the machine will allow the company to conduct the more
productive operations and wastages can be minimized by generating higher returns for the
company. The operational performance of the machines does not require any high set of skilled
technical knowledge among the staff and this will allow for better operational productivity.
Variations between expected and actual:
The expected inflow can be subjected to certain types of market changes which can affect the
future profitability of the project. The various factors present in the micro as well as the macro
environment of the company will affect the future cash inflows and outflows concerned with the
project.
5
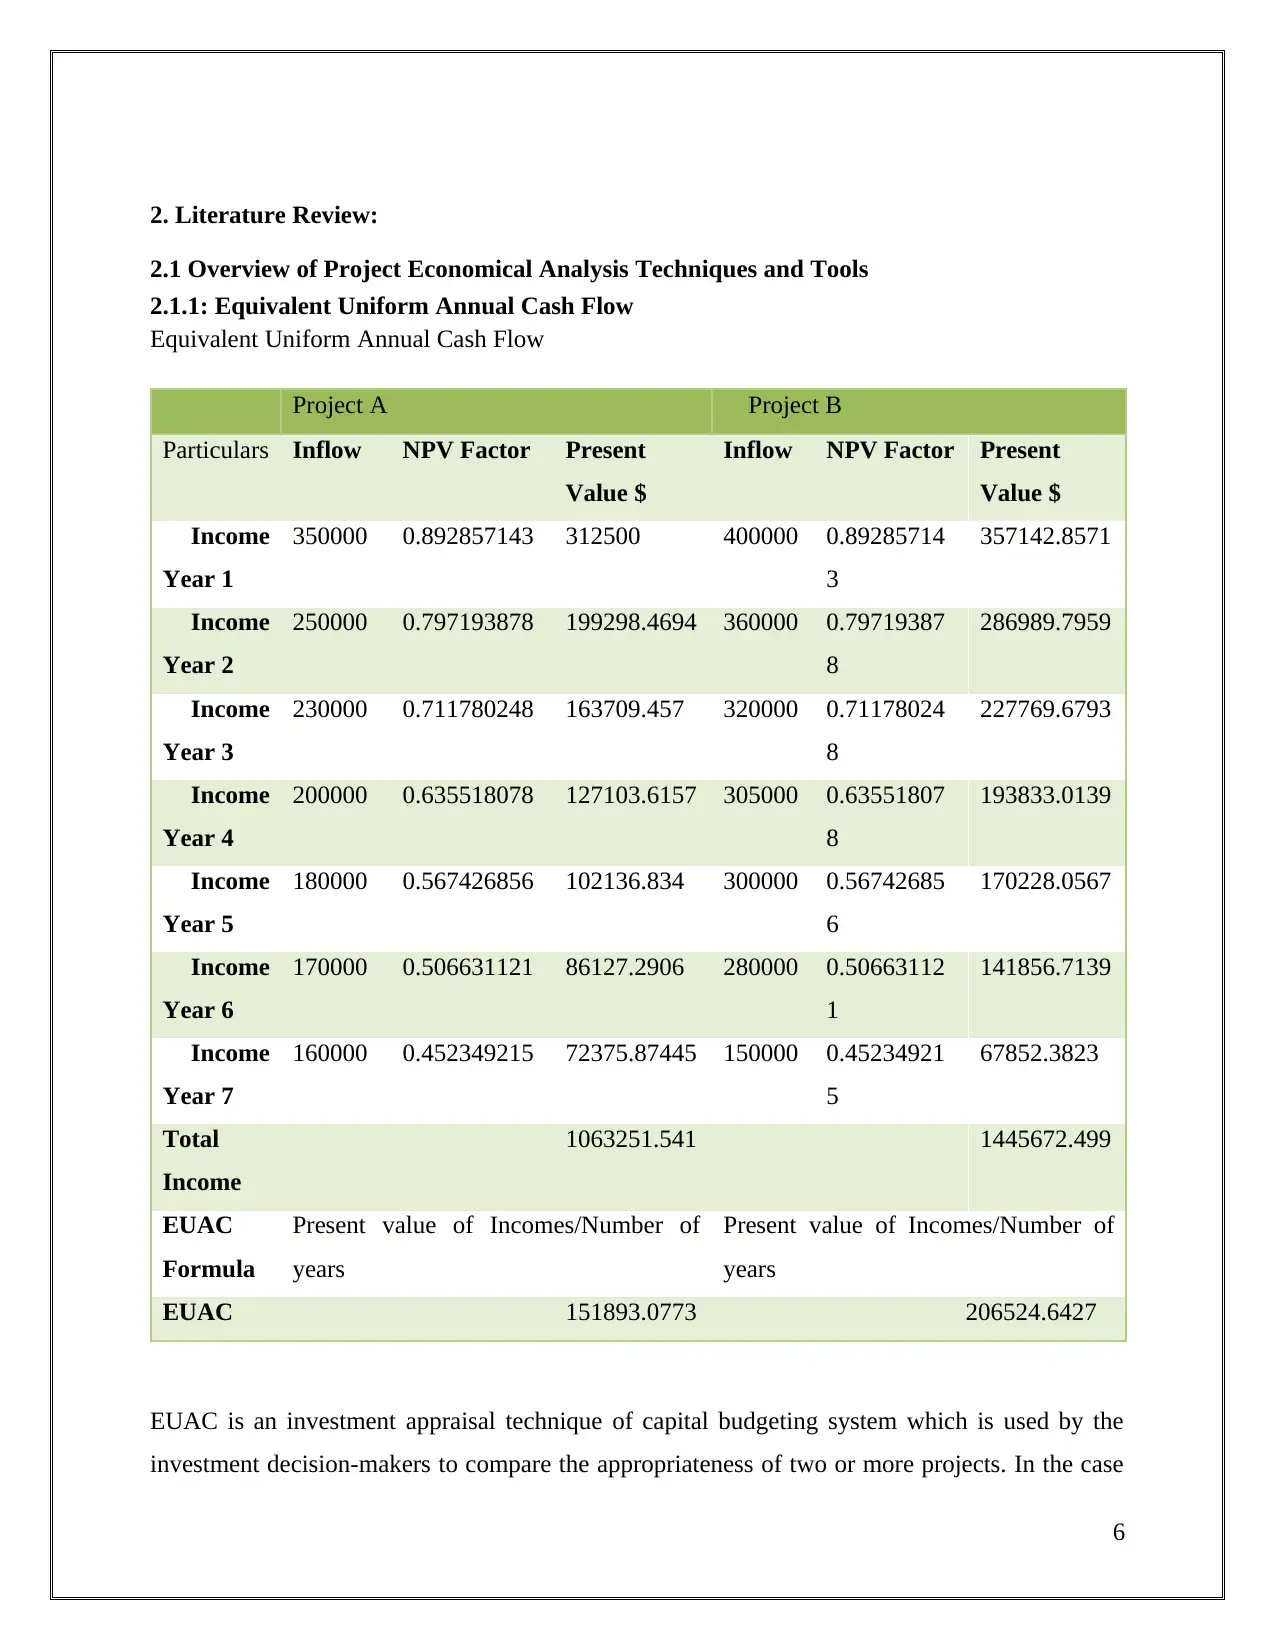
2. Literature Review:
2.1 Overview of Project Economical Analysis Techniques and Tools
2.1.1: Equivalent Uniform Annual Cash Flow
Equivalent Uniform Annual Cash Flow
Project A Project B
Particulars Inflow NPV Factor Present
Value $
Inflow NPV Factor Present
Value $
Income
Year 1
350000 0.892857143 312500 400000 0.89285714
3
357142.8571
Income
Year 2
250000 0.797193878 199298.4694 360000 0.79719387
8
286989.7959
Income
Year 3
230000 0.711780248 163709.457 320000 0.71178024
8
227769.6793
Income
Year 4
200000 0.635518078 127103.6157 305000 0.63551807
8
193833.0139
Income
Year 5
180000 0.567426856 102136.834 300000 0.56742685
6
170228.0567
Income
Year 6
170000 0.506631121 86127.2906 280000 0.50663112
1
141856.7139
Income
Year 7
160000 0.452349215 72375.87445 150000 0.45234921
5
67852.3823
Total
Income
1063251.541 1445672.499
EUAC
Formula
Present value of Incomes/Number of
years
Present value of Incomes/Number of
years
EUAC 151893.0773 206524.6427
EUAC is an investment appraisal technique of capital budgeting system which is used by the
investment decision-makers to compare the appropriateness of two or more projects. In the case
6
⊘ This is a preview!⊘
Do you want full access?
Subscribe today to unlock all pages.
Trusted by 1+ million students worldwide

of two different projects which have different useful life and cash inflows, this approach is used
to find out a uniform cash inflow for comparison purpose (Bhandari & Adams, 2017). In above
case, both concerned projects have different cash inflows in subsequent years and EUAC is
showing a uniform cash inflow so that managers of AGL can select more appropriate investment
option for machinery update.
7
Paraphrase This Document
Need a fresh take? Get an instant paraphrase of this document with our AI Paraphraser
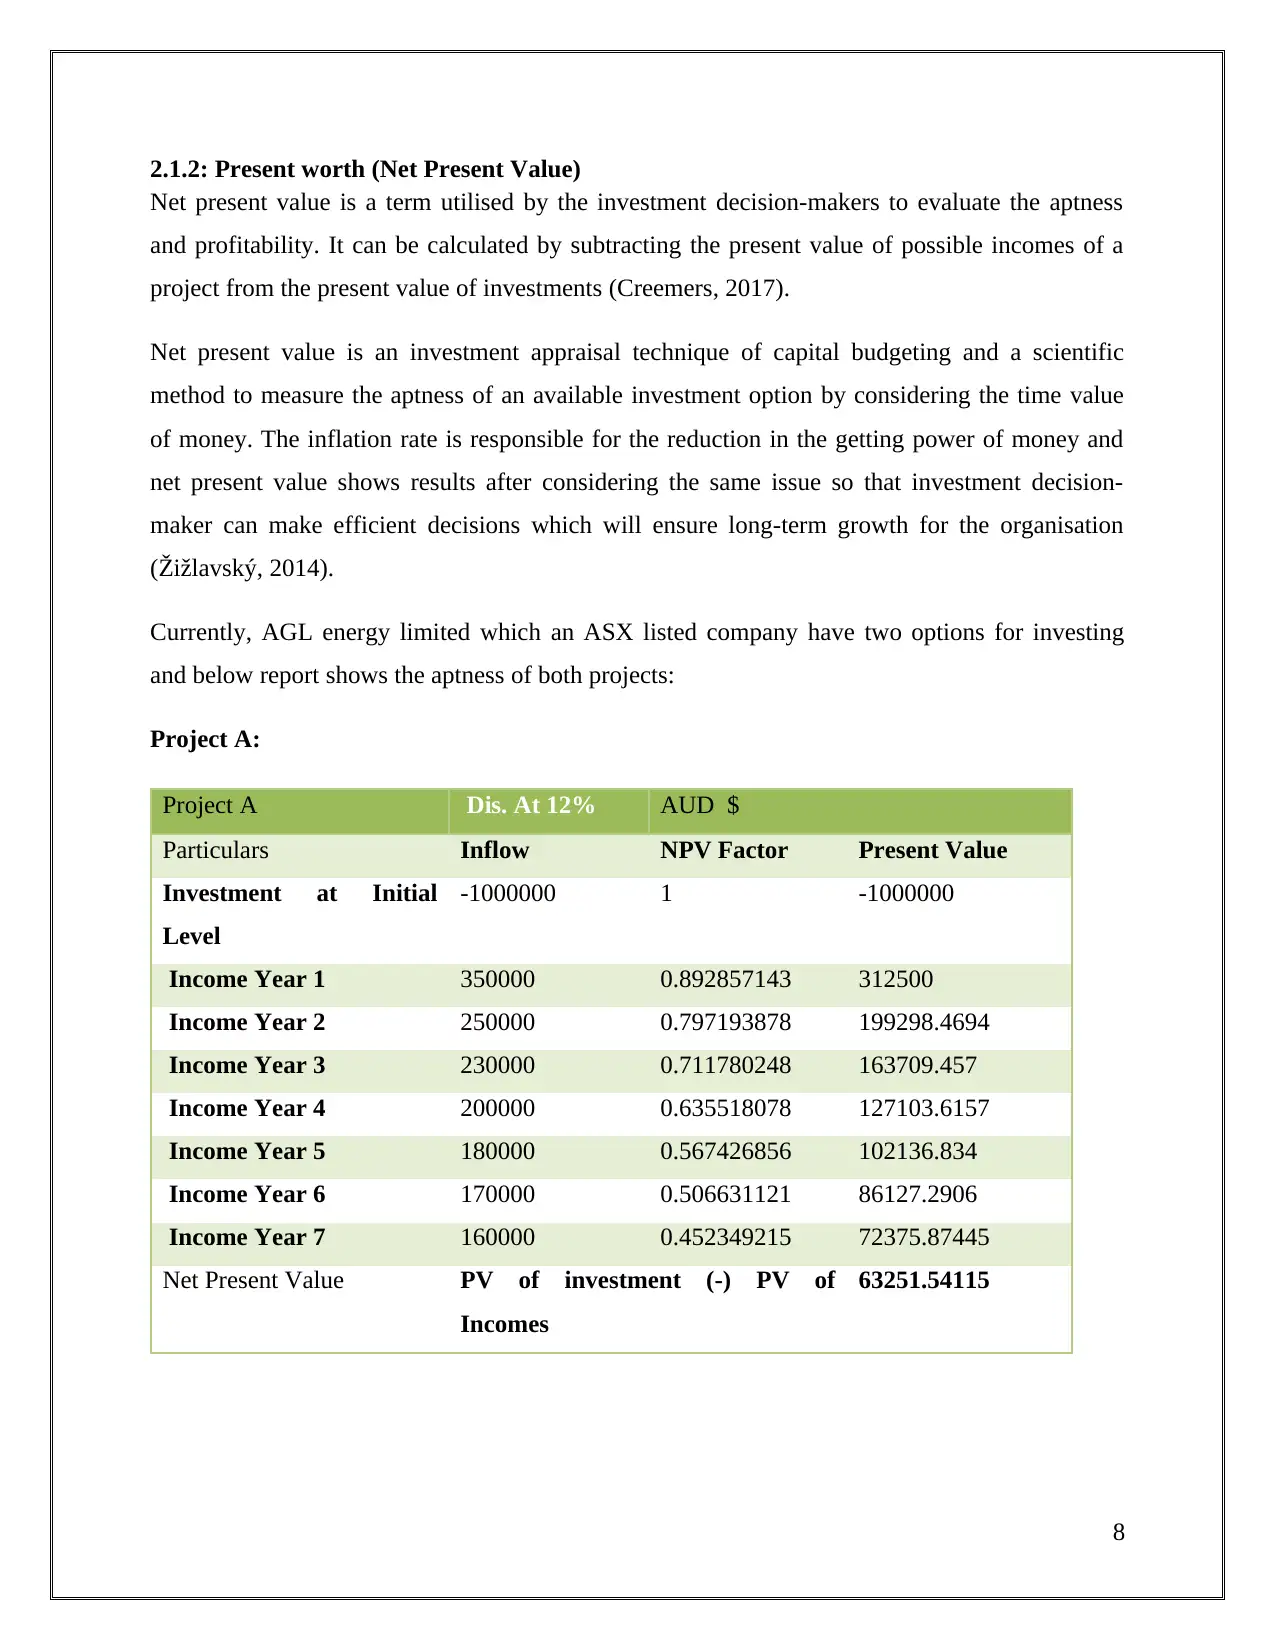
2.1.2: Present worth (Net Present Value)
Net present value is a term utilised by the investment decision-makers to evaluate the aptness
and profitability. It can be calculated by subtracting the present value of possible incomes of a
project from the present value of investments (Creemers, 2017).
Net present value is an investment appraisal technique of capital budgeting and a scientific
method to measure the aptness of an available investment option by considering the time value
of money. The inflation rate is responsible for the reduction in the getting power of money and
net present value shows results after considering the same issue so that investment decision-
maker can make efficient decisions which will ensure long-term growth for the organisation
(Žižlavský, 2014).
Currently, AGL energy limited which an ASX listed company have two options for investing
and below report shows the aptness of both projects:
Project A:
Project A Dis. At 12% AUD $
Particulars Inflow NPV Factor Present Value
Investment at Initial
Level
-1000000 1 -1000000
Income Year 1 350000 0.892857143 312500
Income Year 2 250000 0.797193878 199298.4694
Income Year 3 230000 0.711780248 163709.457
Income Year 4 200000 0.635518078 127103.6157
Income Year 5 180000 0.567426856 102136.834
Income Year 6 170000 0.506631121 86127.2906
Income Year 7 160000 0.452349215 72375.87445
Net Present Value PV of investment (-) PV of
Incomes
63251.54115
8
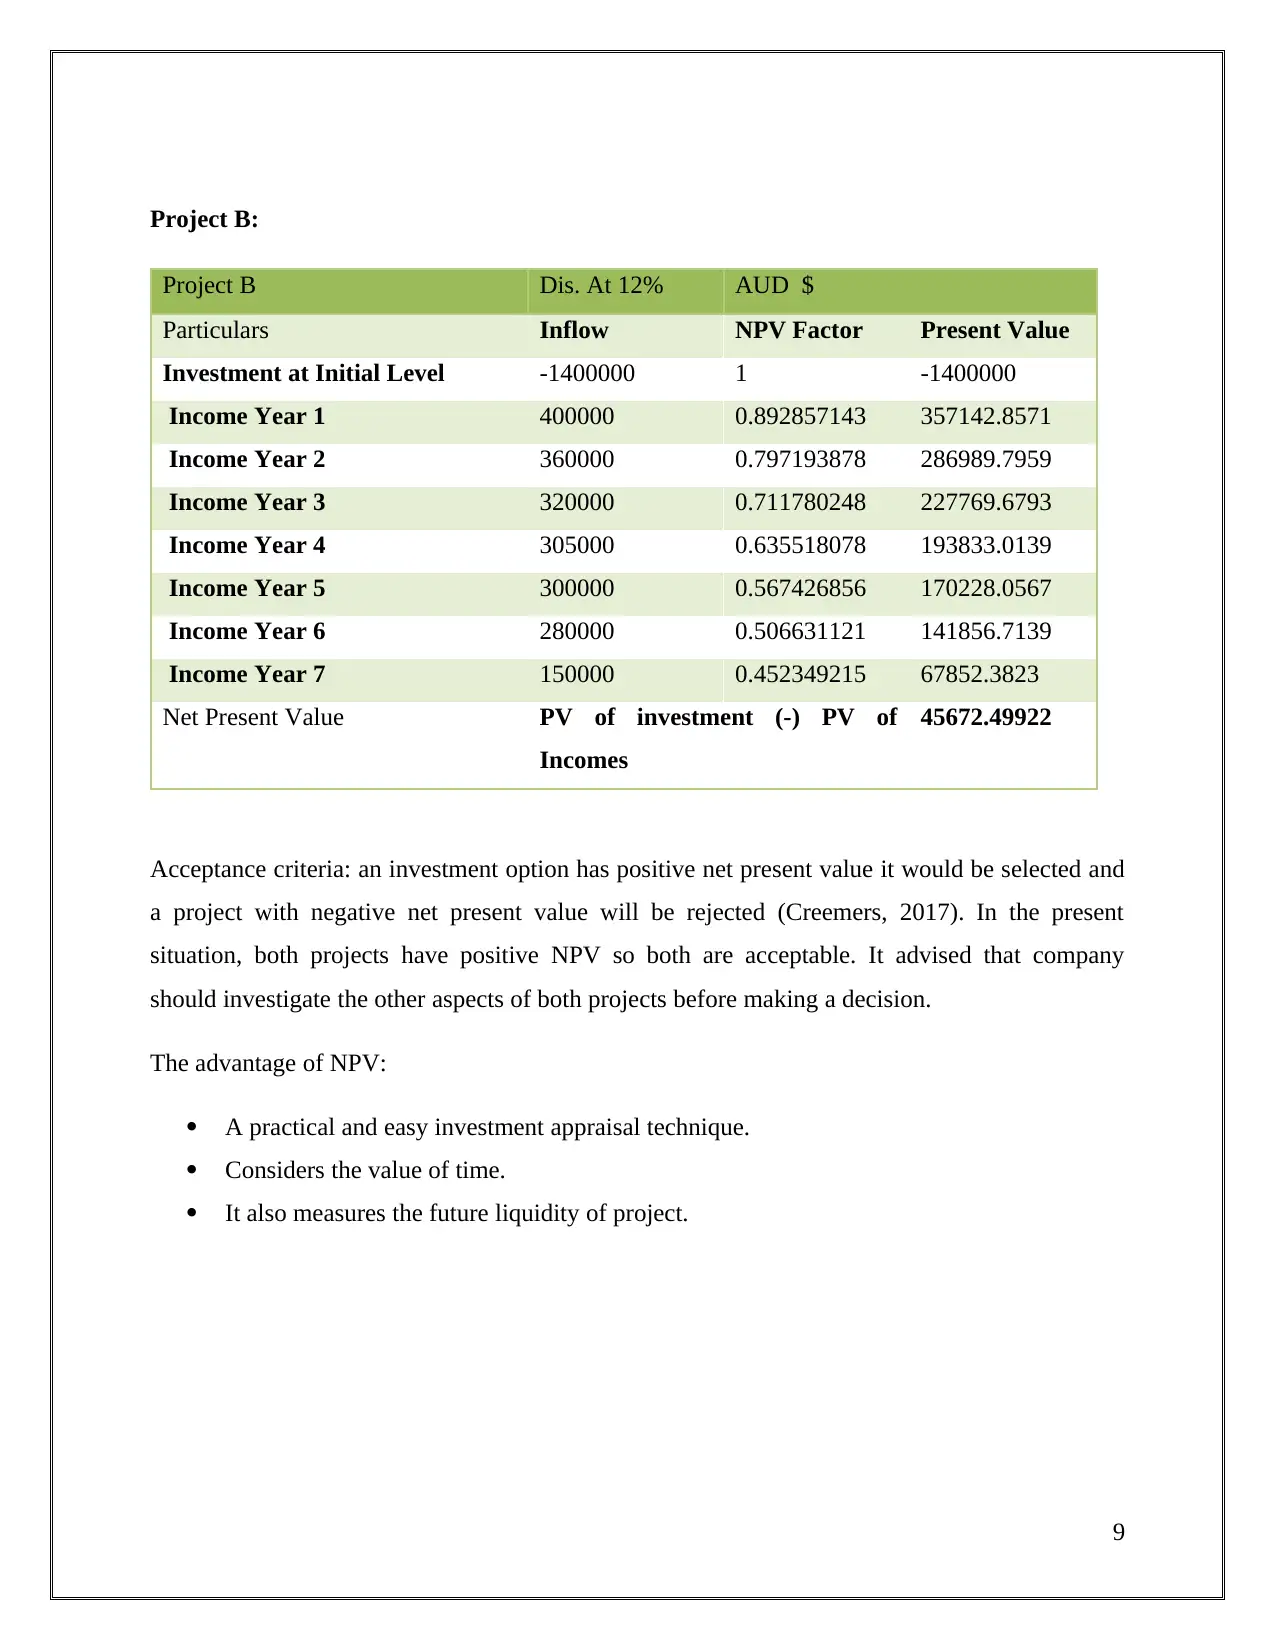
Project B:
Project B Dis. At 12% AUD $
Particulars Inflow NPV Factor Present Value
Investment at Initial Level -1400000 1 -1400000
Income Year 1 400000 0.892857143 357142.8571
Income Year 2 360000 0.797193878 286989.7959
Income Year 3 320000 0.711780248 227769.6793
Income Year 4 305000 0.635518078 193833.0139
Income Year 5 300000 0.567426856 170228.0567
Income Year 6 280000 0.506631121 141856.7139
Income Year 7 150000 0.452349215 67852.3823
Net Present Value PV of investment (-) PV of
Incomes
45672.49922
Acceptance criteria: an investment option has positive net present value it would be selected and
a project with negative net present value will be rejected (Creemers, 2017). In the present
situation, both projects have positive NPV so both are acceptable. It advised that company
should investigate the other aspects of both projects before making a decision.
The advantage of NPV:
A practical and easy investment appraisal technique.
Considers the value of time.
It also measures the future liquidity of project.
9
⊘ This is a preview!⊘
Do you want full access?
Subscribe today to unlock all pages.
Trusted by 1+ million students worldwide
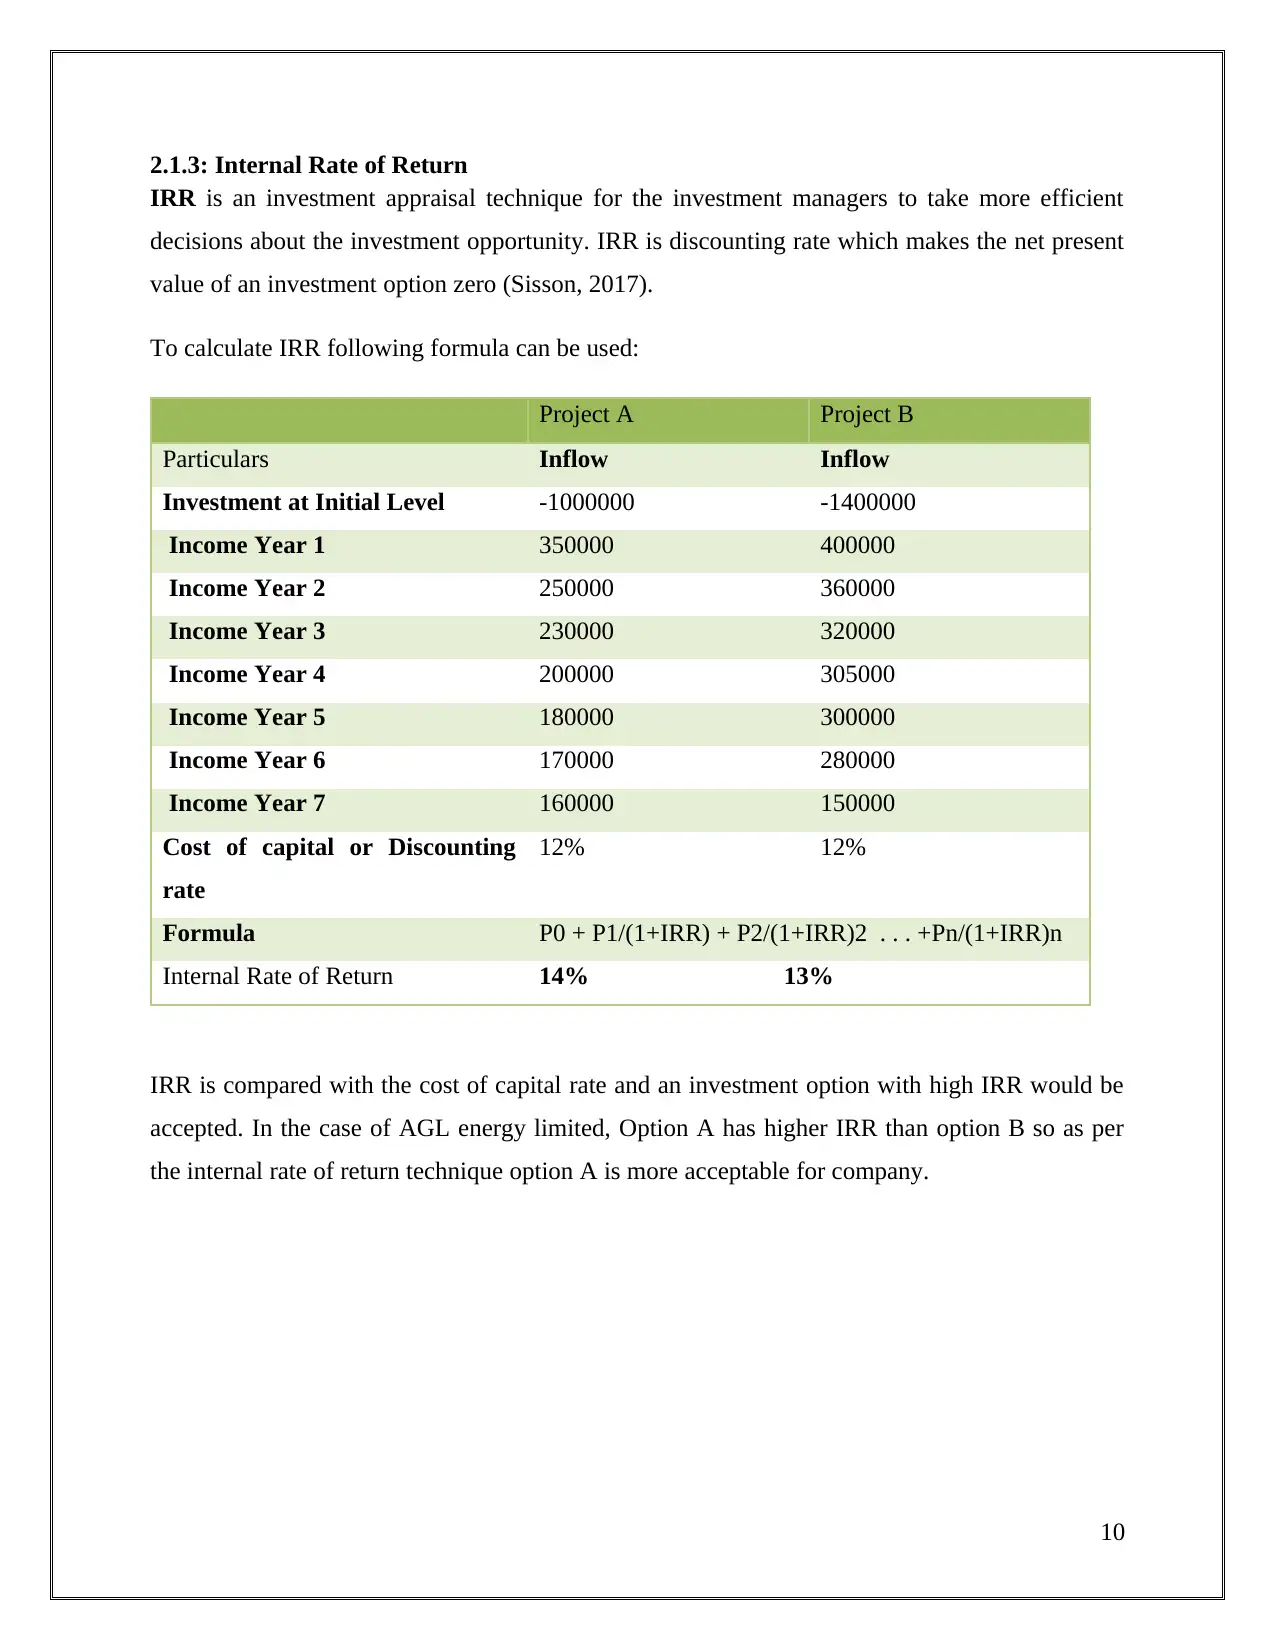
2.1.3: Internal Rate of Return
IRR is an investment appraisal technique for the investment managers to take more efficient
decisions about the investment opportunity. IRR is discounting rate which makes the net present
value of an investment option zero (Sisson, 2017).
To calculate IRR following formula can be used:
Project A Project B
Particulars Inflow Inflow
Investment at Initial Level -1000000 -1400000
Income Year 1 350000 400000
Income Year 2 250000 360000
Income Year 3 230000 320000
Income Year 4 200000 305000
Income Year 5 180000 300000
Income Year 6 170000 280000
Income Year 7 160000 150000
Cost of capital or Discounting
rate
12% 12%
Formula P0 + P1/(1+IRR) + P2/(1+IRR)2 . . . +Pn/(1+IRR)n
Internal Rate of Return 14% 13%
IRR is compared with the cost of capital rate and an investment option with high IRR would be
accepted. In the case of AGL energy limited, Option A has higher IRR than option B so as per
the internal rate of return technique option A is more acceptable for company.
10
Paraphrase This Document
Need a fresh take? Get an instant paraphrase of this document with our AI Paraphraser
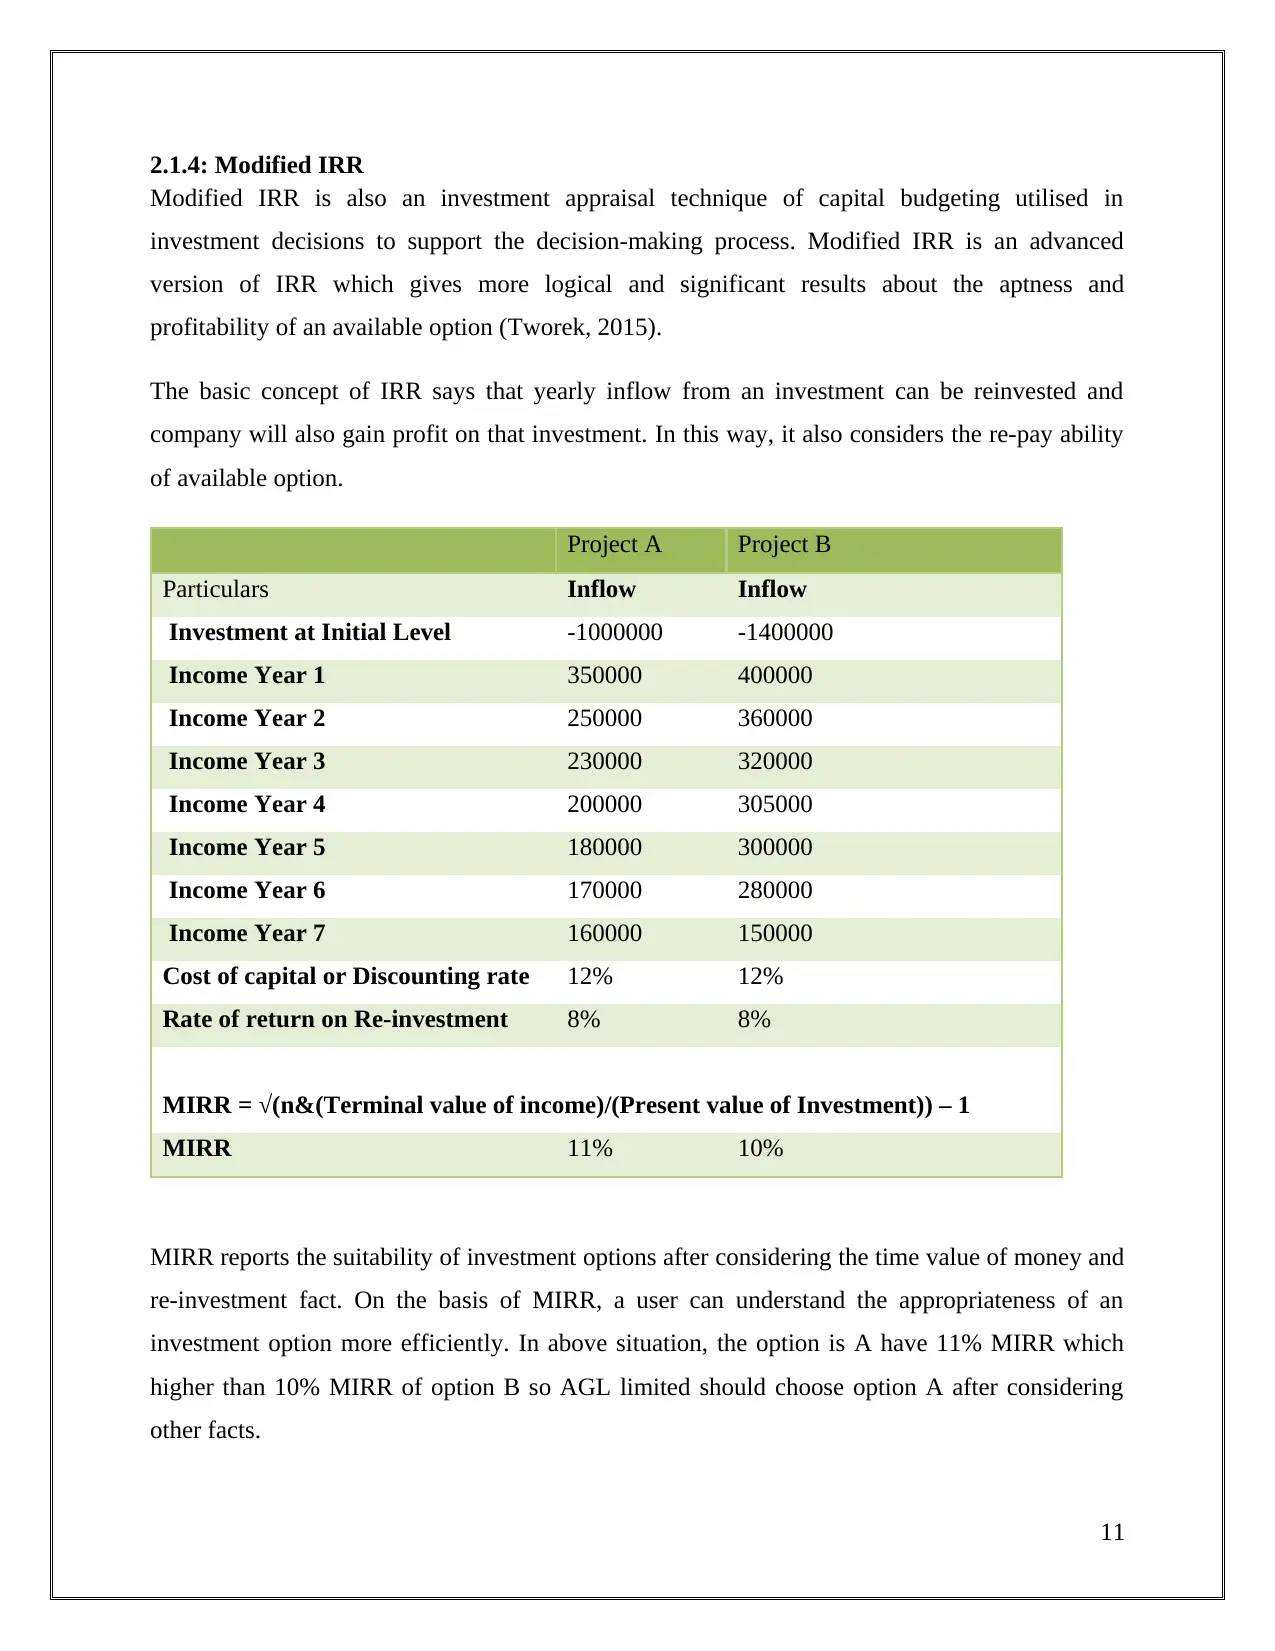
2.1.4: Modified IRR
Modified IRR is also an investment appraisal technique of capital budgeting utilised in
investment decisions to support the decision-making process. Modified IRR is an advanced
version of IRR which gives more logical and significant results about the aptness and
profitability of an available option (Tworek, 2015).
The basic concept of IRR says that yearly inflow from an investment can be reinvested and
company will also gain profit on that investment. In this way, it also considers the re-pay ability
of available option.
Project A Project B
Particulars Inflow Inflow
Investment at Initial Level -1000000 -1400000
Income Year 1 350000 400000
Income Year 2 250000 360000
Income Year 3 230000 320000
Income Year 4 200000 305000
Income Year 5 180000 300000
Income Year 6 170000 280000
Income Year 7 160000 150000
Cost of capital or Discounting rate 12% 12%
Rate of return on Re-investment 8% 8%
MIRR = √(n&(Terminal value of income)/(Present value of Investment)) – 1
MIRR 11% 10%
MIRR reports the suitability of investment options after considering the time value of money and
re-investment fact. On the basis of MIRR, a user can understand the appropriateness of an
investment option more efficiently. In above situation, the option is A have 11% MIRR which
higher than 10% MIRR of option B so AGL limited should choose option A after considering
other facts.
11
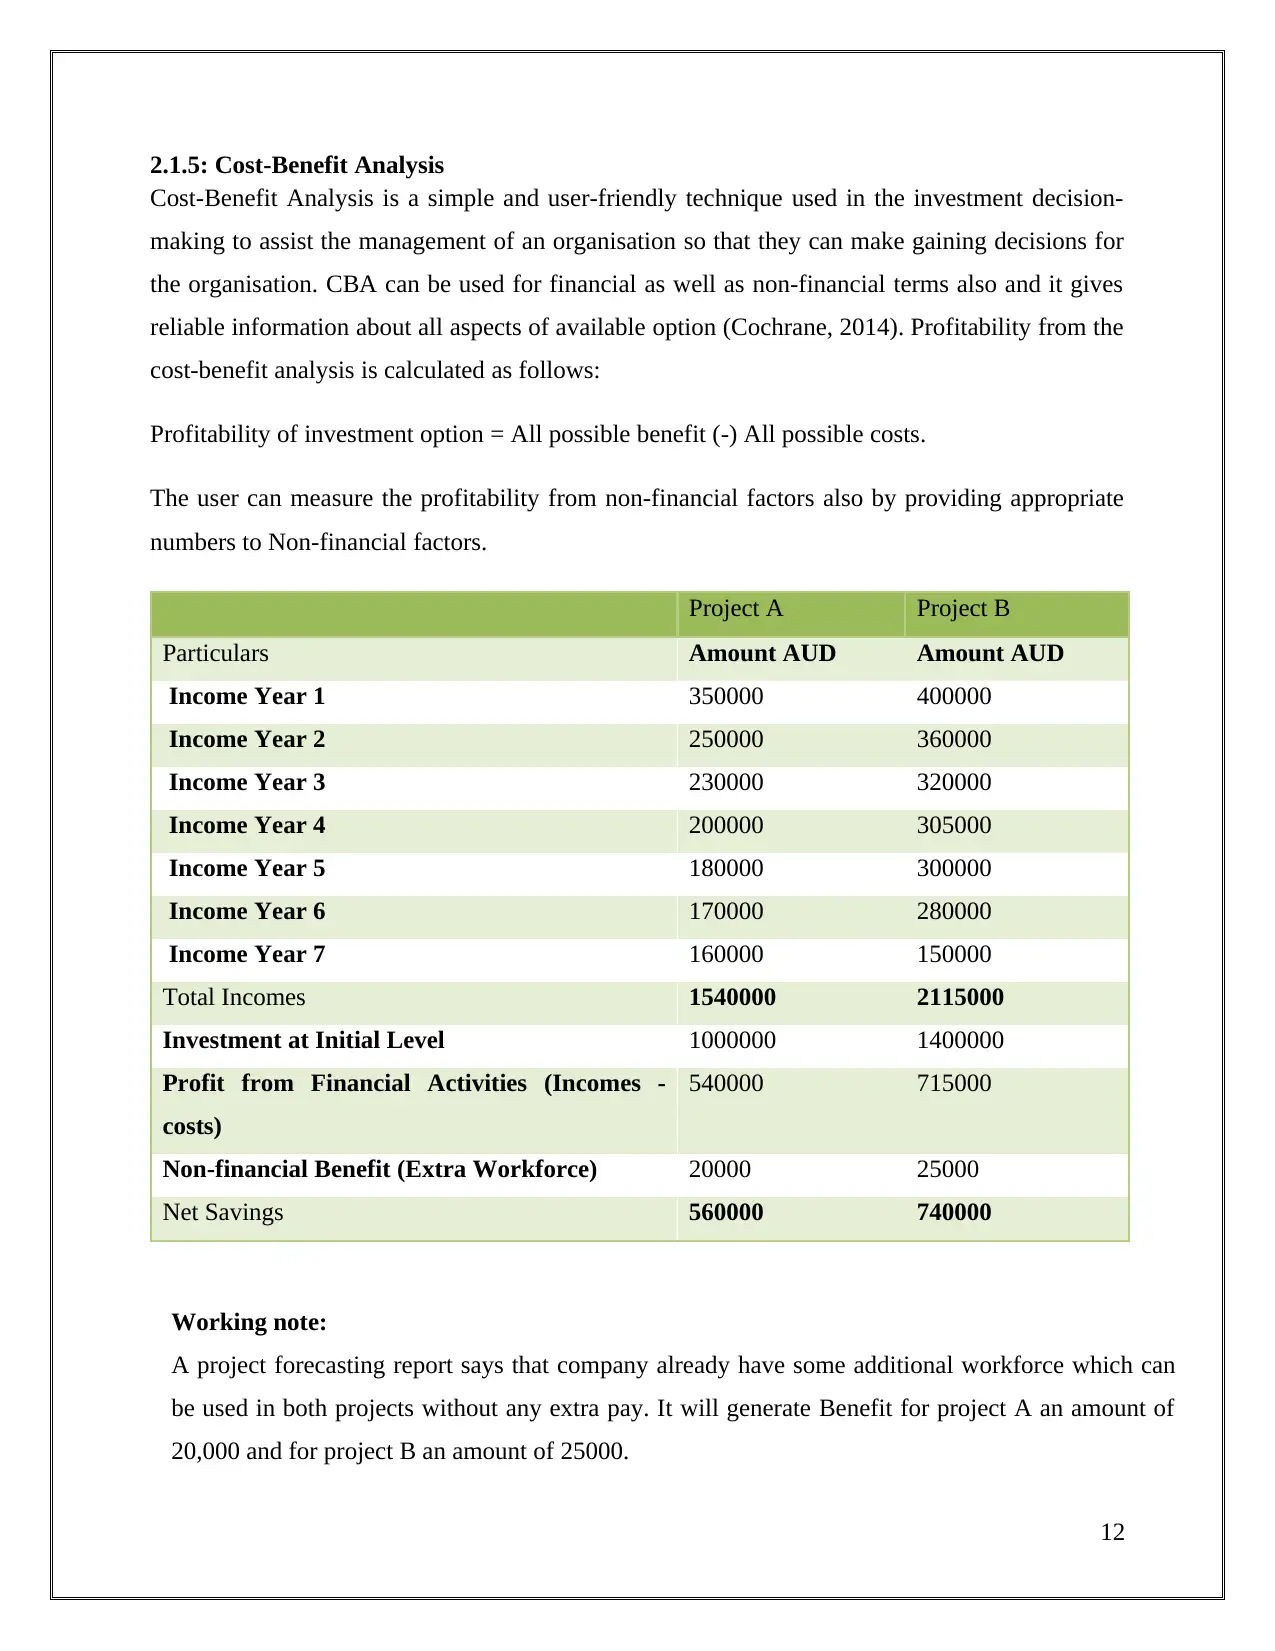
2.1.5: Cost-Benefit Analysis
Cost-Benefit Analysis is a simple and user-friendly technique used in the investment decision-
making to assist the management of an organisation so that they can make gaining decisions for
the organisation. CBA can be used for financial as well as non-financial terms also and it gives
reliable information about all aspects of available option (Cochrane, 2014). Profitability from the
cost-benefit analysis is calculated as follows:
Profitability of investment option = All possible benefit (-) All possible costs.
The user can measure the profitability from non-financial factors also by providing appropriate
numbers to Non-financial factors.
Project A Project B
Particulars Amount AUD Amount AUD
Income Year 1 350000 400000
Income Year 2 250000 360000
Income Year 3 230000 320000
Income Year 4 200000 305000
Income Year 5 180000 300000
Income Year 6 170000 280000
Income Year 7 160000 150000
Total Incomes 1540000 2115000
Investment at Initial Level 1000000 1400000
Profit from Financial Activities (Incomes -
costs)
540000 715000
Non-financial Benefit (Extra Workforce) 20000 25000
Net Savings 560000 740000
Working note:
A project forecasting report says that company already have some additional workforce which can
be used in both projects without any extra pay. It will generate Benefit for project A an amount of
20,000 and for project B an amount of 25000.
12
⊘ This is a preview!⊘
Do you want full access?
Subscribe today to unlock all pages.
Trusted by 1+ million students worldwide
1 out of 28
Related Documents


Your All-in-One AI-Powered Toolkit for Academic Success.
+13062052269
info@desklib.com
Available 24*7 on WhatsApp / Email
![[object Object]](/_next/static/media/star-bottom.7253800d.svg)
Unlock your academic potential
Copyright © 2020–2026 A2Z Services. All Rights Reserved. Developed and managed by ZUCOL.