Aircraft Wing Analysis: Boundary Layer Analysis Report - Engineering
VerifiedAdded on 2022/01/06
|27
|4395
|418
Report
AI Summary
This report presents an in-depth analysis of an aircraft wing, focusing on boundary layer analysis and computational fluid dynamics (CFD) simulations. The study utilizes the NACA 0015 aerofoil shape and examines the forces of lift and drag under zero angle of attack conditions. Initially, the report outlines theoretical calculations of the boundary layer and drag force, followed by a simulation using SolidWorks Flow simulation. The simulation incorporates appropriate boundary conditions and assesses velocity, lift, drag, and pressure profiles. The results of the simulation are then interpreted and compared with theoretical findings, highlighting any deviations. The report also includes a comprehensive literature review on related studies and provides detailed methodologies and calculations. The objective is to understand and compare the theoretical and simulated performance of the aircraft wing, contributing to the optimization of aircraft design and fuel efficiency.
School of Engineering Undergraduate Programmes
2018-19
Student Name(s) ID Course
Aircraft Wing Analysis
Abstract
The development in the modern technology paved a way for
more quickly and comfortable mode of transportation such as
aircraft. The usage of aeroplanes increases day by day which
also create a considerable impact on the environment by
generating an enormous amount of Greenhouse gases and
other polluting particles as a result of combustion. This lead to
the search for more greener and efficient aircraft. An aircraft
requires four forces to have its flight Lift, Drag, Thrust and
Weight. Aeroplane wings account for the lift and drag forces.
The aircraft wings utilize the Aerofoil shape which helps to
generate lift and drag forces on an aeroplane. Airfoil shapes
work on the principle of boundary layer concept. In this report
boundary layer analysis on an aircraft wing will be carried out
theoretically and the same will be simulated with the help of
SolidWorks CFD package. NACA 0015 aerofoil shape is
selected for this study. The analysis will be carried out for
zero Angle of attack condition. Initially, The boundary layer on
the aerofoil shape and the Drag force acting on the wing will
be calculated theoretically then the simulation is carried out
with proper boundary conditions and the goals are set as
Velocity along Y axis, Drag and Lift force and the pressure
profile. Finally, the simulation results will be interpreted and
the difference and deviation between the simulation and the
theoretical results will be discussed.
Paraphrase This Document
Need a fresh take? Get an instant paraphrase of this document with our AI Paraphraser
Aircraft Wing Analysis
Contents
Aircraft Wing Analysis..............................................................................................1
Abstract.................................................................................................................1
Introduction..........................................................................................................2
Literature Survey..................................................................................................6
Method:................................................................................................................7
Theoretical Calculation......................................................................................7
Flow Simulation:..............................................................................................10
Calculations:........................................................................................................12
Theoretical:......................................................................................................12
Simulation Using Solidworks Flow simulate:...................................................14
Results.................................................................................................................15
Discussion:..........................................................................................................18
Conclusion:.........................................................................................................20
Bibliography........................................................................................................21
References..........................................................................................................22
Appendix A:.........................................................................................................22
School of Engineering Undergraduate Programmes Page 1
Aircraft Wing Analysis
Introduction
The transportation system evolves day by day with the
evolution of science and technology. The transport is the most
vital thing. There are many modes of transportation in this
modern world such as air, water, and road. The automotive
industries are making a large number of profits by this
transportation business. Everyone in this world needs a form of
transportation such as private, public transportation system,
etc. This Transportation system helped the humans to save
time and make more profit in their business, work, medical
emergencies, etc. The Air transport system is the quickest form
of transportation available to travel from one country to
another or state to another state (Vasigh, B. and Fleming, K.,
2016)
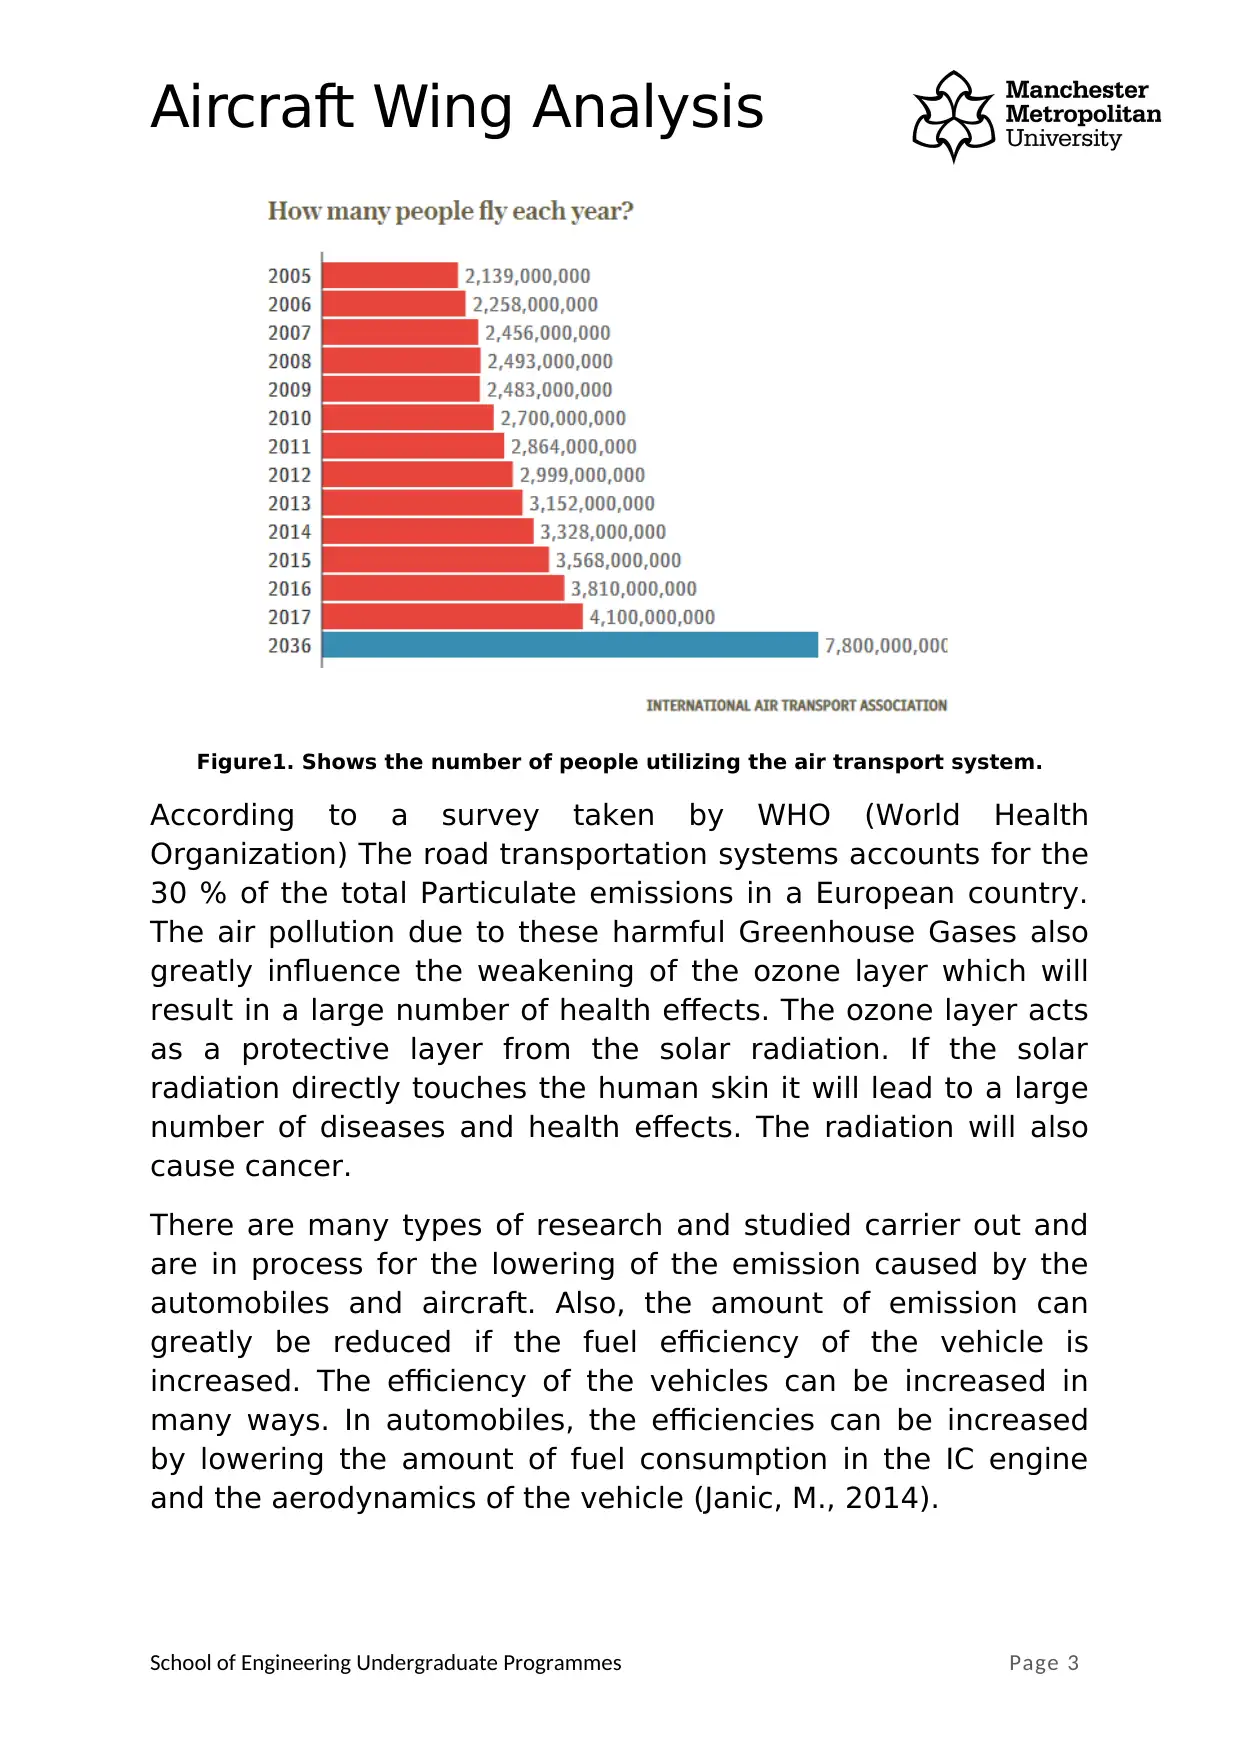
According to the survey taken by the International Air transport
Association (IATA), there are around 4,100,000,000 amount of
people travel by air and it is expected that this number will
raise twice in the course of 20 years. Even though these
Transportation systems provide an enormous number of pros
there are certain negativities which really affects our
environment. There are a large number of chemicals and gases
which reaches the environment as a result of the chemical
combustion that takes place inside the combustion chamber of
the vehicles
School of Engineering Undergraduate Programmes Page 2
Introduction
The transportation system evolves day by day with the
evolution of science and technology. The transport is the most
vital thing. There are many modes of transportation in this
modern world such as air, water, and road. The automotive
industries are making a large number of profits by this
transportation business. Everyone in this world needs a form of
transportation such as private, public transportation system,
etc. This Transportation system helped the humans to save
time and make more profit in their business, work, medical
emergencies, etc. The Air transport system is the quickest form
of transportation available to travel from one country to
another or state to another state (Vasigh, B. and Fleming, K.,
2016)
According to the survey taken by the International Air transport
Association (IATA), there are around 4,100,000,000 amount of
people travel by air and it is expected that this number will
raise twice in the course of 20 years. Even though these
Transportation systems provide an enormous number of pros
there are certain negativities which really affects our
environment. There are a large number of chemicals and gases
which reaches the environment as a result of the chemical
combustion that takes place inside the combustion chamber of
the vehicles
School of Engineering Undergraduate Programmes Page 2
⊘ This is a preview!⊘
Do you want full access?
Subscribe today to unlock all pages.
Trusted by 1+ million students worldwide
Aircraft Wing Analysis
Figure1. Shows the number of people utilizing the air transport system.
According to a survey taken by WHO (World Health
Organization) The road transportation systems accounts for the
30 % of the total Particulate emissions in a European country.
The air pollution due to these harmful Greenhouse Gases also
greatly influence the weakening of the ozone layer which will
result in a large number of health effects. The ozone layer acts
as a protective layer from the solar radiation. If the solar
radiation directly touches the human skin it will lead to a large
number of diseases and health effects. The radiation will also
cause cancer.
There are many types of research and studied carrier out and
are in process for the lowering of the emission caused by the
automobiles and aircraft. Also, the amount of emission can
greatly be reduced if the fuel efficiency of the vehicle is
increased. The efficiency of the vehicles can be increased in
many ways. In automobiles, the efficiencies can be increased
by lowering the amount of fuel consumption in the IC engine
and the aerodynamics of the vehicle (Janic, M., 2014).
School of Engineering Undergraduate Programmes Page 3
Paraphrase This Document
Need a fresh take? Get an instant paraphrase of this document with our AI Paraphraser
Aircraft Wing Analysis
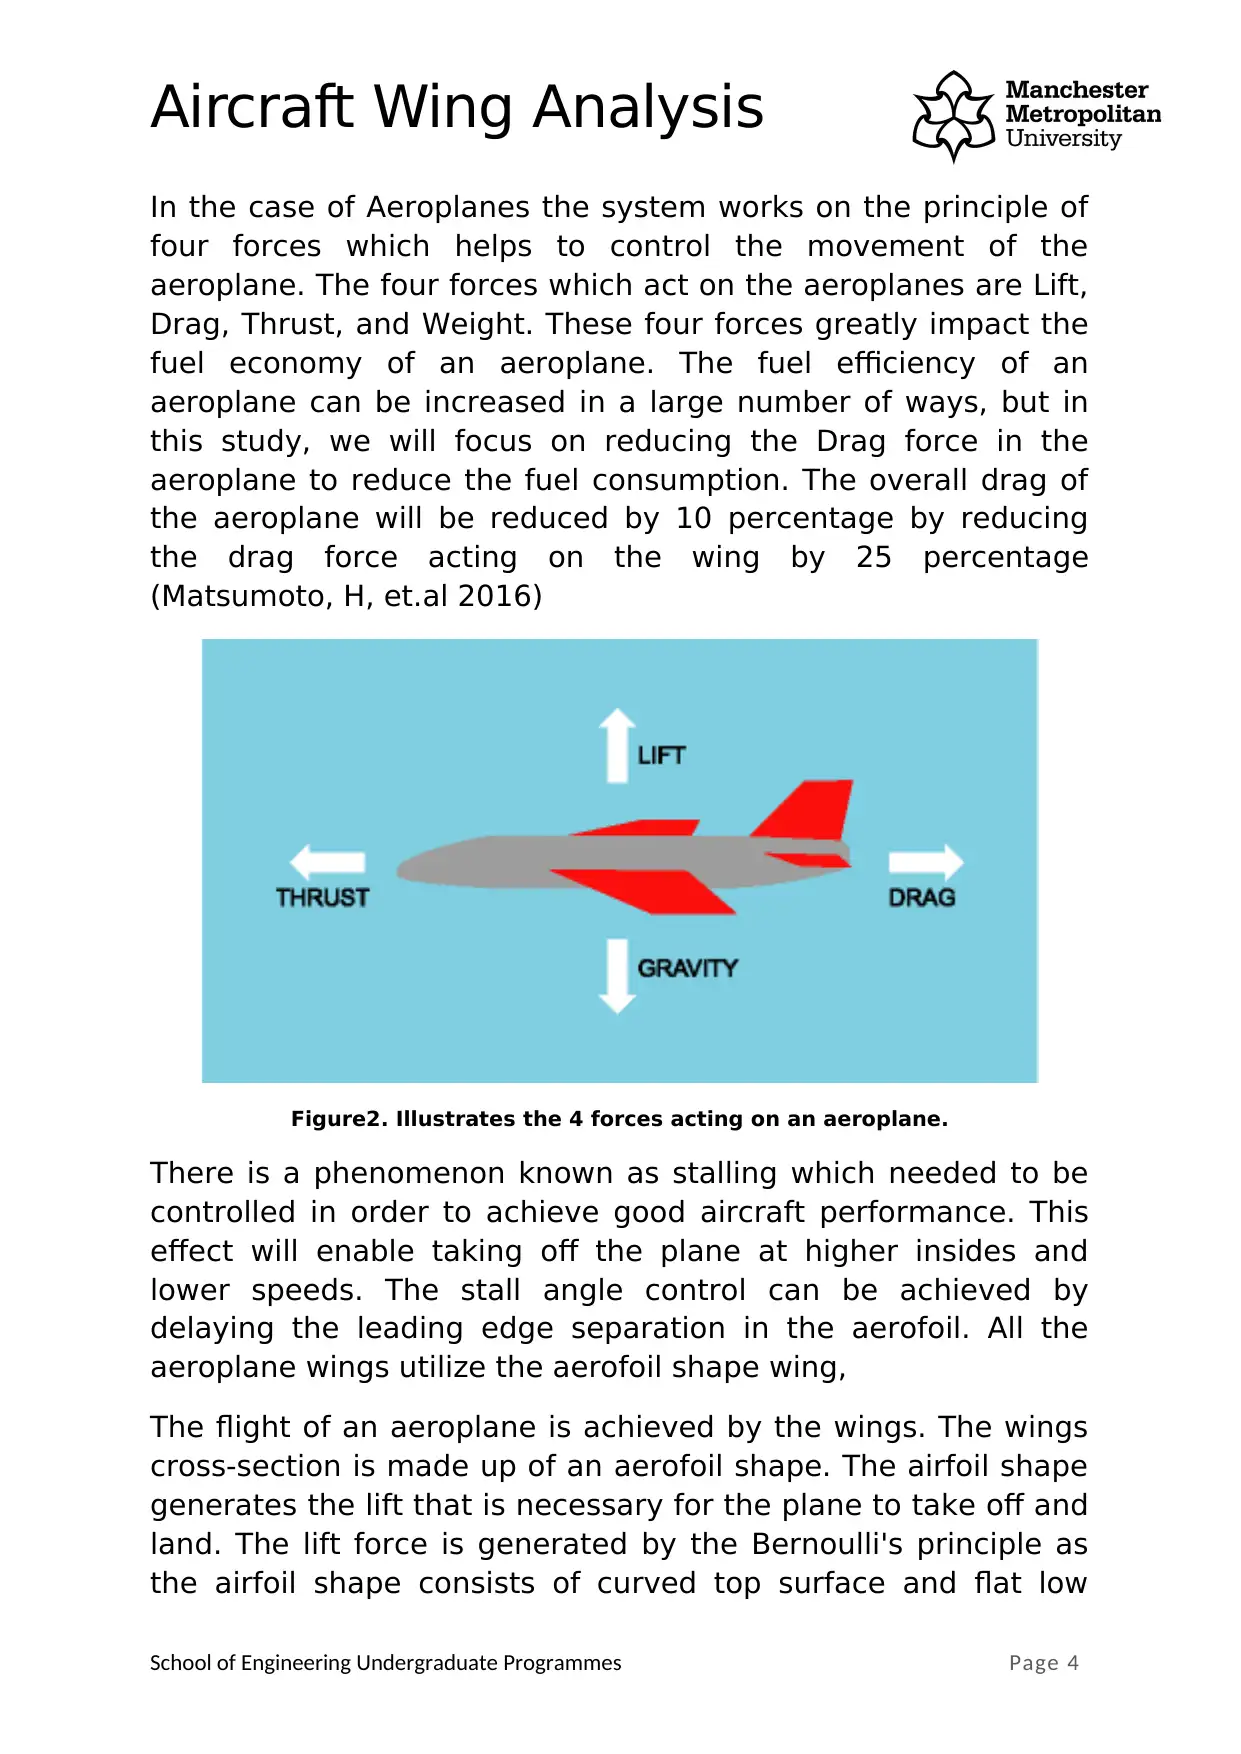
In the case of Aeroplanes the system works on the principle of
four forces which helps to control the movement of the
aeroplane. The four forces which act on the aeroplanes are Lift,
Drag, Thrust, and Weight. These four forces greatly impact the
fuel economy of an aeroplane. The fuel efficiency of an
aeroplane can be increased in a large number of ways, but in
this study, we will focus on reducing the Drag force in the
aeroplane to reduce the fuel consumption. The overall drag of
the aeroplane will be reduced by 10 percentage by reducing
the drag force acting on the wing by 25 percentage
(Matsumoto, H, et.al 2016)
Figure2. Illustrates the 4 forces acting on an aeroplane.
There is a phenomenon known as stalling which needed to be
controlled in order to achieve good aircraft performance. This
effect will enable taking off the plane at higher insides and
lower speeds. The stall angle control can be achieved by
delaying the leading edge separation in the aerofoil. All the
aeroplane wings utilize the aerofoil shape wing,
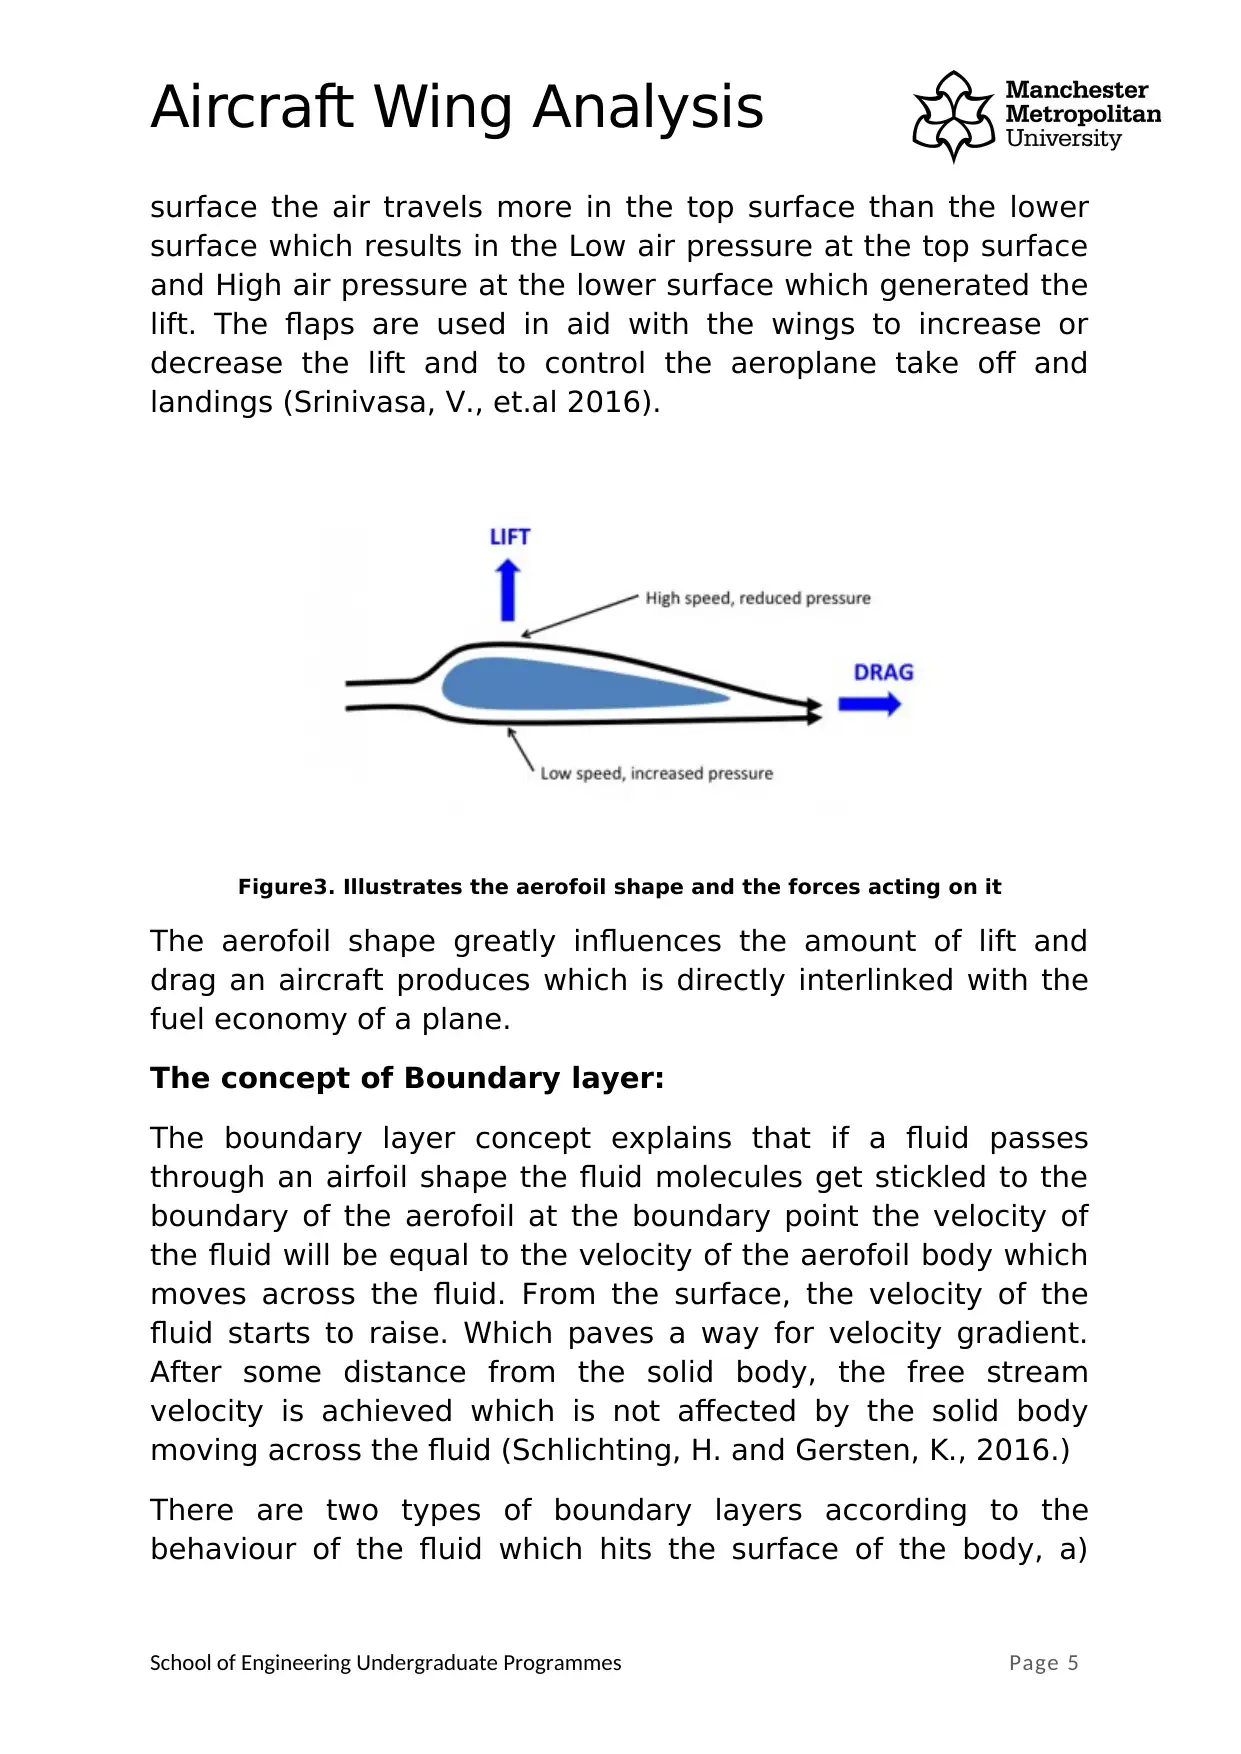
The flight of an aeroplane is achieved by the wings. The wings
cross-section is made up of an aerofoil shape. The airfoil shape
generates the lift that is necessary for the plane to take off and
land. The lift force is generated by the Bernoulli's principle as
the airfoil shape consists of curved top surface and flat low
School of Engineering Undergraduate Programmes Page 4
In the case of Aeroplanes the system works on the principle of
four forces which helps to control the movement of the
aeroplane. The four forces which act on the aeroplanes are Lift,
Drag, Thrust, and Weight. These four forces greatly impact the
fuel economy of an aeroplane. The fuel efficiency of an
aeroplane can be increased in a large number of ways, but in
this study, we will focus on reducing the Drag force in the
aeroplane to reduce the fuel consumption. The overall drag of
the aeroplane will be reduced by 10 percentage by reducing
the drag force acting on the wing by 25 percentage
(Matsumoto, H, et.al 2016)
Figure2. Illustrates the 4 forces acting on an aeroplane.
There is a phenomenon known as stalling which needed to be
controlled in order to achieve good aircraft performance. This
effect will enable taking off the plane at higher insides and
lower speeds. The stall angle control can be achieved by
delaying the leading edge separation in the aerofoil. All the
aeroplane wings utilize the aerofoil shape wing,
The flight of an aeroplane is achieved by the wings. The wings
cross-section is made up of an aerofoil shape. The airfoil shape
generates the lift that is necessary for the plane to take off and
land. The lift force is generated by the Bernoulli's principle as
the airfoil shape consists of curved top surface and flat low
School of Engineering Undergraduate Programmes Page 4
Aircraft Wing Analysis
surface the air travels more in the top surface than the lower
surface which results in the Low air pressure at the top surface
and High air pressure at the lower surface which generated the
lift. The flaps are used in aid with the wings to increase or
decrease the lift and to control the aeroplane take off and
landings (Srinivasa, V., et.al 2016).
Figure3. Illustrates the aerofoil shape and the forces acting on it
The aerofoil shape greatly influences the amount of lift and
drag an aircraft produces which is directly interlinked with the
fuel economy of a plane.
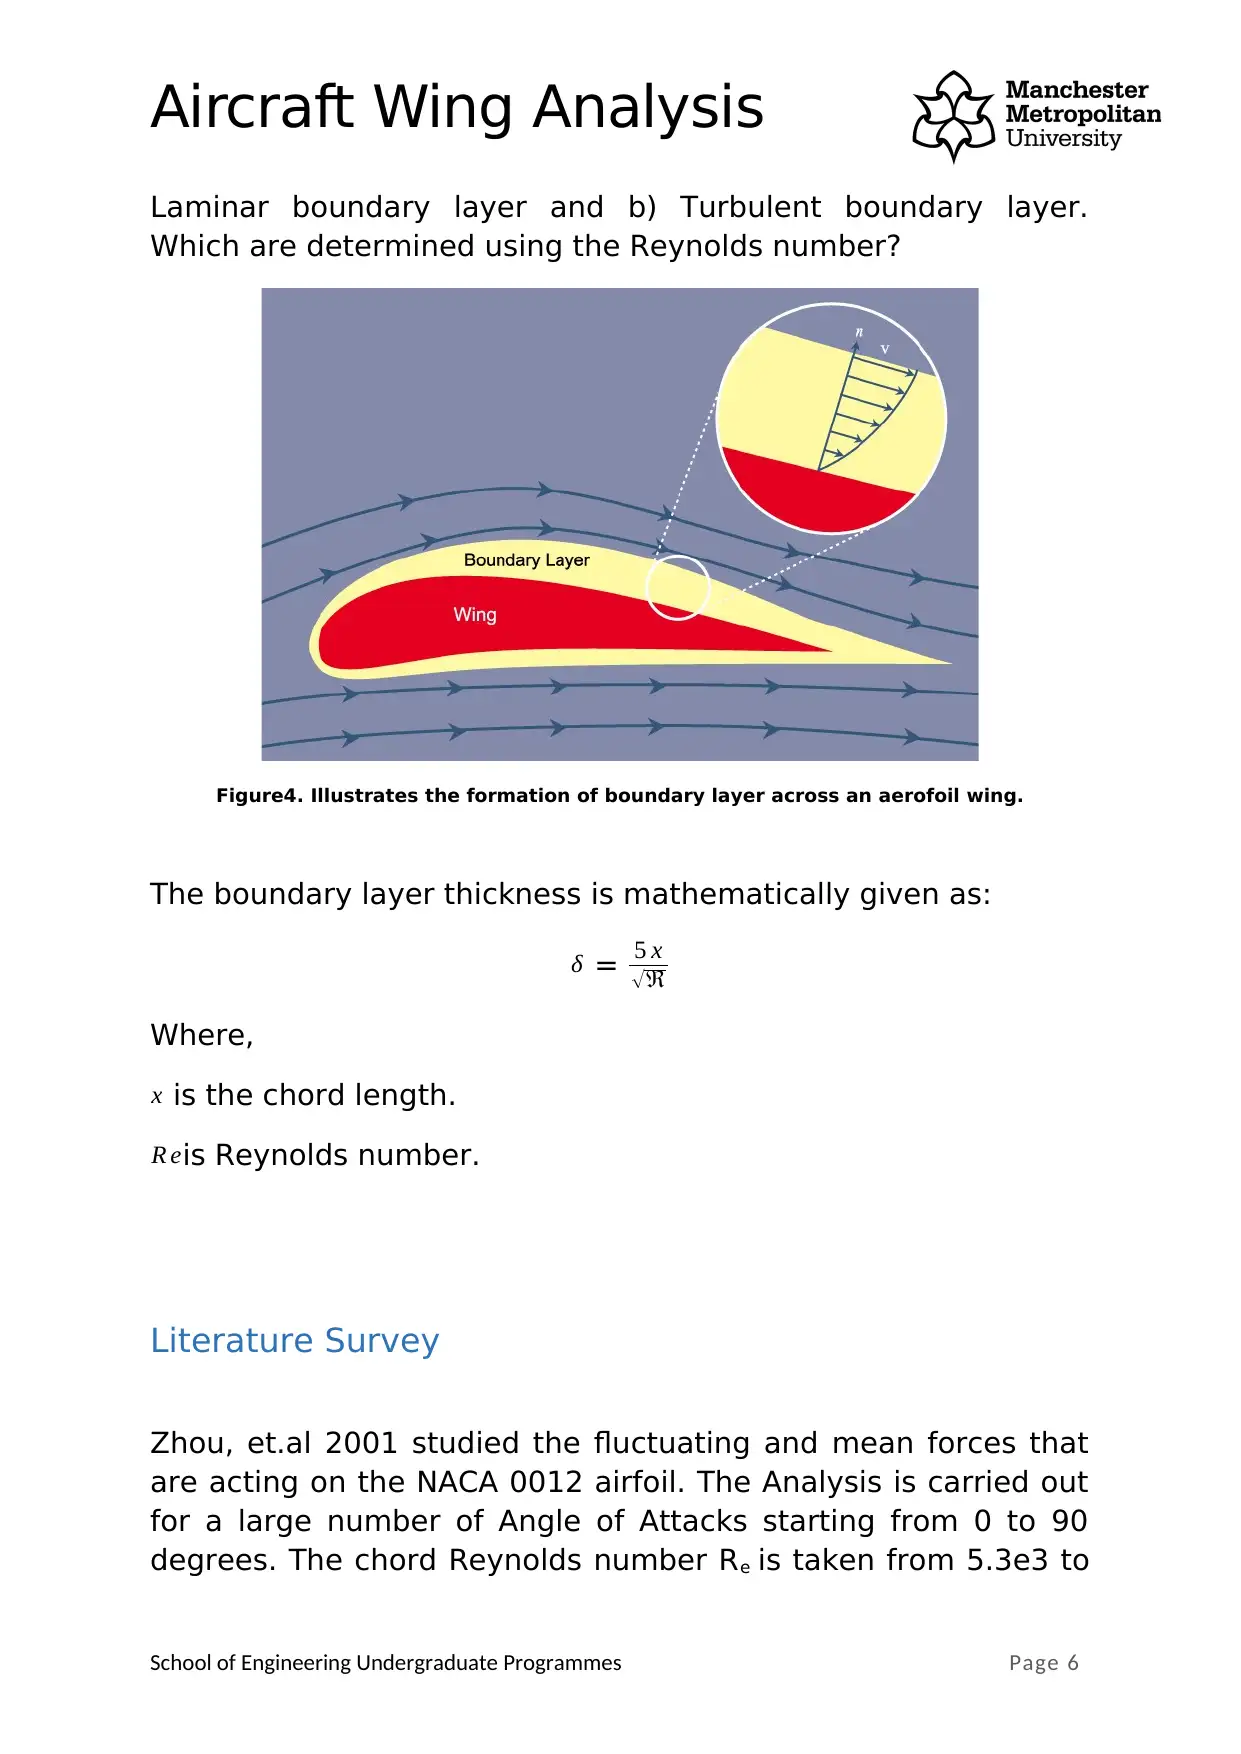
The concept of Boundary layer:
The boundary layer concept explains that if a fluid passes
through an airfoil shape the fluid molecules get stickled to the
boundary of the aerofoil at the boundary point the velocity of
the fluid will be equal to the velocity of the aerofoil body which
moves across the fluid. From the surface, the velocity of the
fluid starts to raise. Which paves a way for velocity gradient.
After some distance from the solid body, the free stream
velocity is achieved which is not affected by the solid body
moving across the fluid (Schlichting, H. and Gersten, K., 2016.)
There are two types of boundary layers according to the
behaviour of the fluid which hits the surface of the body, a)
School of Engineering Undergraduate Programmes Page 5
surface the air travels more in the top surface than the lower
surface which results in the Low air pressure at the top surface
and High air pressure at the lower surface which generated the
lift. The flaps are used in aid with the wings to increase or
decrease the lift and to control the aeroplane take off and
landings (Srinivasa, V., et.al 2016).
Figure3. Illustrates the aerofoil shape and the forces acting on it
The aerofoil shape greatly influences the amount of lift and
drag an aircraft produces which is directly interlinked with the
fuel economy of a plane.
The concept of Boundary layer:
The boundary layer concept explains that if a fluid passes
through an airfoil shape the fluid molecules get stickled to the
boundary of the aerofoil at the boundary point the velocity of
the fluid will be equal to the velocity of the aerofoil body which
moves across the fluid. From the surface, the velocity of the
fluid starts to raise. Which paves a way for velocity gradient.
After some distance from the solid body, the free stream
velocity is achieved which is not affected by the solid body
moving across the fluid (Schlichting, H. and Gersten, K., 2016.)
There are two types of boundary layers according to the
behaviour of the fluid which hits the surface of the body, a)
School of Engineering Undergraduate Programmes Page 5
⊘ This is a preview!⊘
Do you want full access?
Subscribe today to unlock all pages.
Trusted by 1+ million students worldwide
Aircraft Wing Analysis
Laminar boundary layer and b) Turbulent boundary layer.
Which are determined using the Reynolds number?
Figure4. Illustrates the formation of boundary layer across an aerofoil wing.
The boundary layer thickness is mathematically given as:
δ = 5 x
√ℜ
Where,
x is the chord length.
R eis Reynolds number.
Literature Survey
Zhou, et.al 2001 studied the fluctuating and mean forces that
are acting on the NACA 0012 airfoil. The Analysis is carried out
for a large number of Angle of Attacks starting from 0 to 90
degrees. The chord Reynolds number Re is taken from 5.3e3 to
School of Engineering Undergraduate Programmes Page 6
Paraphrase This Document
Need a fresh take? Get an instant paraphrase of this document with our AI Paraphraser
Aircraft Wing Analysis
5.1e4. The measurement was carried out with the help of load
cells. The final results have shown that the stall of an aerofoil is
decided by the drop in the lift force and change in the drag,
which is found to occur at the Reynolds number greater than
1.05e4 and it is not experienced when the Reynolds number is
equal to 5.3e3.
Aravind Studied the Profile of the NACA4412 Aerofoil, the study
is carried out by creating a model in the CATIA CAD modelling
package and then the Flow analysis is carried out with the help
of Ansys Fluent. The simulation was carried out for a turbulent
flow which flows the rate of 340 m/s and the simulation was
carried out for a various angle of attacks such as 0, 16, and 12
degrees.
Lanzafame and Mesina at 2007 developed a mathematical
model for improving the Blade design of a wind turbine on the
basis of element moment theory. They also simulated and
obtained results for the various range of velocities of wind. As
they faced difficulty to implement the BEM theory to find the
required lift and drag forces, they developed a model from the
tangential flow factor. The model optimized the performance of
the rotor. A simulation was performed in order to find the
required drag and lift coefficients. The obtained results are also
compared with the experimental results and a conclusion was
drawn.
The NACA 4412 was also studied by Kevdiya at 2013. The
complete profile of the NACA 4412 aerofoil shape is studied and
a flow analysis is carried out. The CAD model of the Aerofoil
shape is created using Gambit 3D modelling Package and then
CFD (Computational fluid dynamics) was carried out with the
help of Ansys Fluent Software package. The AOA (Angle of
Attack) was taken from 0 to 12 degrees. The simulation was
carried out for turbulent flow conditions the final results are laid
out and the discussion was done.
School of Engineering Undergraduate Programmes Page 7
Aircraft Wing Analysis
Mittal et.al 2002, carried out a CFD (Computational fluid
dynamics) study on the NACA 0012 profile for the 2D model.
Diminishing & Expanding approach is utilized for the study. A
mathematical model was developed by using Navier strokes
mathematical equations and then the profile is evaluated with
proper boundary conditions. Finally, the reports are laid and
discussed.
The NACA 4415 profile was utilized by Kishiname et.al 2005, for
the calculation of power coefficient values of a wind turbine.
The NACA standard profiles were used for the wind turbine
blades and the study was carried out. The final results showed
that the values varied between 0.23 to 0.41 at the speed rate
of 4.5 meters per seconds.
Vardar, A and Alibas I, 2008 carried out a Research on the Wind
turbine rotors which utilized the NACA 2404 profile for the rotor
blades. The same aerofoil profile was also studied by Hiraharan
et.al 2005, to find the power coefficient of a wind turbine. The
study was carried out for the wind velocity of 3.7 m/s to 21.5
m/s and the result shown that the turbine reached a power
coefficient of 0.40.
Method:
Theoretical Calculation
The Boundary Layer Analysis on the top layer of the Aerofoil
(NACA 0015) at Zero Angle of attack will be carried out by
categorizing the problem under the flow over a flat plate. The
solid object is the NACA 0015 Aerofoil and the fluid is
considered to flow over the aerofoil shape.
The concept of Boundary layer was utilized to solve the
problem theoretically, A boundary layer is formed whenever a
fluid passes over a solid object. The velocity of the fluid will be
equal to that of the velocity of the solid object at the point of
the boundary surface of the solid object. The velocity gradient
School of Engineering Undergraduate Programmes Page 8
⊘ This is a preview!⊘
Do you want full access?
Subscribe today to unlock all pages.
Trusted by 1+ million students worldwide
Aircraft Wing Analysis
keeps I increasing with the perpendicular distance from the
Boundary of Solid surface. The concept of the boundary layer
was discussed in depth at the introduction.
The first step in solving the problem is to find the flow
conditions. Reynolds number is used to find whether the flow is
a turbulent flow or a laminar flow. The found values are used
to carry out the Drag force Calculation on the aerofoil. The
drag force is the product of the shear stress and the cross-
section area of the Aerofoil profile (Williams, B.J., et.al 2014)
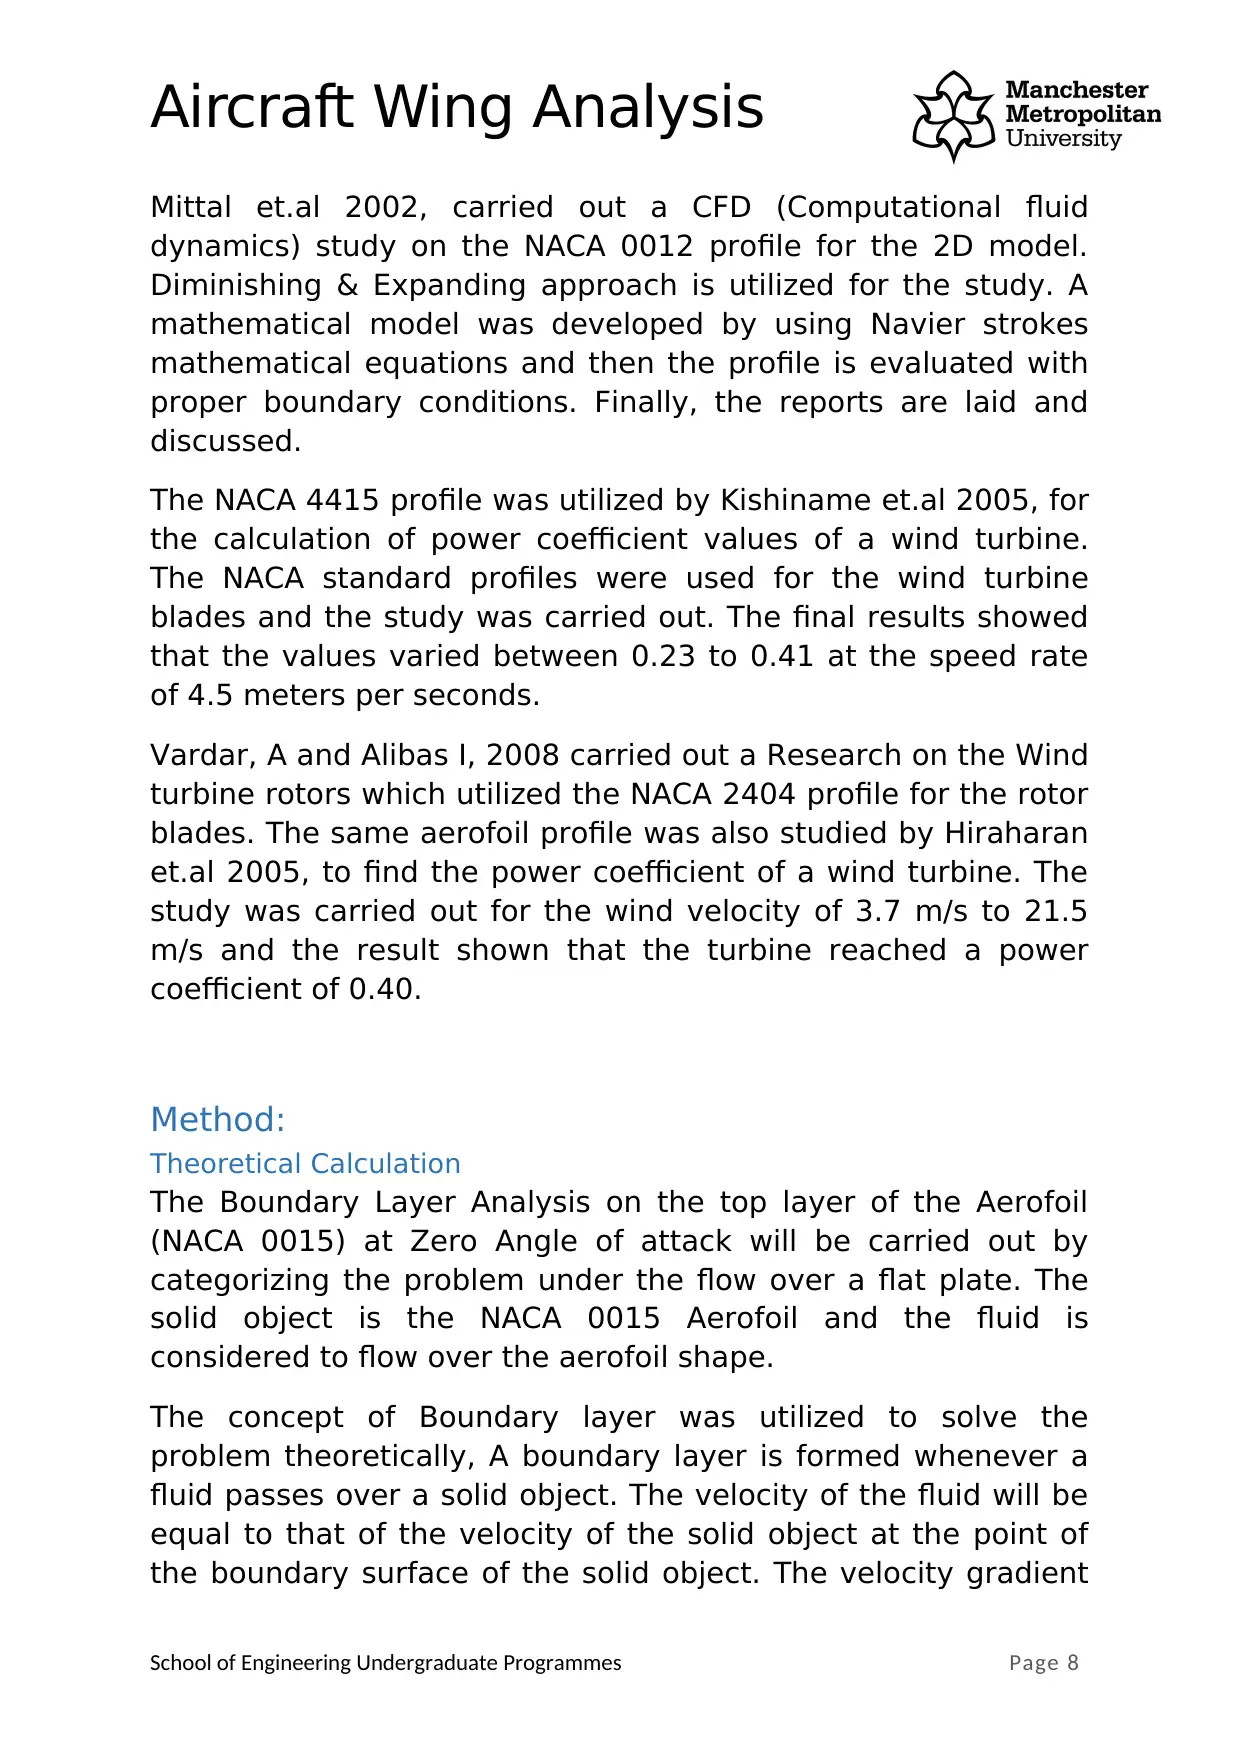
NACA 0015 Aerofoil geometry:
The geometry of the NACA 0015 Aerofoil is shown below:
Figure5. Illustrates the shape of NACA 0015 Aerofoil (Svoboda, A. and Rozehnal, D.,
2017)
The calculations were carried out with the formulae
given below:
Drag Force,
School of Engineering Undergraduate Programmes Page 9
keeps I increasing with the perpendicular distance from the
Boundary of Solid surface. The concept of the boundary layer
was discussed in depth at the introduction.
The first step in solving the problem is to find the flow
conditions. Reynolds number is used to find whether the flow is
a turbulent flow or a laminar flow. The found values are used
to carry out the Drag force Calculation on the aerofoil. The
drag force is the product of the shear stress and the cross-
section area of the Aerofoil profile (Williams, B.J., et.al 2014)
NACA 0015 Aerofoil geometry:
The geometry of the NACA 0015 Aerofoil is shown below:
Figure5. Illustrates the shape of NACA 0015 Aerofoil (Svoboda, A. and Rozehnal, D.,
2017)
The calculations were carried out with the formulae
given below:
Drag Force,
School of Engineering Undergraduate Programmes Page 9
Paraphrase This Document
Need a fresh take? Get an instant paraphrase of this document with our AI Paraphraser
Aircraft Wing Analysis
FD =−0.5 C A ρ V 2
C is the coefficient of drag of shape
A is the Area of a cross-section of an aerofoil
ρ is the density of a fluid
V is fluid Velocity (considering solid body stationary)
The Reynolds number will be found using the formula:
Re= ρVx
μ
X section distance from the leading edge.
V is the Freestream Velocity of the Fluid.
μ is the Dynamic viscosity.
The Shear Stress can be found using the formula:
τ =μ ( du
dy )
Here,
μ is the Kinematic Viscosity
( du
dy ) is the change in Velocity WRT perpendicular distance.
Boundary-Layer thickness can be found using the
Formula:
δ=5 x /√ ℜ
School of Engineering Undergraduate Programmes Page 10
Aircraft Wing Analysis
Re is the Reynolds number.
x is the Length of theChord
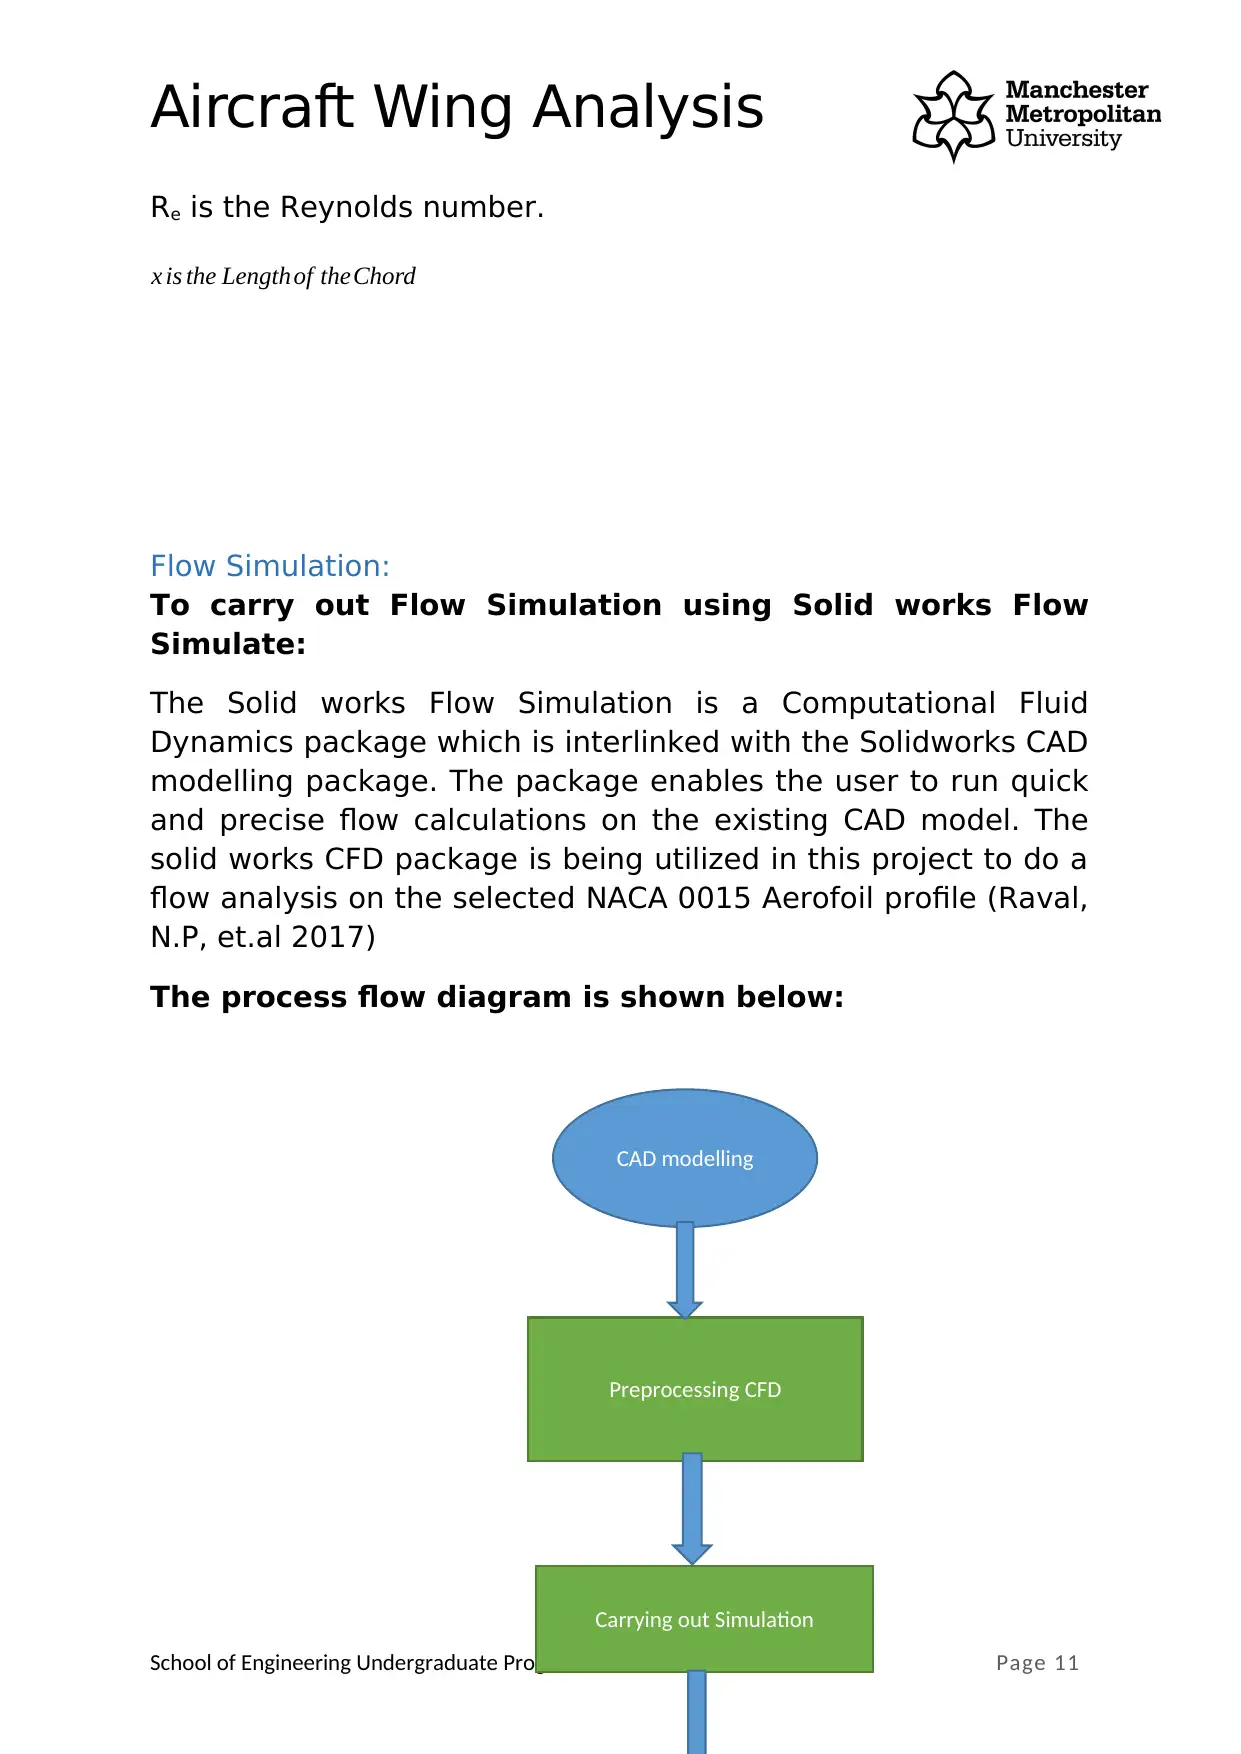
Flow Simulation:
To carry out Flow Simulation using Solid works Flow
Simulate:
The Solid works Flow Simulation is a Computational Fluid
Dynamics package which is interlinked with the Solidworks CAD
modelling package. The package enables the user to run quick
and precise flow calculations on the existing CAD model. The
solid works CFD package is being utilized in this project to do a
flow analysis on the selected NACA 0015 Aerofoil profile (Raval,
N.P, et.al 2017)
The process flow diagram is shown below:
School of Engineering Undergraduate Programmes Page 11
CAD modelling
Preprocessing CFD
Carrying out Simulation
Re is the Reynolds number.
x is the Length of theChord
Flow Simulation:
To carry out Flow Simulation using Solid works Flow
Simulate:
The Solid works Flow Simulation is a Computational Fluid
Dynamics package which is interlinked with the Solidworks CAD
modelling package. The package enables the user to run quick
and precise flow calculations on the existing CAD model. The
solid works CFD package is being utilized in this project to do a
flow analysis on the selected NACA 0015 Aerofoil profile (Raval,
N.P, et.al 2017)
The process flow diagram is shown below:
School of Engineering Undergraduate Programmes Page 11
CAD modelling
Preprocessing CFD
Carrying out Simulation
⊘ This is a preview!⊘
Do you want full access?
Subscribe today to unlock all pages.
Trusted by 1+ million students worldwide
1 out of 27

Your All-in-One AI-Powered Toolkit for Academic Success.
+13062052269
info@desklib.com
Available 24*7 on WhatsApp / Email
![[object Object]](/_next/static/media/star-bottom.7253800d.svg)
Unlock your academic potential
Copyright © 2020–2026 A2Z Services. All Rights Reserved. Developed and managed by ZUCOL.