Data Analysis Report: Australian Airline Data for Sydney Airport
VerifiedAdded on 2022/05/25
|12
|1638
|50
Report
AI Summary
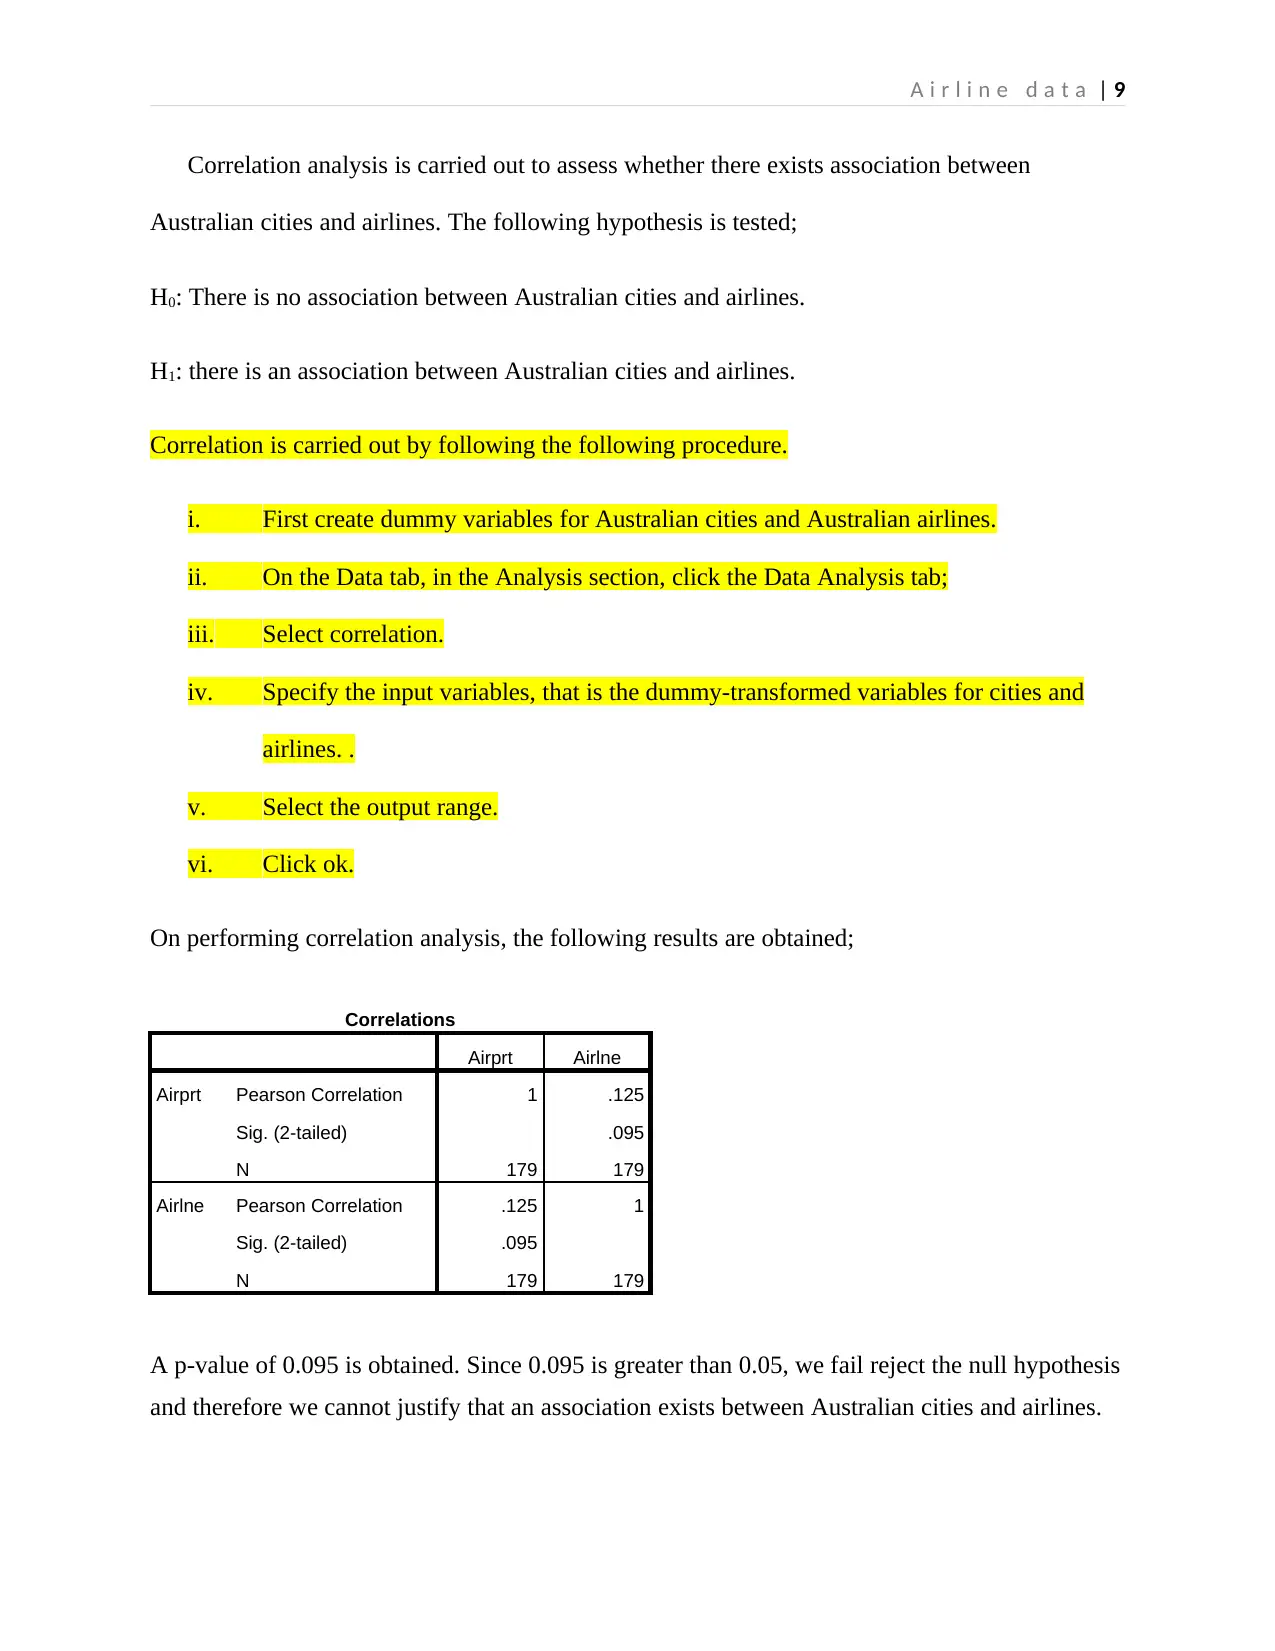
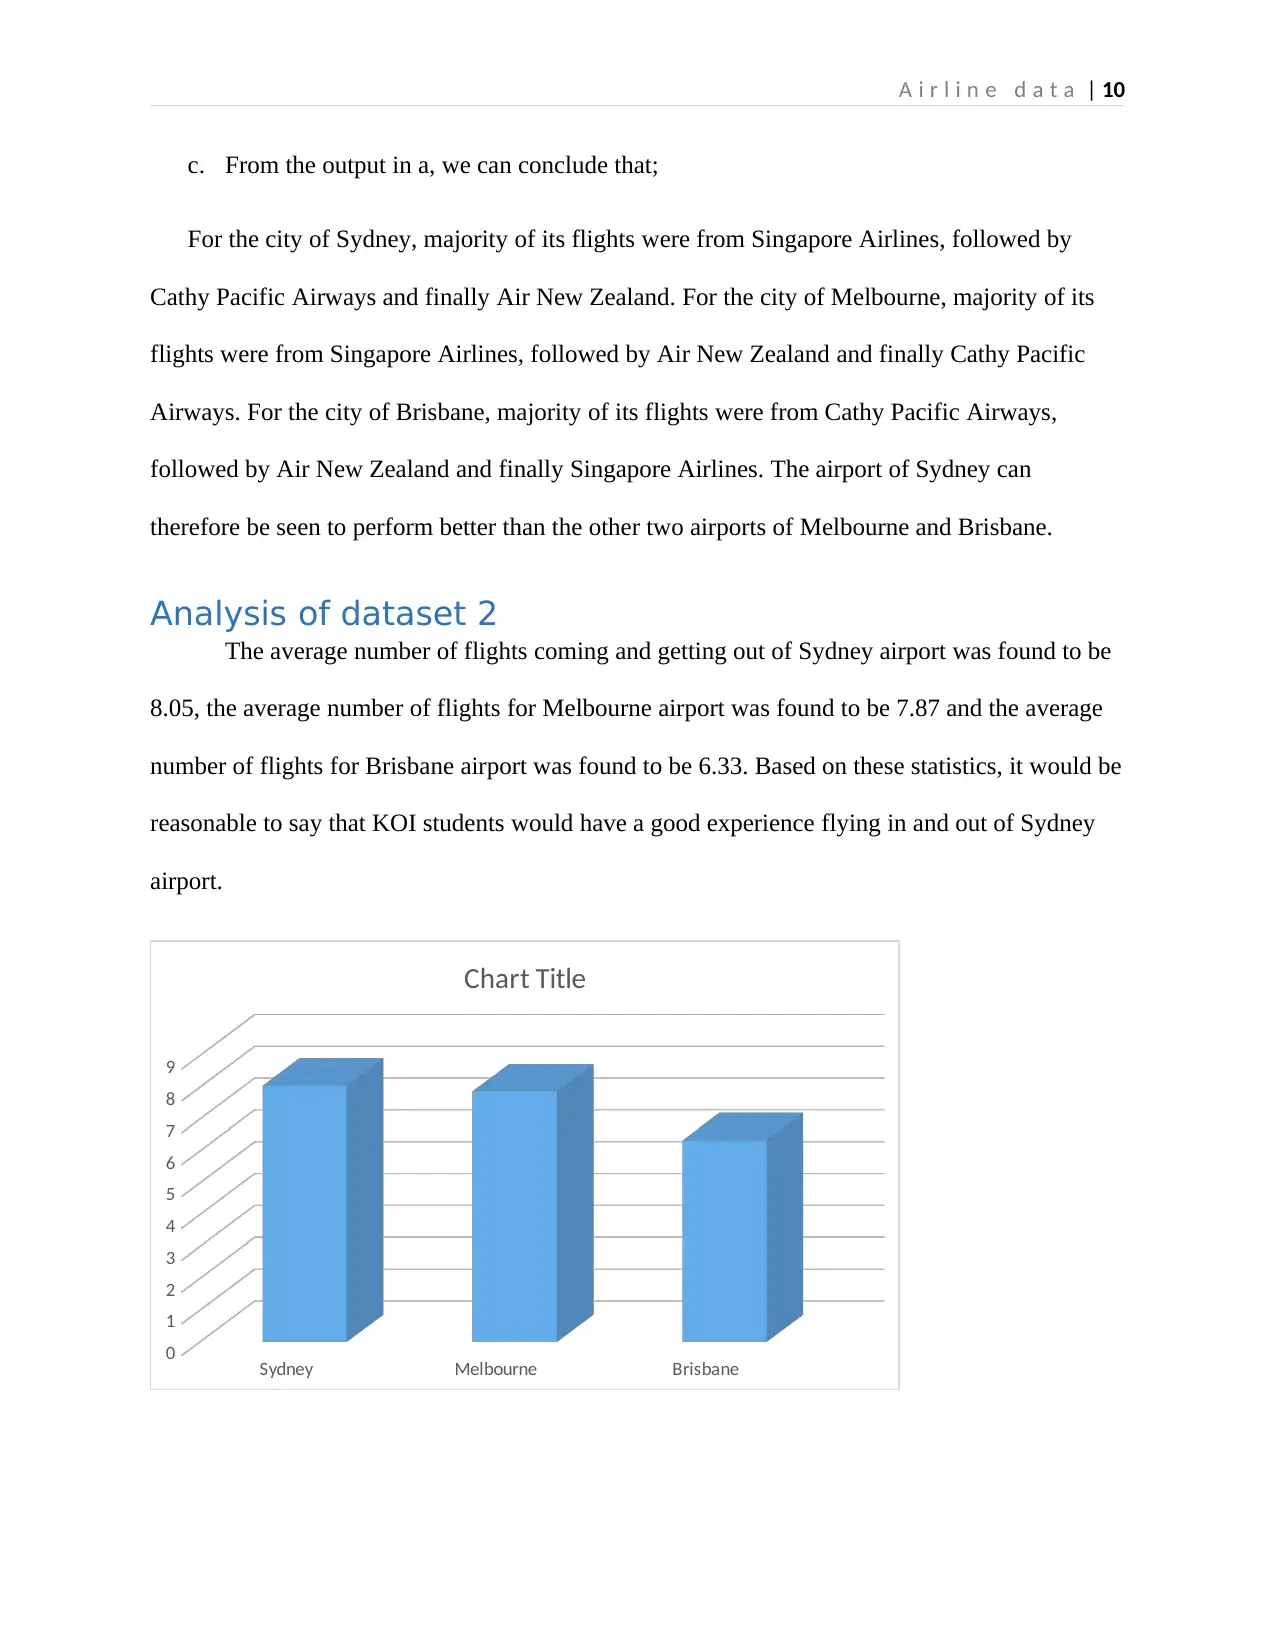
This report provides an analysis of Australian airline data from September 2003 to September 2018, focusing on airport performance and flight characteristics. The study utilizes two datasets: one containing secondary data on airline services and another based on a survey of KOI student flying experiences. The analysis employs statistical tools such as regression analysis, correlation, scatter plots, and frequency histograms to address research questions concerning the distribution of flights, average flight numbers, and associations between cities and airlines. The findings reveal that the distribution of flights is skewed to the right, and the average monthly number of flights does not exceed 30. The report also highlights a lack of association between Australian cities and airlines. Furthermore, the analysis indicates that Sydney Airport outperforms Melbourne and Brisbane airports in terms of flight volume. Recommendations are provided for Sydney Airport to enhance its competitiveness, including efforts to increase flights with Air New Zealand and expand the scope of airline operations. The report concludes with a discussion of the results and references to relevant literature.
1 out of 12
Related Documents


Your All-in-One AI-Powered Toolkit for Academic Success.
+13062052269
info@desklib.com
Available 24*7 on WhatsApp / Email
![[object Object]](/_next/static/media/star-bottom.7253800d.svg)
Copyright © 2020–2026 A2Z Services. All Rights Reserved. Developed and managed by ZUCOL.