MIS772 Predictive Analytics Assignment A2: AQA Airline Analysis
VerifiedAdded on 2023/06/11
|11
|1909
|69
Report
AI Summary
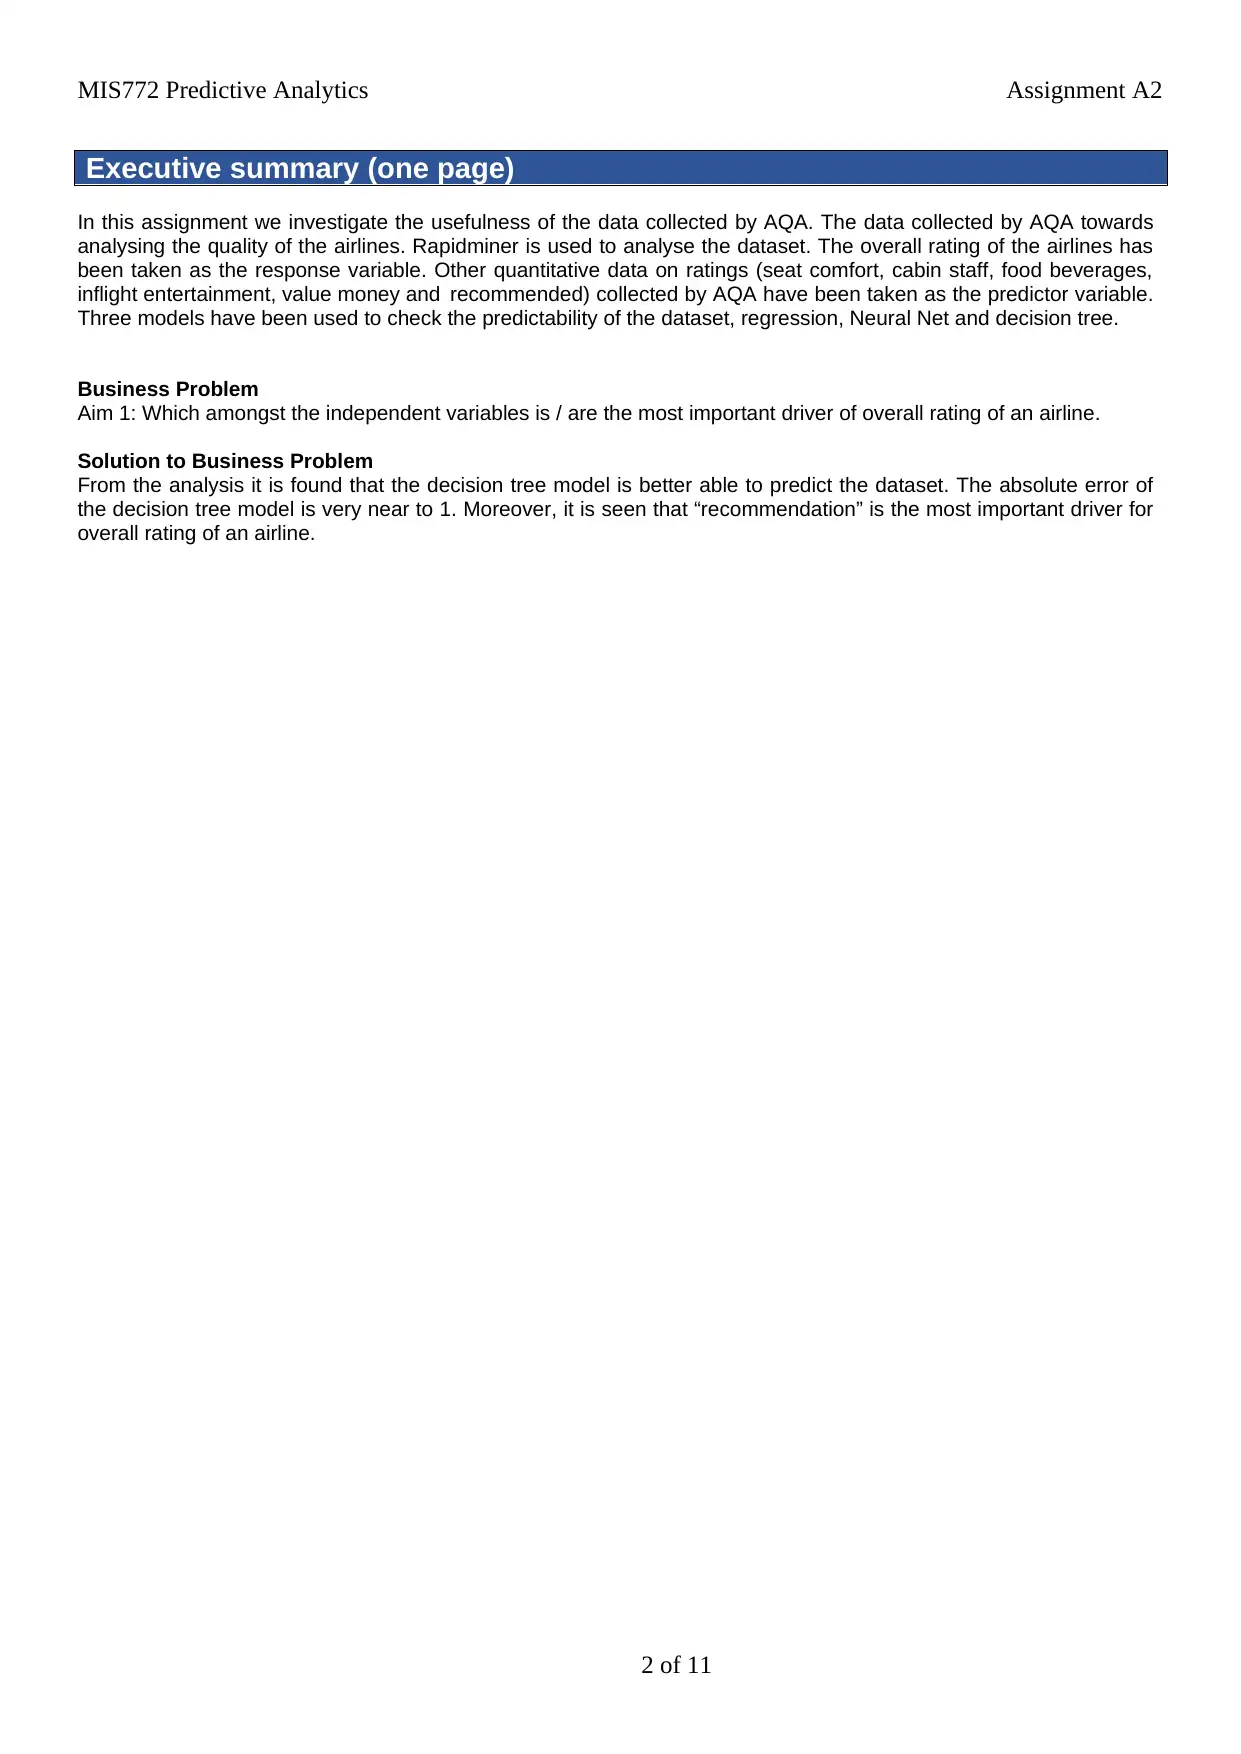
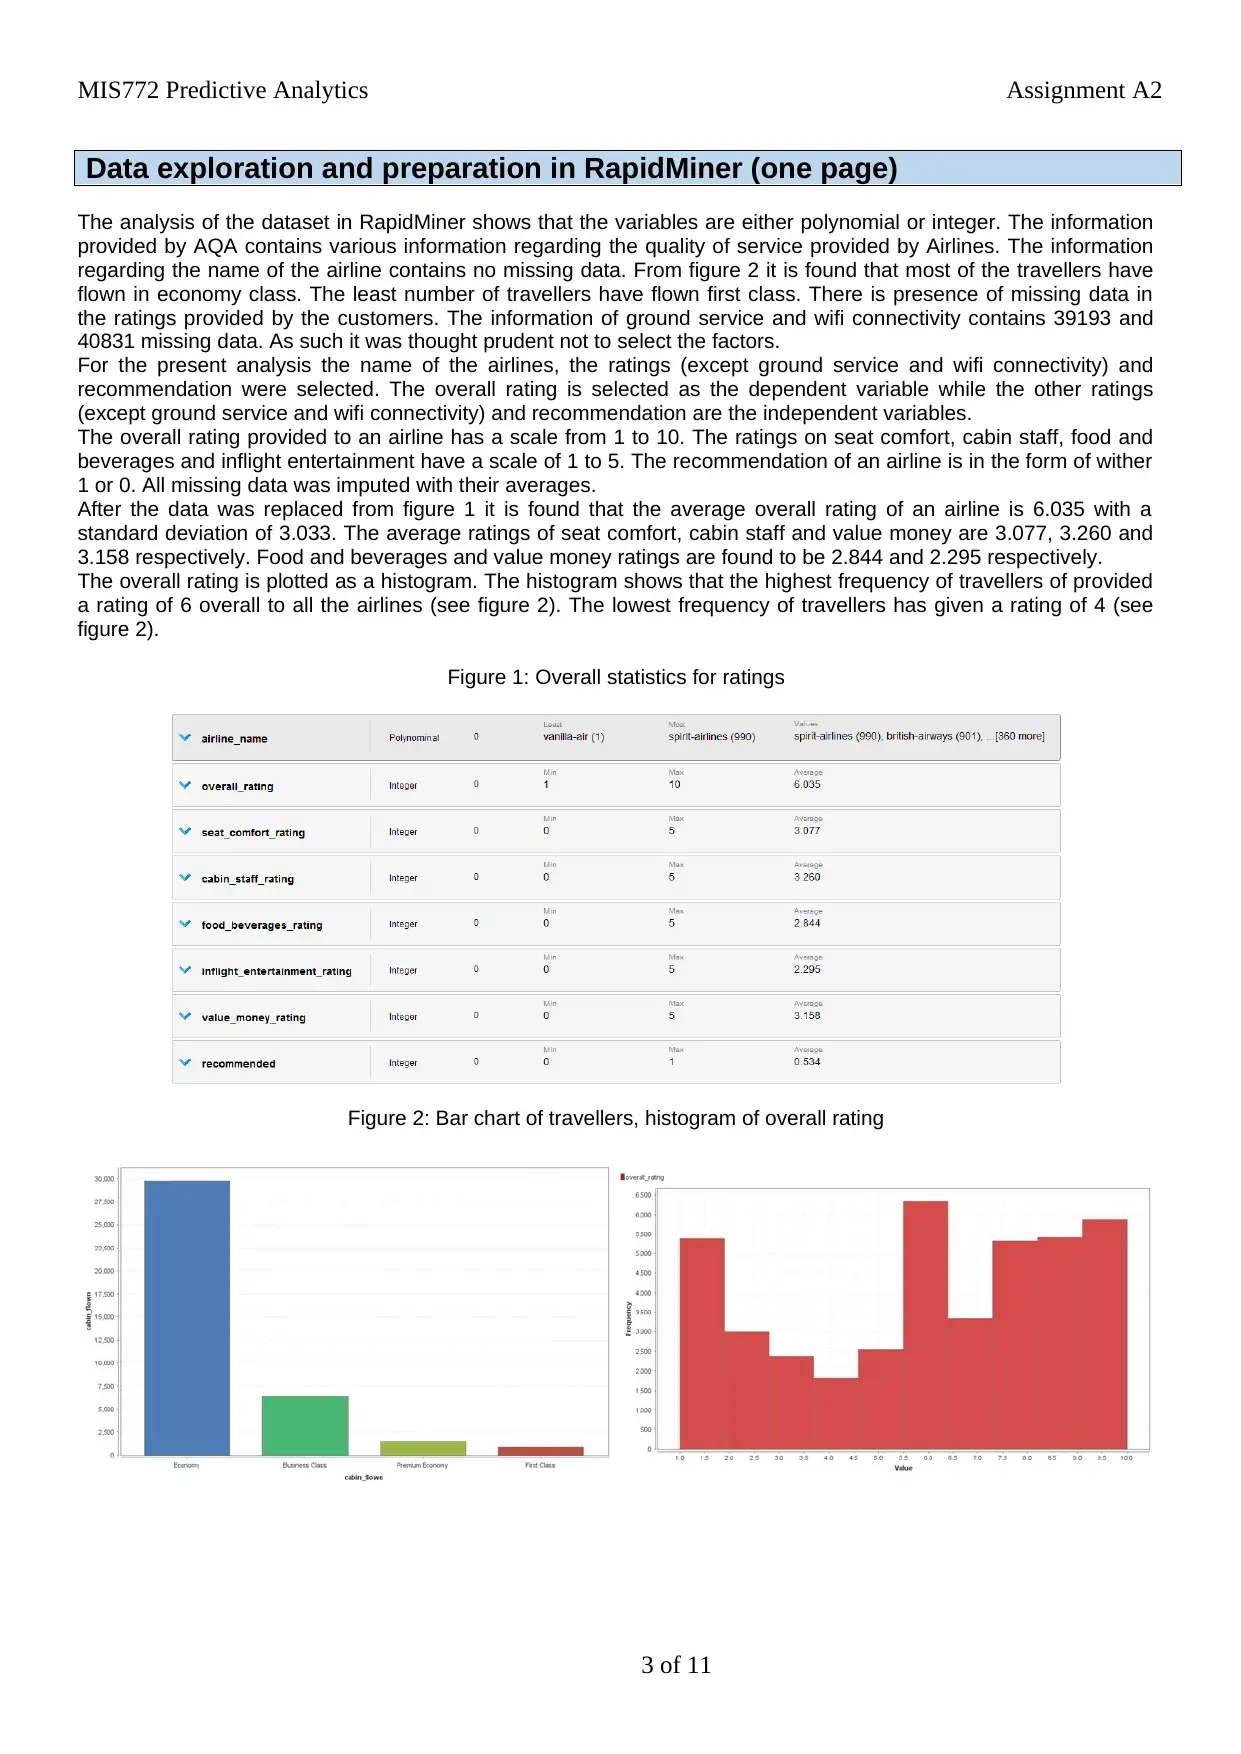
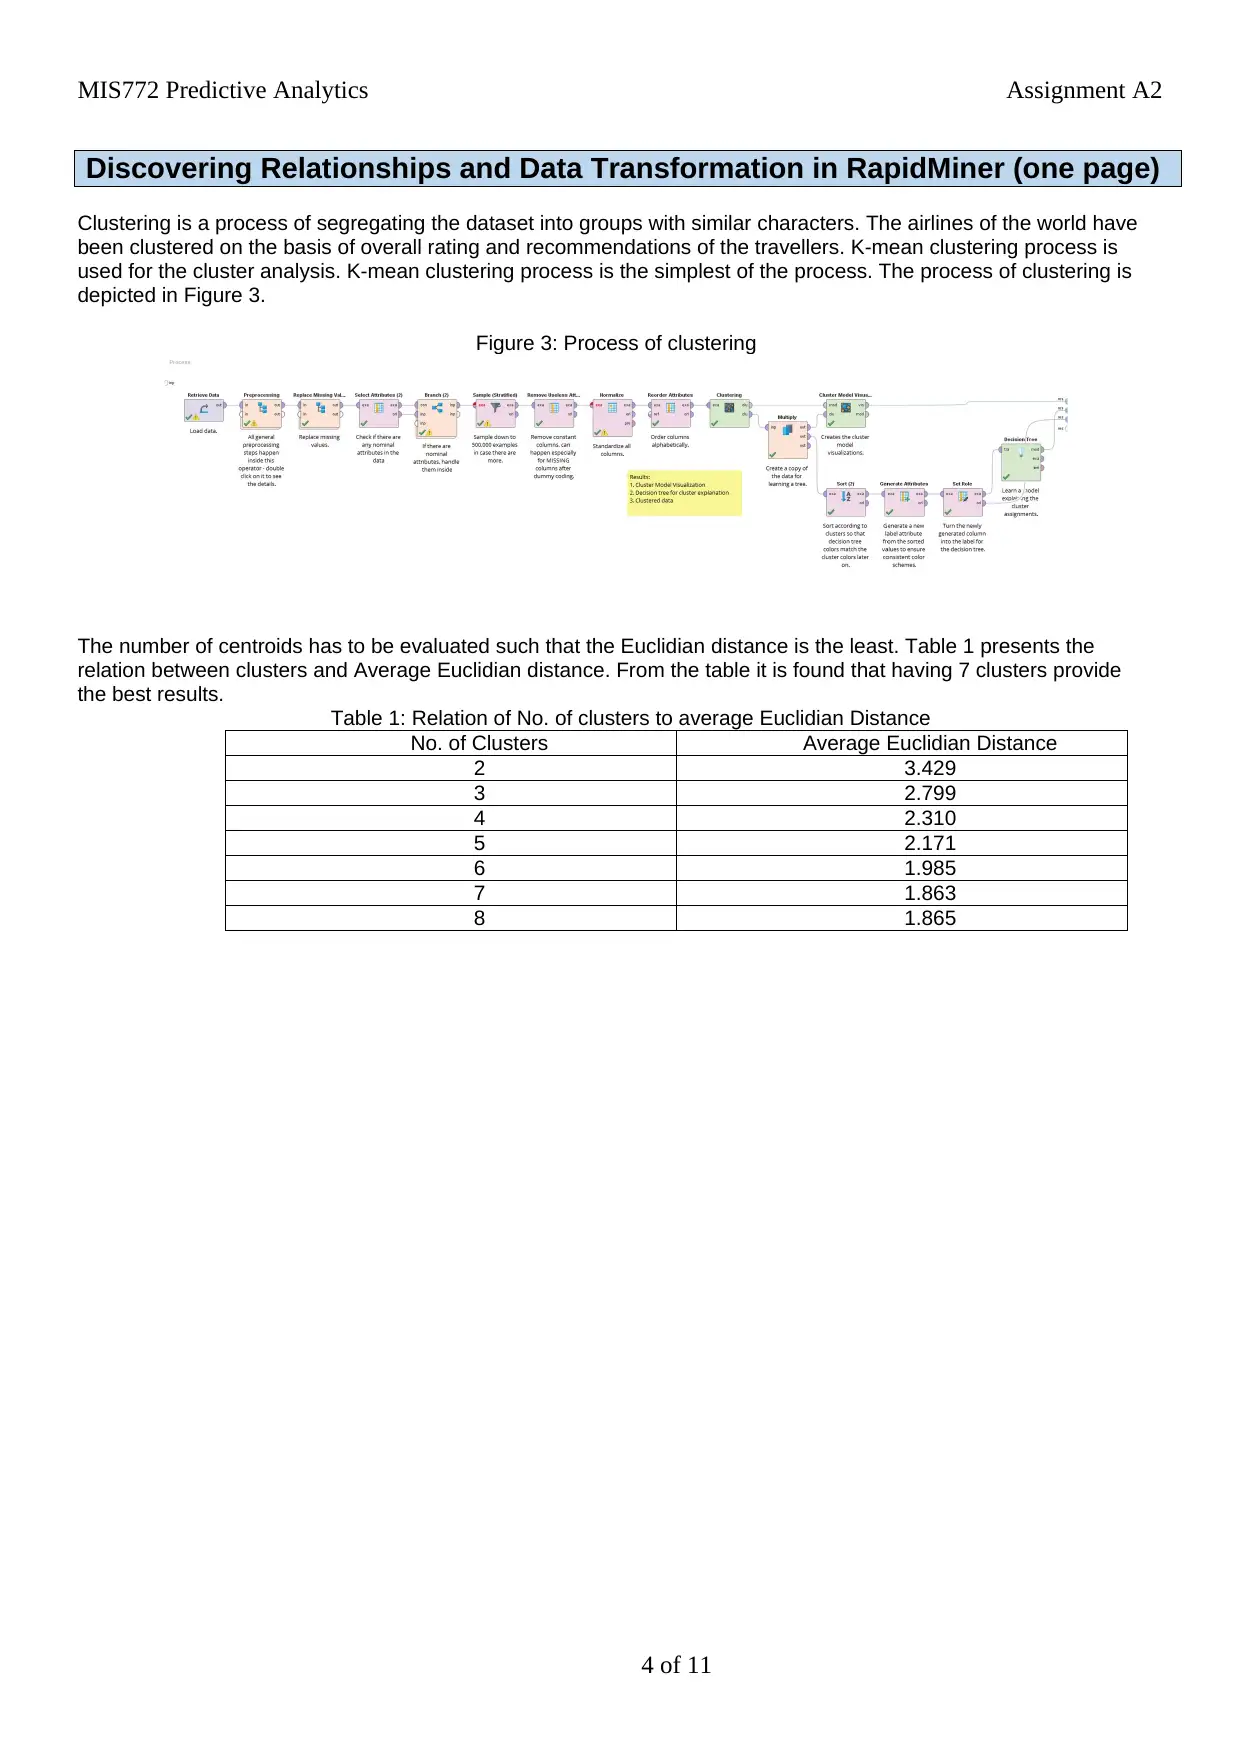
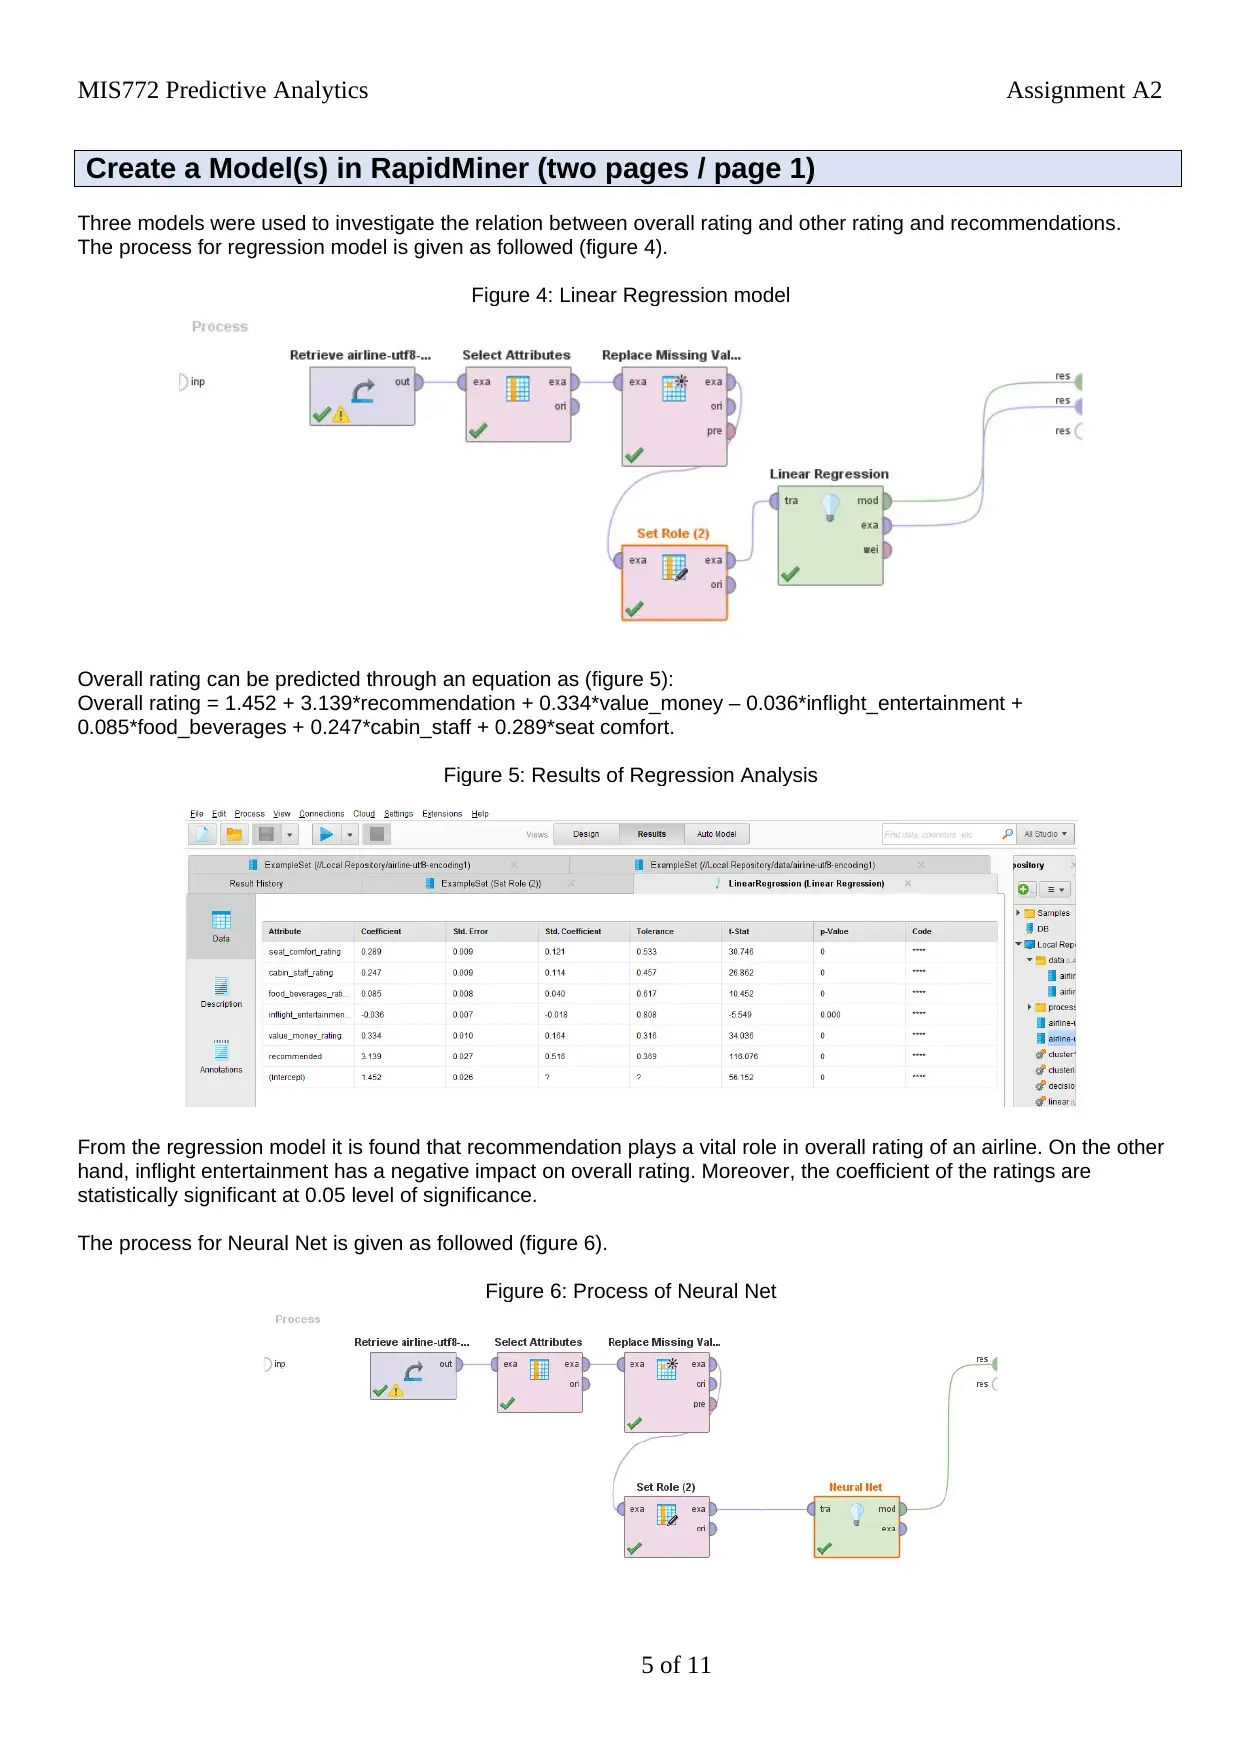
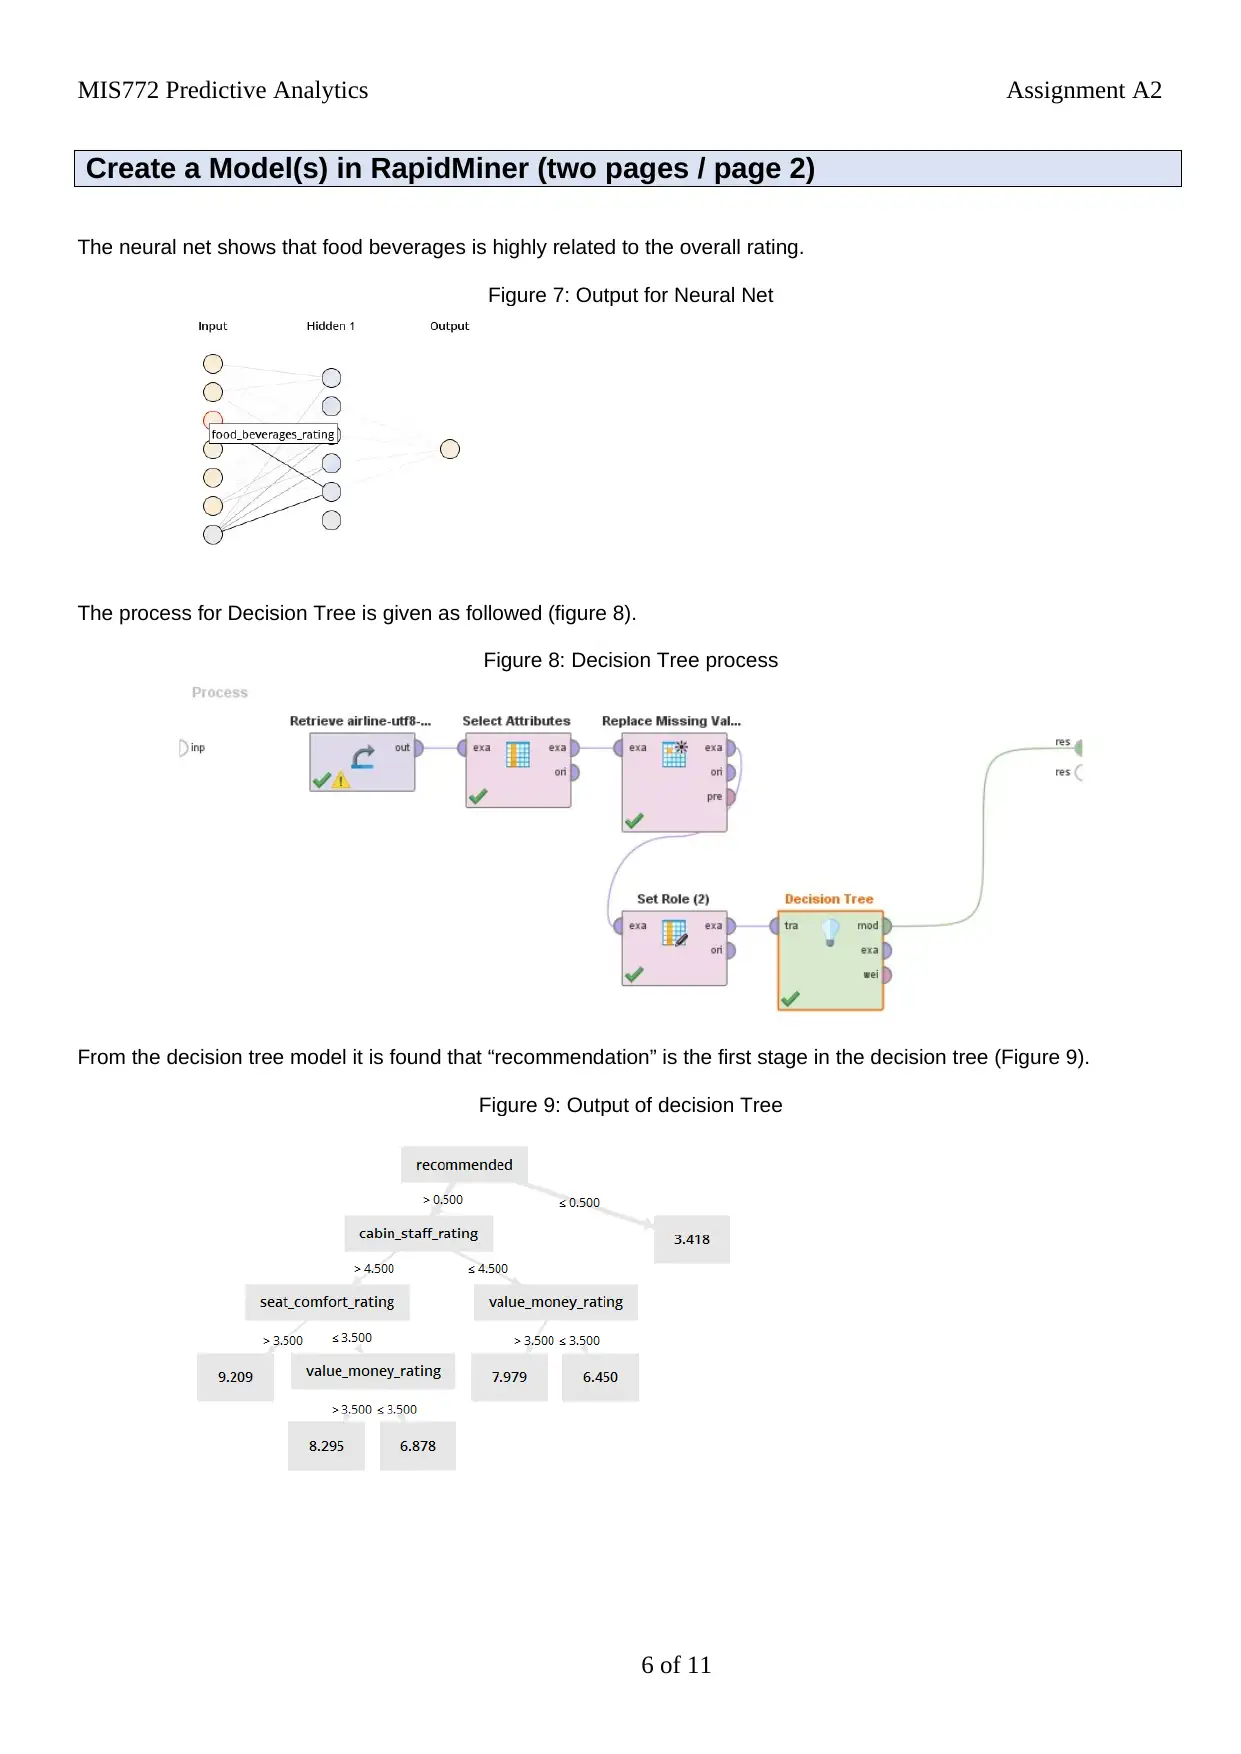
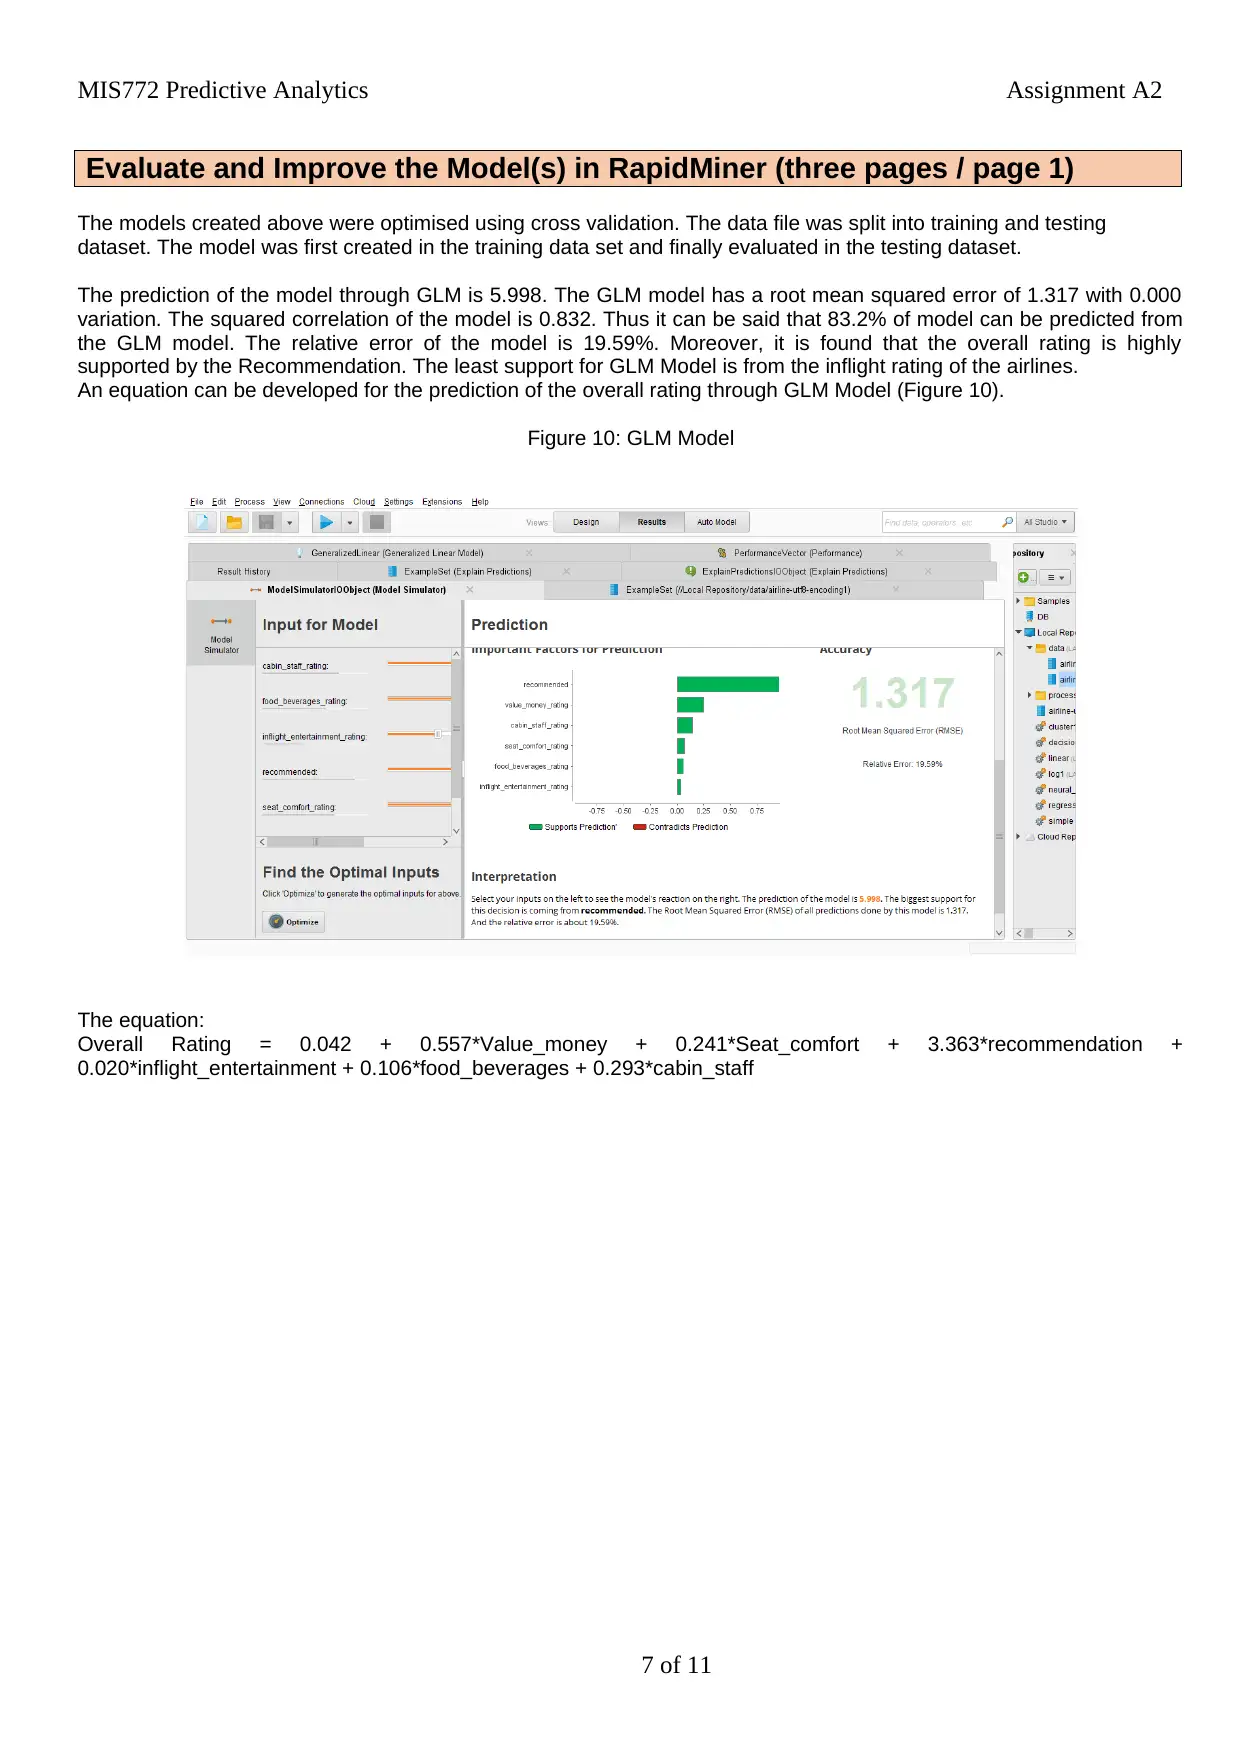
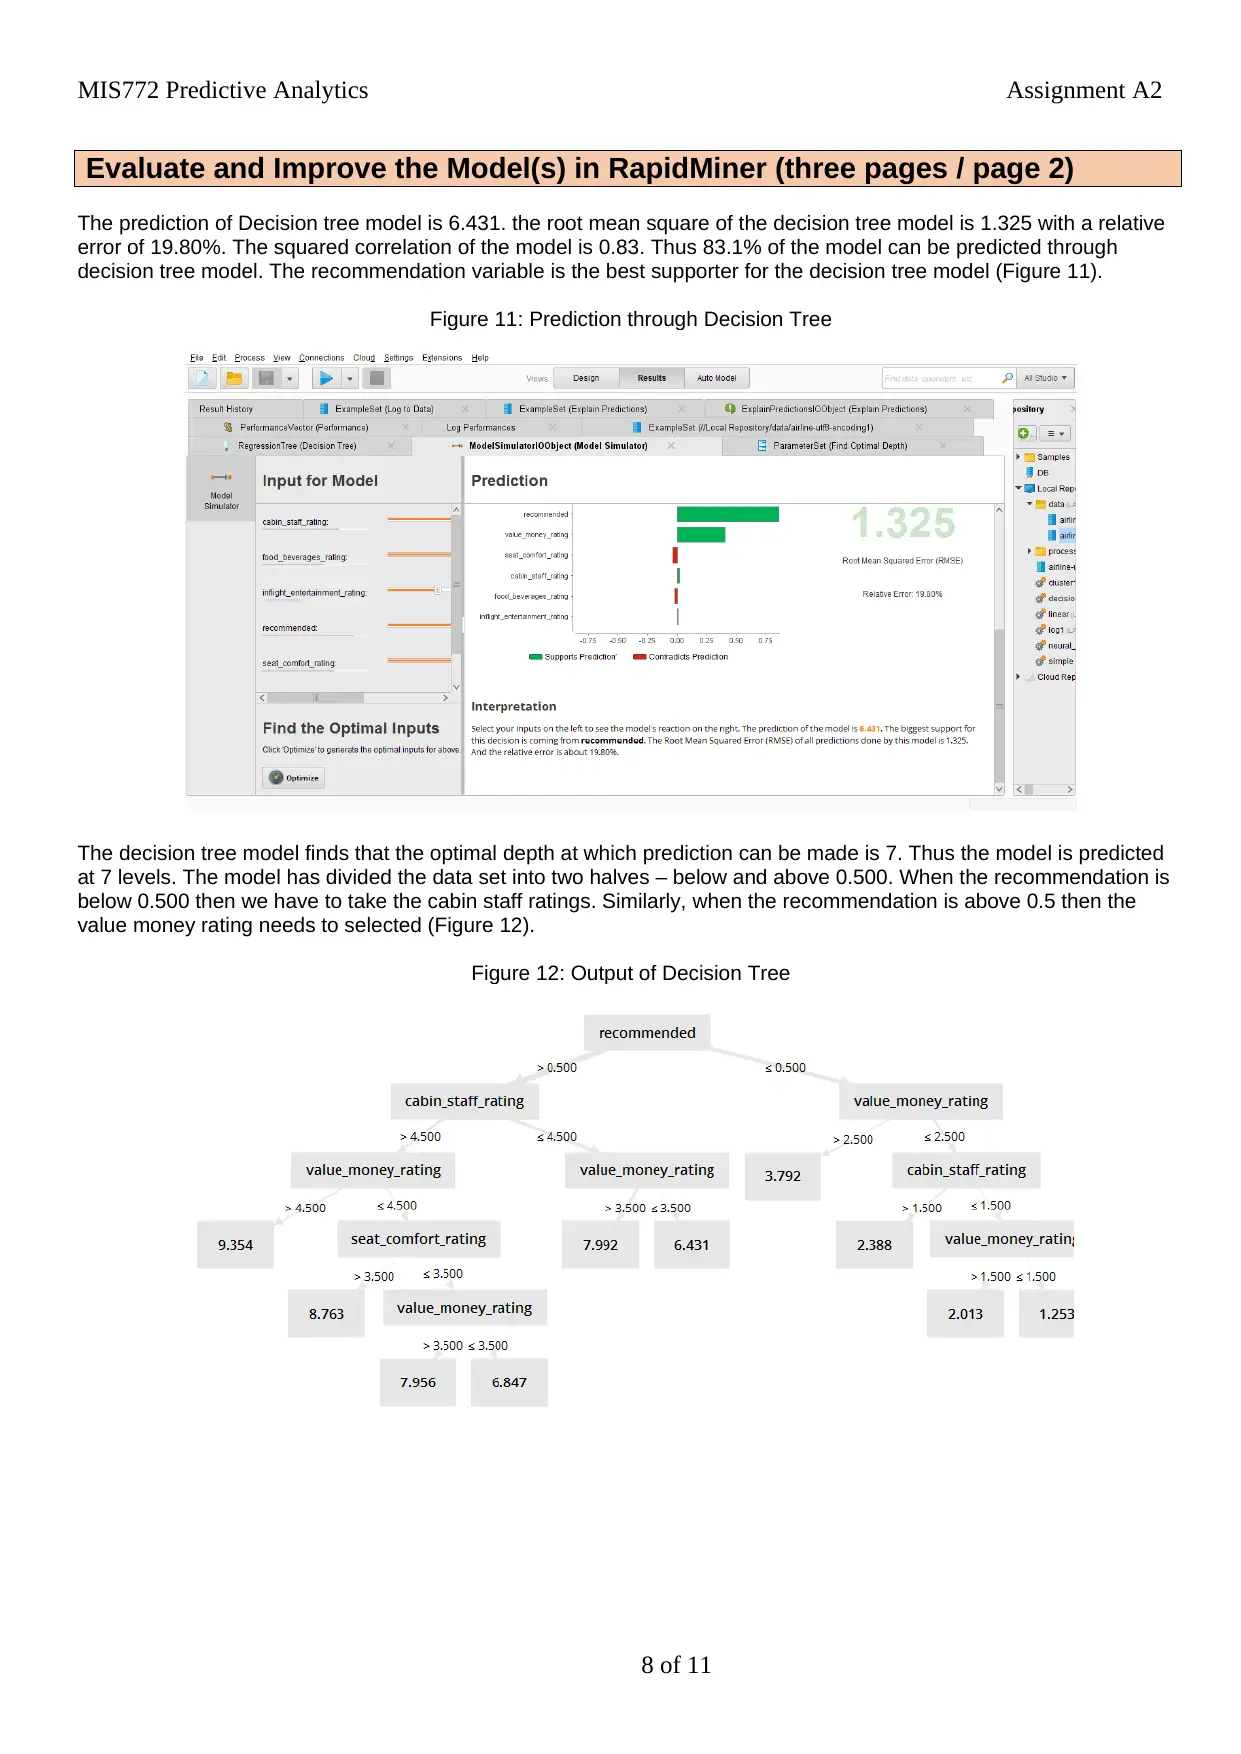
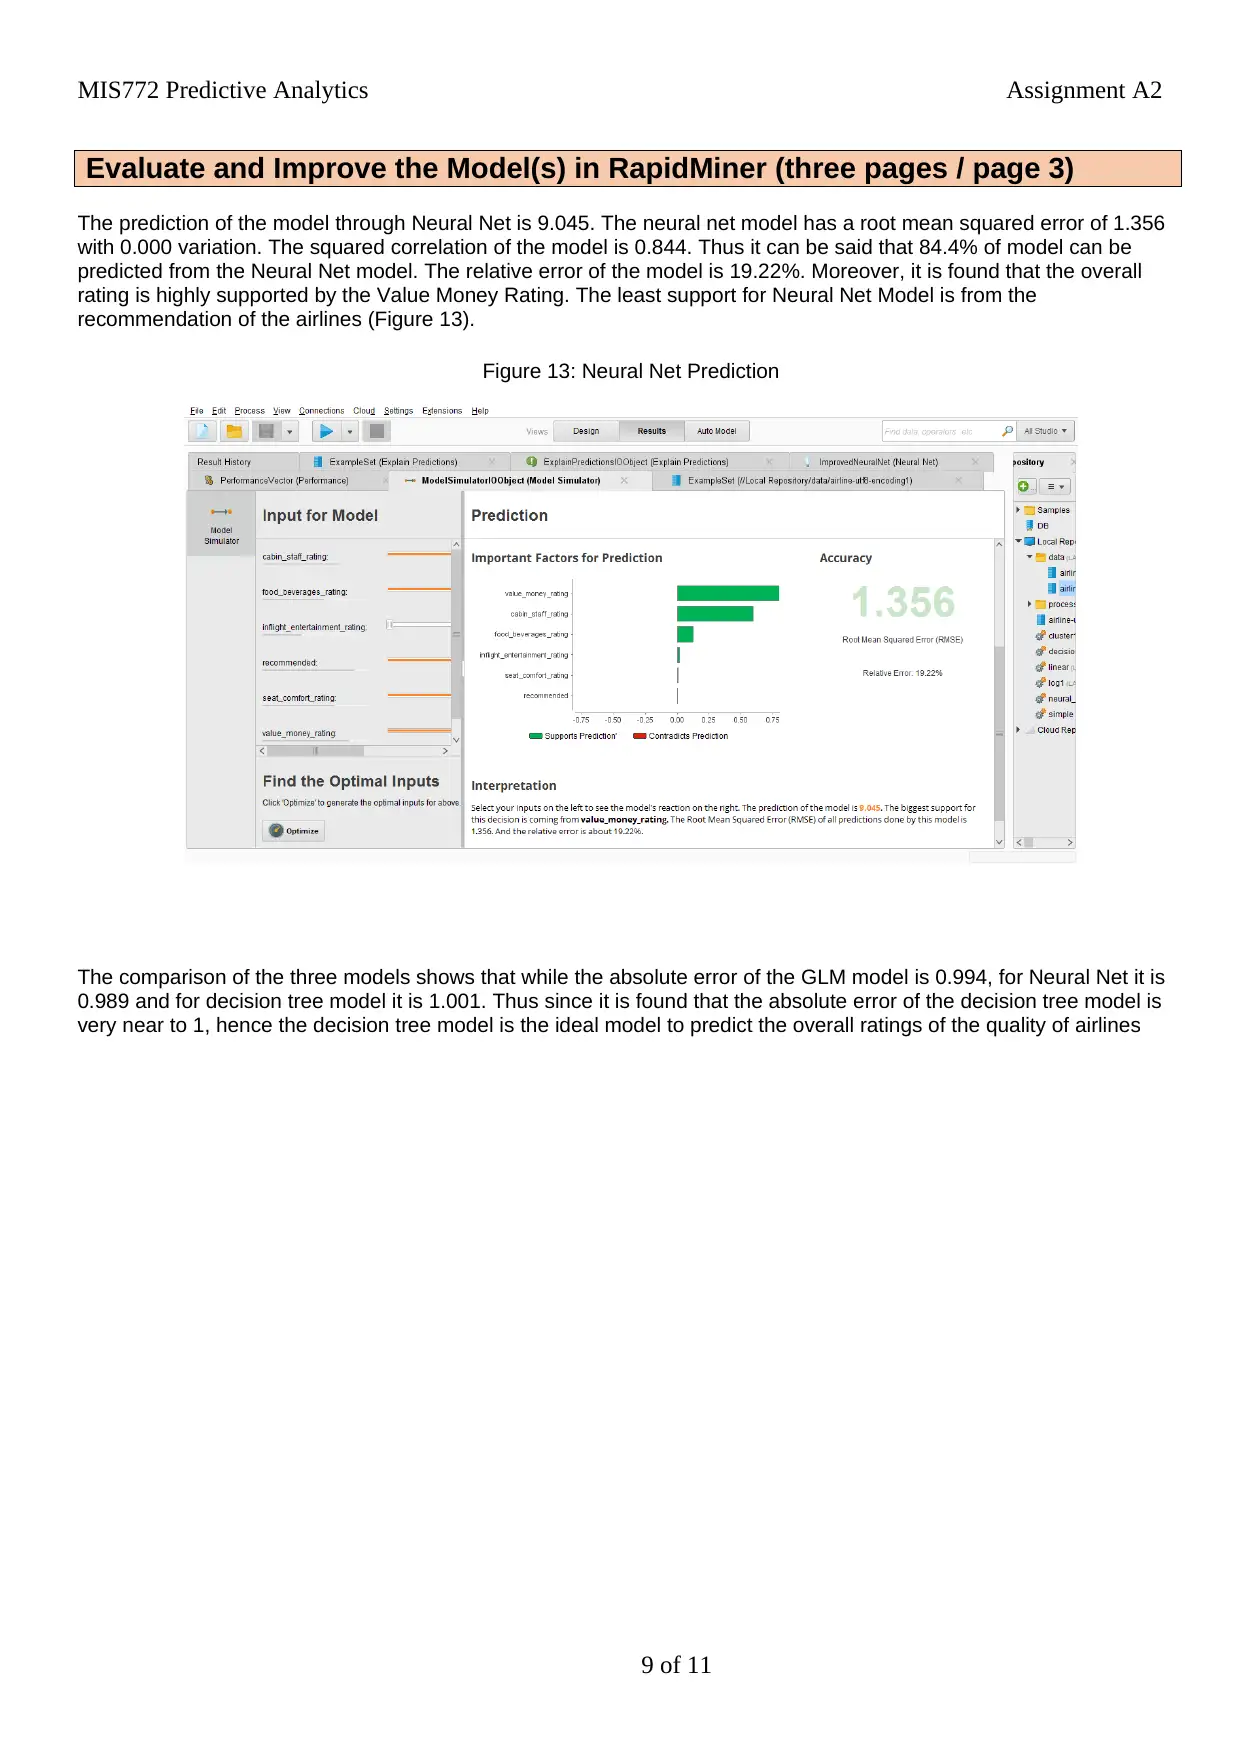
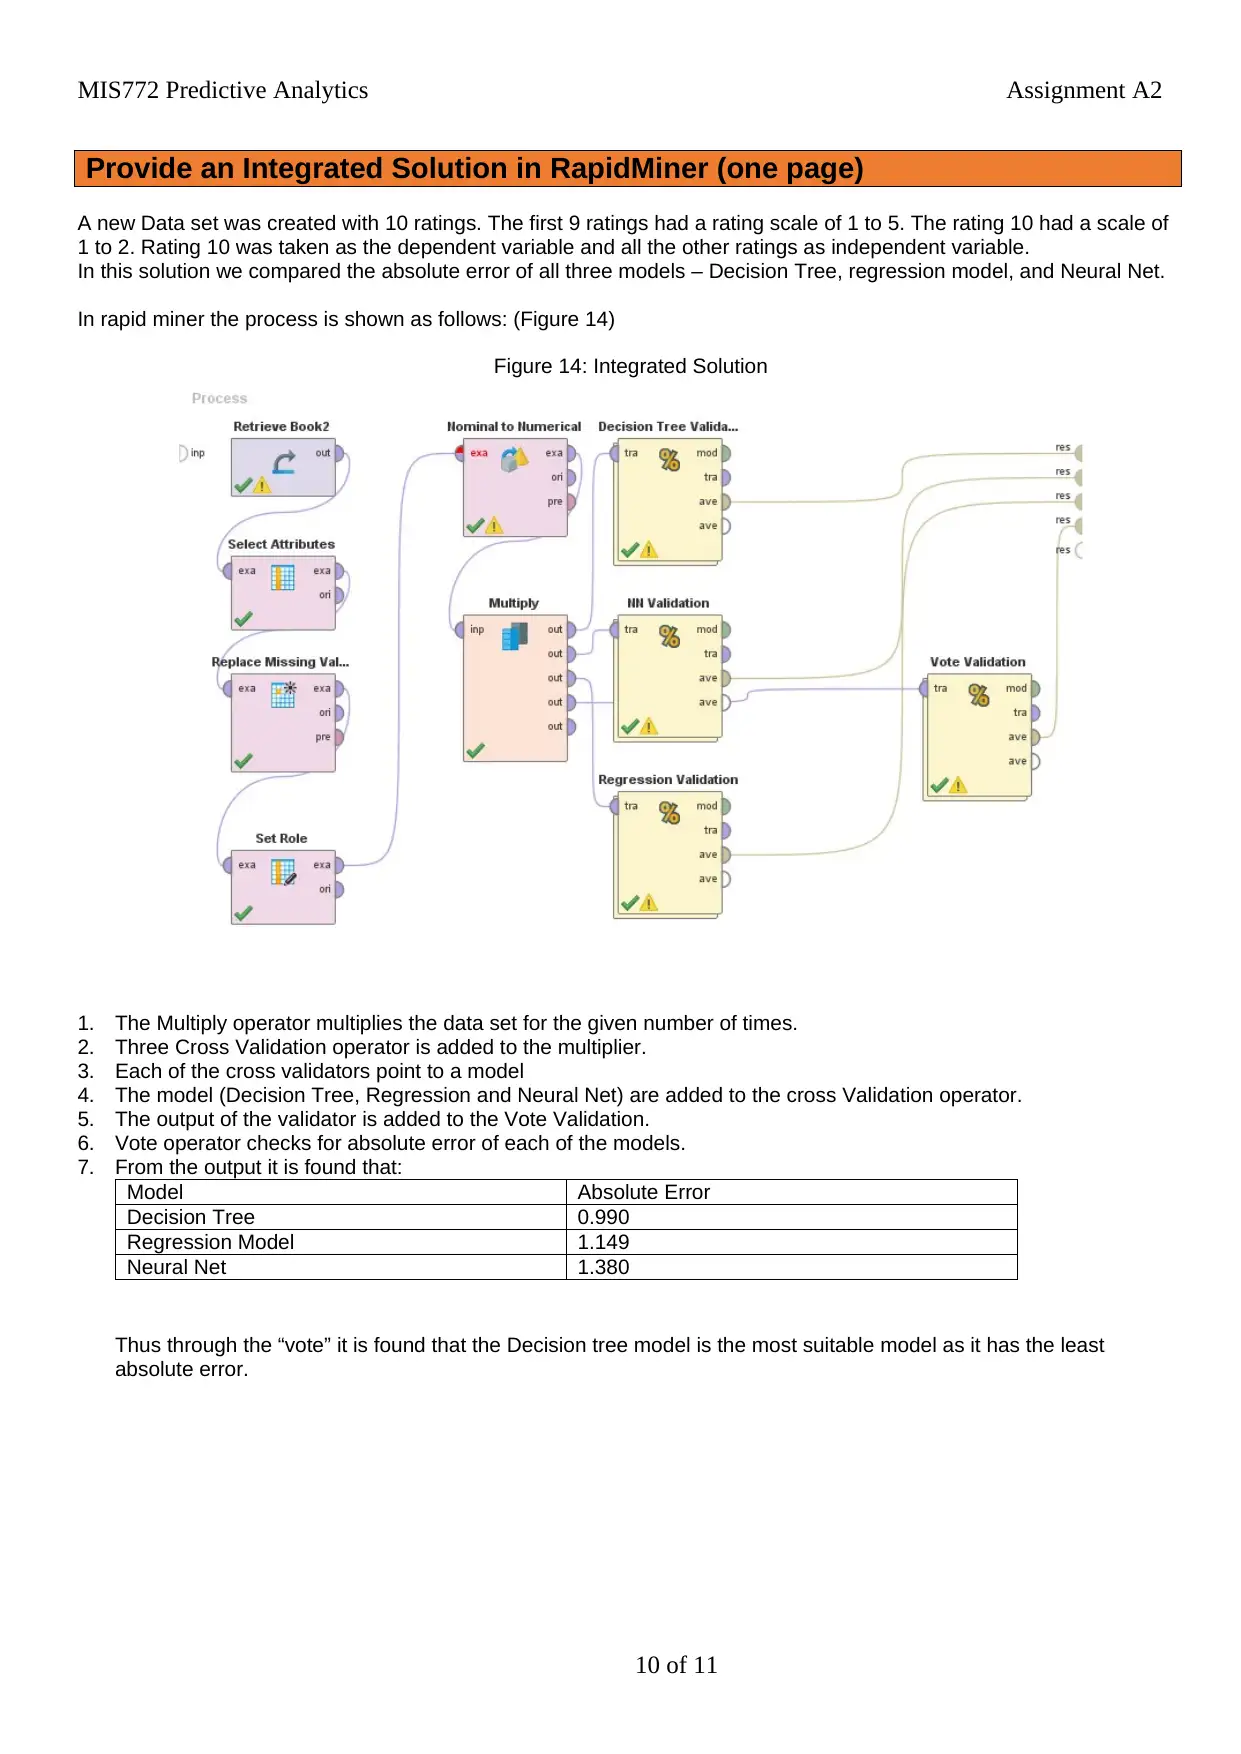
This report investigates the data collected by AQA to analyze airline quality using Rapidminer. The overall rating of airlines is the response variable, with other ratings (seat comfort, cabin staff, food, in-flight entertainment, value for money, and recommendation) as predictor variables. Three models—regression, neural net, and decision tree—are used to assess predictability. The analysis reveals that the decision tree model is the most effective, with 'recommendation' being the most significant driver for overall airline rating. Data exploration includes handling missing values and clustering analysis using K-means, determining that seven clusters provide optimal results. The models are optimized using cross-validation, splitting data into training and testing sets, and their performance is compared based on absolute error. The integrated solution demonstrates that the decision tree model remains the most suitable due to its lowest absolute error when predicting airline ratings.


1 out of 11
Related Documents


Your All-in-One AI-Powered Toolkit for Academic Success.
+13062052269
info@desklib.com
Available 24*7 on WhatsApp / Email
![[object Object]](/_next/static/media/star-bottom.7253800d.svg)
Copyright © 2020–2026 A2Z Services. All Rights Reserved. Developed and managed by ZUCOL.