HA3032 Auditing: Financial Statement Analysis of Amani Gold Limited
VerifiedAdded on 2023/06/11
|14
|4051
|220
Report
AI Summary
This report focuses on the financial statement analysis of ASX-listed Amani Gold Limited, examining the company's performance over three years. It covers the company's business operations, industry overview, and investing and financing activities. Financial ratios, including current ratio, debt-equity ...
Running head: AUDITING
Auditing
Name of the student
Name of the university
Student ID
Author note
Auditing
Name of the student
Name of the university
Student ID
Author note
Paraphrase This Document
Need a fresh take? Get an instant paraphrase of this document with our AI Paraphraser
AUDITING
Table of Contents
Introduction................................................................................................................................2
Nature of the company and the industry....................................................................................2
Analytical procedures of financial statement.............................................................................3
Calculation of materiality...........................................................................................................5
Relevant financial report assertions...........................................................................................7
Comprehensive set for audit work steps....................................................................................9
Conclusion................................................................................................................................11
Reference list............................................................................................................................12
1
AUDITING
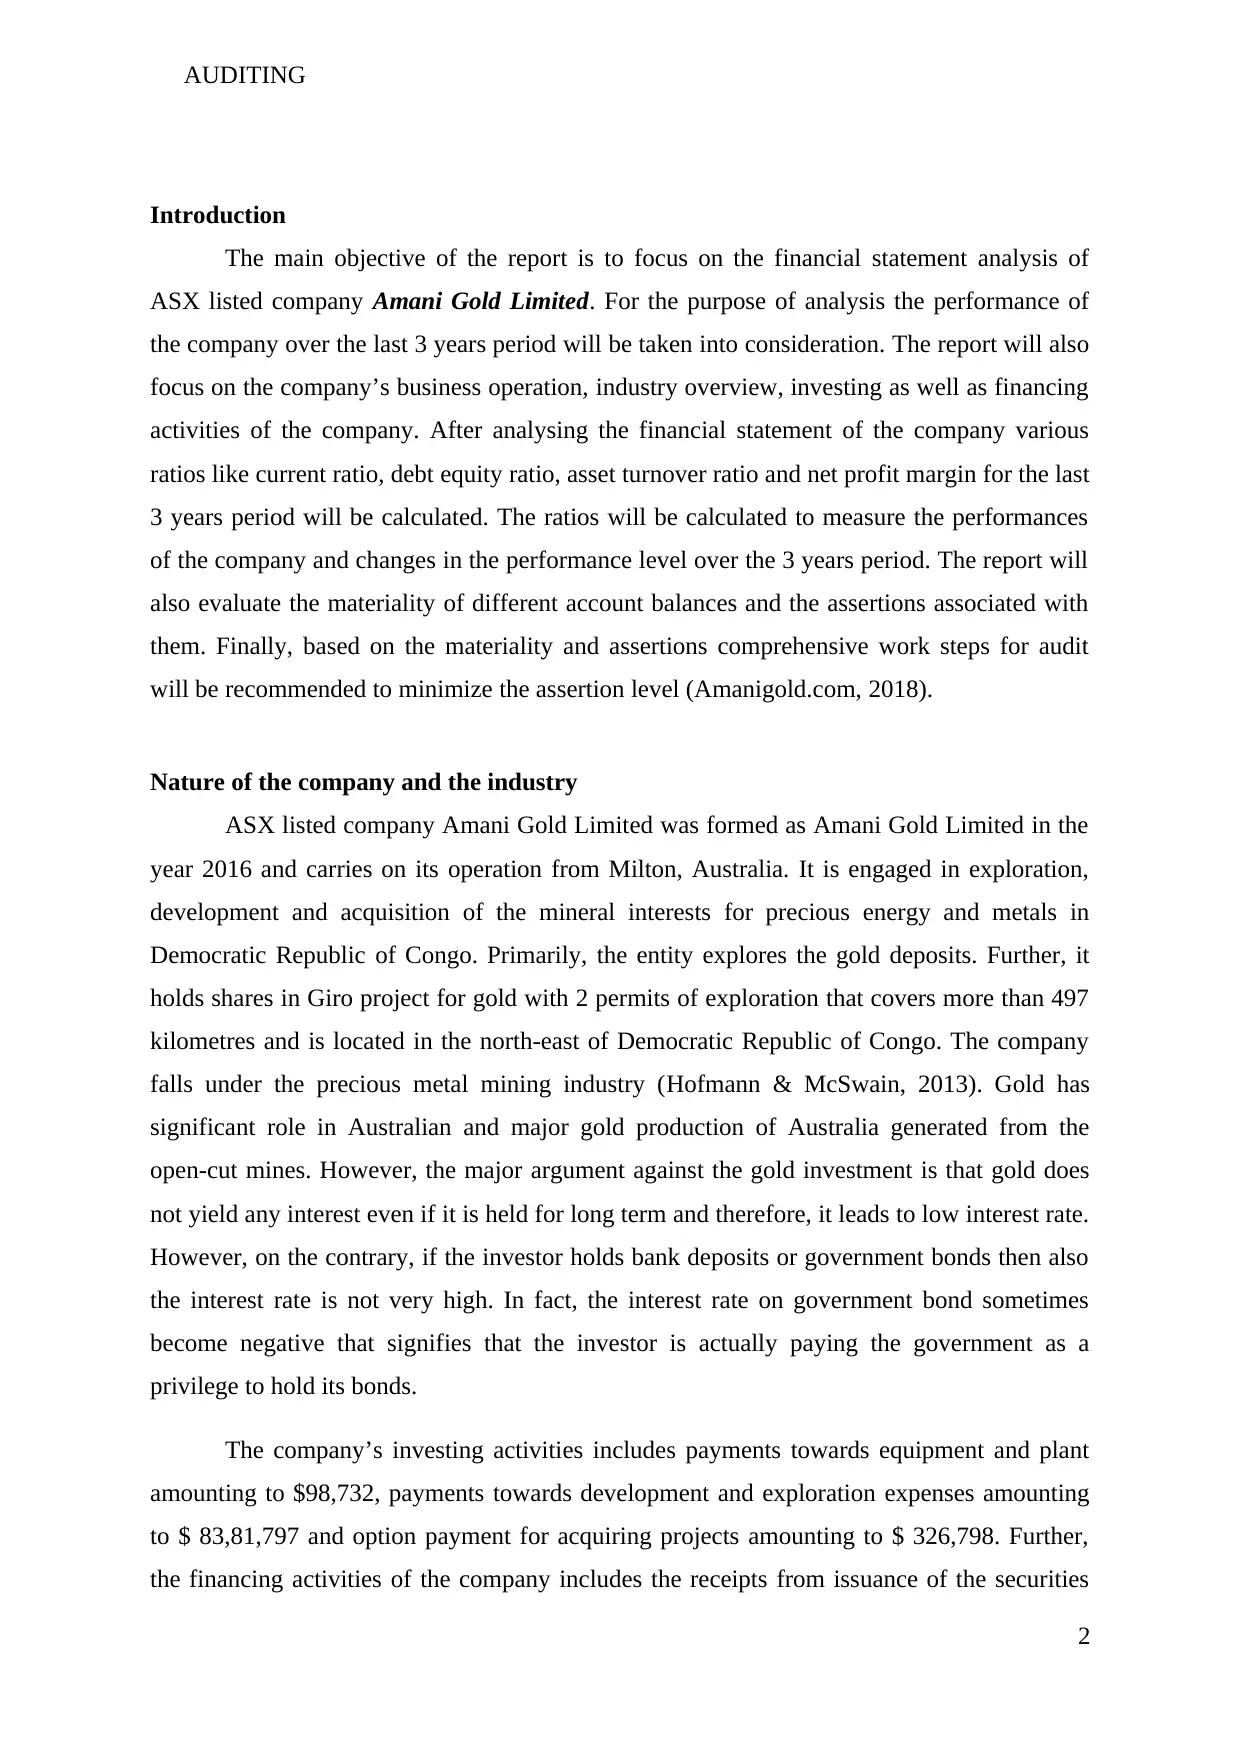
Introduction
The main objective of the report is to focus on the financial statement analysis of
ASX listed company Amani Gold Limited. For the purpose of analysis the performance of
the company over the last 3 years period will be taken into consideration. The report will also
focus on the company’s business operation, industry overview, investing as well as financing
activities of the company. After analysing the financial statement of the company various
ratios like current ratio, debt equity ratio, asset turnover ratio and net profit margin for the last
3 years period will be calculated. The ratios will be calculated to measure the performances
of the company and changes in the performance level over the 3 years period. The report will
also evaluate the materiality of different account balances and the assertions associated with
them. Finally, based on the materiality and assertions comprehensive work steps for audit
will be recommended to minimize the assertion level (Amanigold.com, 2018).
Nature of the company and the industry
ASX listed company Amani Gold Limited was formed as Amani Gold Limited in the
year 2016 and carries on its operation from Milton, Australia. It is engaged in exploration,
development and acquisition of the mineral interests for precious energy and metals in
Democratic Republic of Congo. Primarily, the entity explores the gold deposits. Further, it
holds shares in Giro project for gold with 2 permits of exploration that covers more than 497
kilometres and is located in the north-east of Democratic Republic of Congo. The company
falls under the precious metal mining industry (Hofmann & McSwain, 2013). Gold has
significant role in Australian and major gold production of Australia generated from the
open-cut mines. However, the major argument against the gold investment is that gold does
not yield any interest even if it is held for long term and therefore, it leads to low interest rate.
However, on the contrary, if the investor holds bank deposits or government bonds then also
the interest rate is not very high. In fact, the interest rate on government bond sometimes
become negative that signifies that the investor is actually paying the government as a
privilege to hold its bonds.
The company’s investing activities includes payments towards equipment and plant
amounting to $98,732, payments towards development and exploration expenses amounting
to $ 83,81,797 and option payment for acquiring projects amounting to $ 326,798. Further,
the financing activities of the company includes the receipts from issuance of the securities
2
You're viewing a preview
Unlock full access by subscribing today!


AUDITING
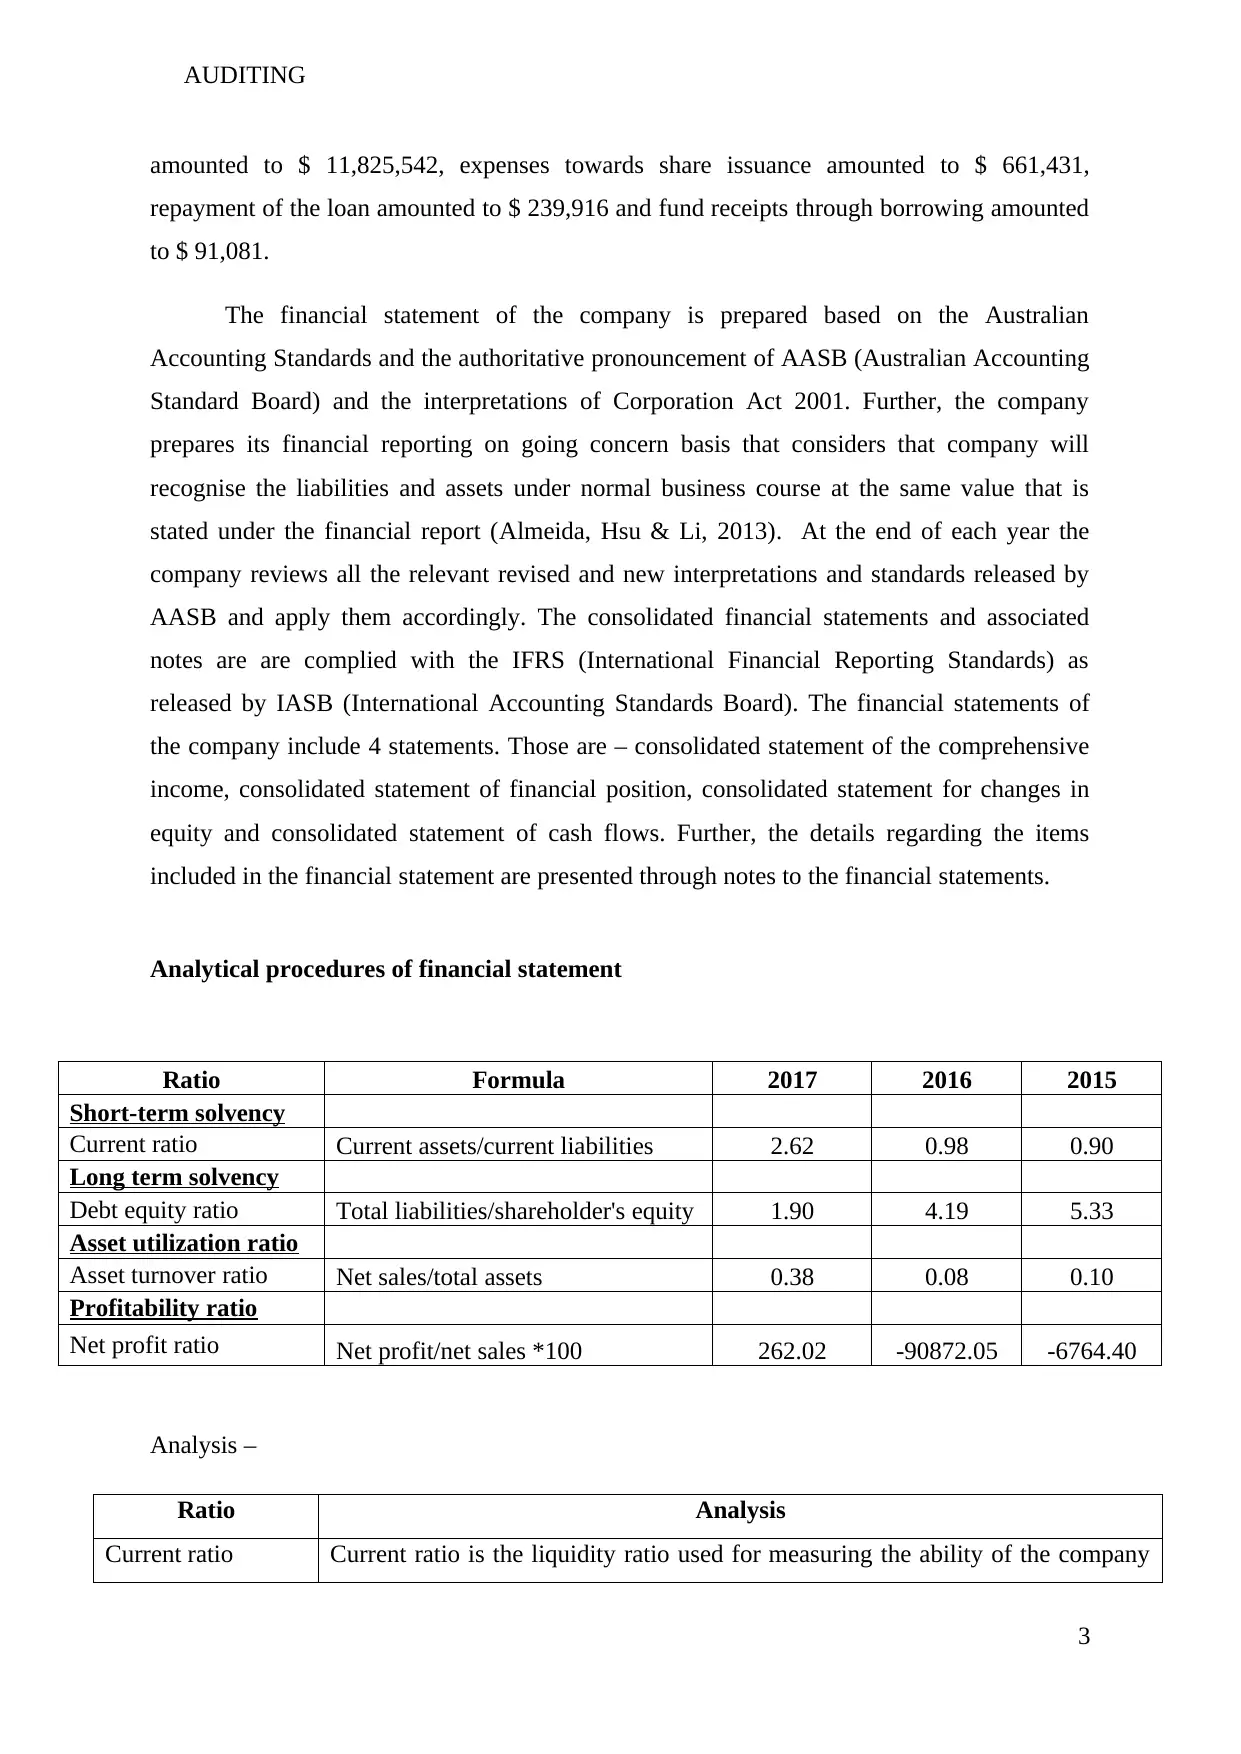
amounted to $ 11,825,542, expenses towards share issuance amounted to $ 661,431,
repayment of the loan amounted to $ 239,916 and fund receipts through borrowing amounted
to $ 91,081.
The financial statement of the company is prepared based on the Australian
Accounting Standards and the authoritative pronouncement of AASB (Australian Accounting
Standard Board) and the interpretations of Corporation Act 2001. Further, the company
prepares its financial reporting on going concern basis that considers that company will
recognise the liabilities and assets under normal business course at the same value that is
stated under the financial report (Almeida, Hsu & Li, 2013). At the end of each year the
company reviews all the relevant revised and new interpretations and standards released by
AASB and apply them accordingly. The consolidated financial statements and associated
notes are are complied with the IFRS (International Financial Reporting Standards) as
released by IASB (International Accounting Standards Board). The financial statements of
the company include 4 statements. Those are – consolidated statement of the comprehensive
income, consolidated statement of financial position, consolidated statement for changes in
equity and consolidated statement of cash flows. Further, the details regarding the items
included in the financial statement are presented through notes to the financial statements.
Analytical procedures of financial statement
Ratio Formula 2017 2016 2015
Short-term solvency
Current ratio Current assets/current liabilities 2.62 0.98 0.90
Long term solvency
Debt equity ratio Total liabilities/shareholder's equity 1.90 4.19 5.33
Asset utilization ratio
Asset turnover ratio Net sales/total assets 0.38 0.08 0.10
Profitability ratio
Net profit ratio Net profit/net sales *100 262.02 -90872.05 -6764.40
Analysis –
Ratio Analysis
Current ratio Current ratio is the liquidity ratio used for measuring the ability of the company
3
Paraphrase This Document
Need a fresh take? Get an instant paraphrase of this document with our AI Paraphraser
AUDITING
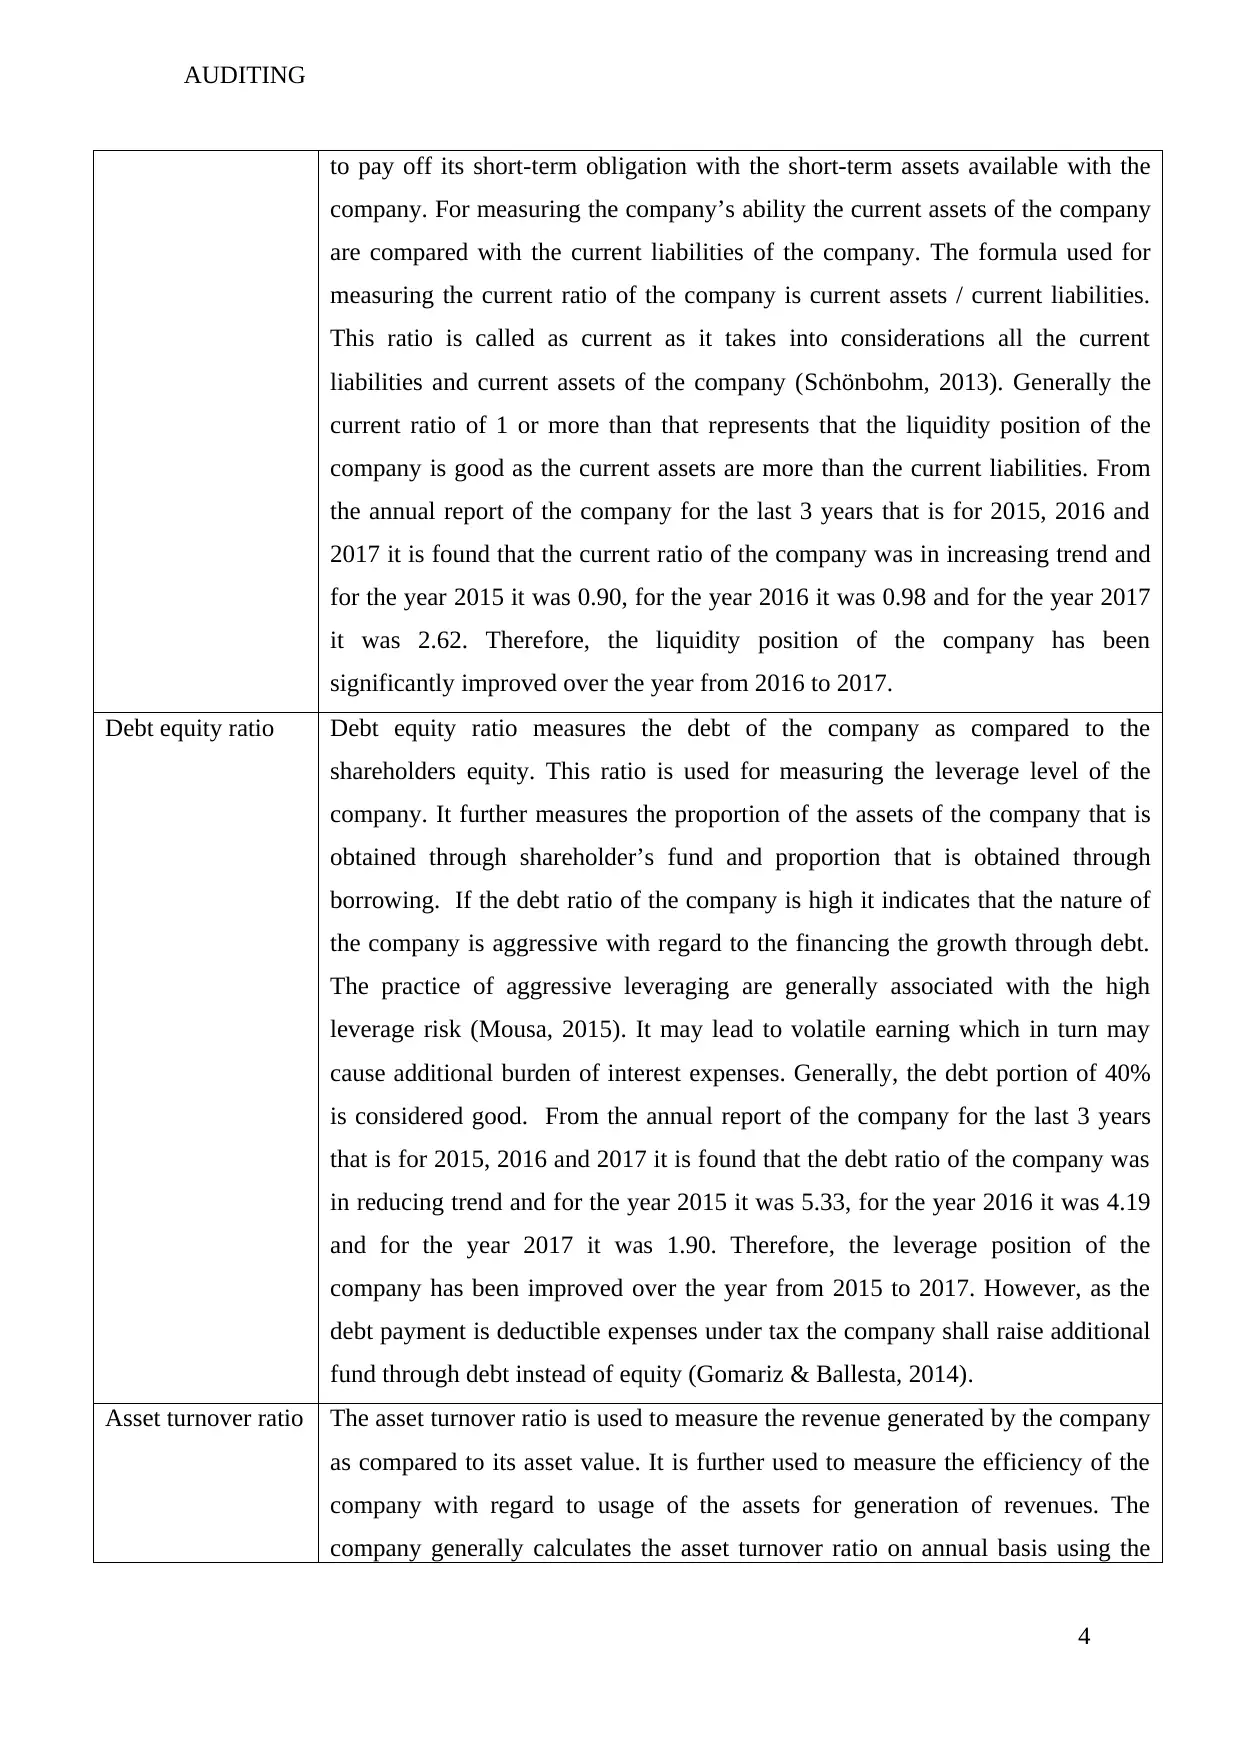
to pay off its short-term obligation with the short-term assets available with the
company. For measuring the company’s ability the current assets of the company
are compared with the current liabilities of the company. The formula used for
measuring the current ratio of the company is current assets / current liabilities.
This ratio is called as current as it takes into considerations all the current
liabilities and current assets of the company (Schönbohm, 2013). Generally the
current ratio of 1 or more than that represents that the liquidity position of the
company is good as the current assets are more than the current liabilities. From
the annual report of the company for the last 3 years that is for 2015, 2016 and
2017 it is found that the current ratio of the company was in increasing trend and
for the year 2015 it was 0.90, for the year 2016 it was 0.98 and for the year 2017
it was 2.62. Therefore, the liquidity position of the company has been
significantly improved over the year from 2016 to 2017.
Debt equity ratio Debt equity ratio measures the debt of the company as compared to the
shareholders equity. This ratio is used for measuring the leverage level of the
company. It further measures the proportion of the assets of the company that is
obtained through shareholder’s fund and proportion that is obtained through
borrowing. If the debt ratio of the company is high it indicates that the nature of
the company is aggressive with regard to the financing the growth through debt.
The practice of aggressive leveraging are generally associated with the high
leverage risk (Mousa, 2015). It may lead to volatile earning which in turn may
cause additional burden of interest expenses. Generally, the debt portion of 40%
is considered good. From the annual report of the company for the last 3 years
that is for 2015, 2016 and 2017 it is found that the debt ratio of the company was
in reducing trend and for the year 2015 it was 5.33, for the year 2016 it was 4.19
and for the year 2017 it was 1.90. Therefore, the leverage position of the
company has been improved over the year from 2015 to 2017. However, as the
debt payment is deductible expenses under tax the company shall raise additional
fund through debt instead of equity (Gomariz & Ballesta, 2014).
Asset turnover ratio The asset turnover ratio is used to measure the revenue generated by the company
as compared to its asset value. It is further used to measure the efficiency of the
company with regard to usage of the assets for generation of revenues. The
company generally calculates the asset turnover ratio on annual basis using the
4
AUDITING
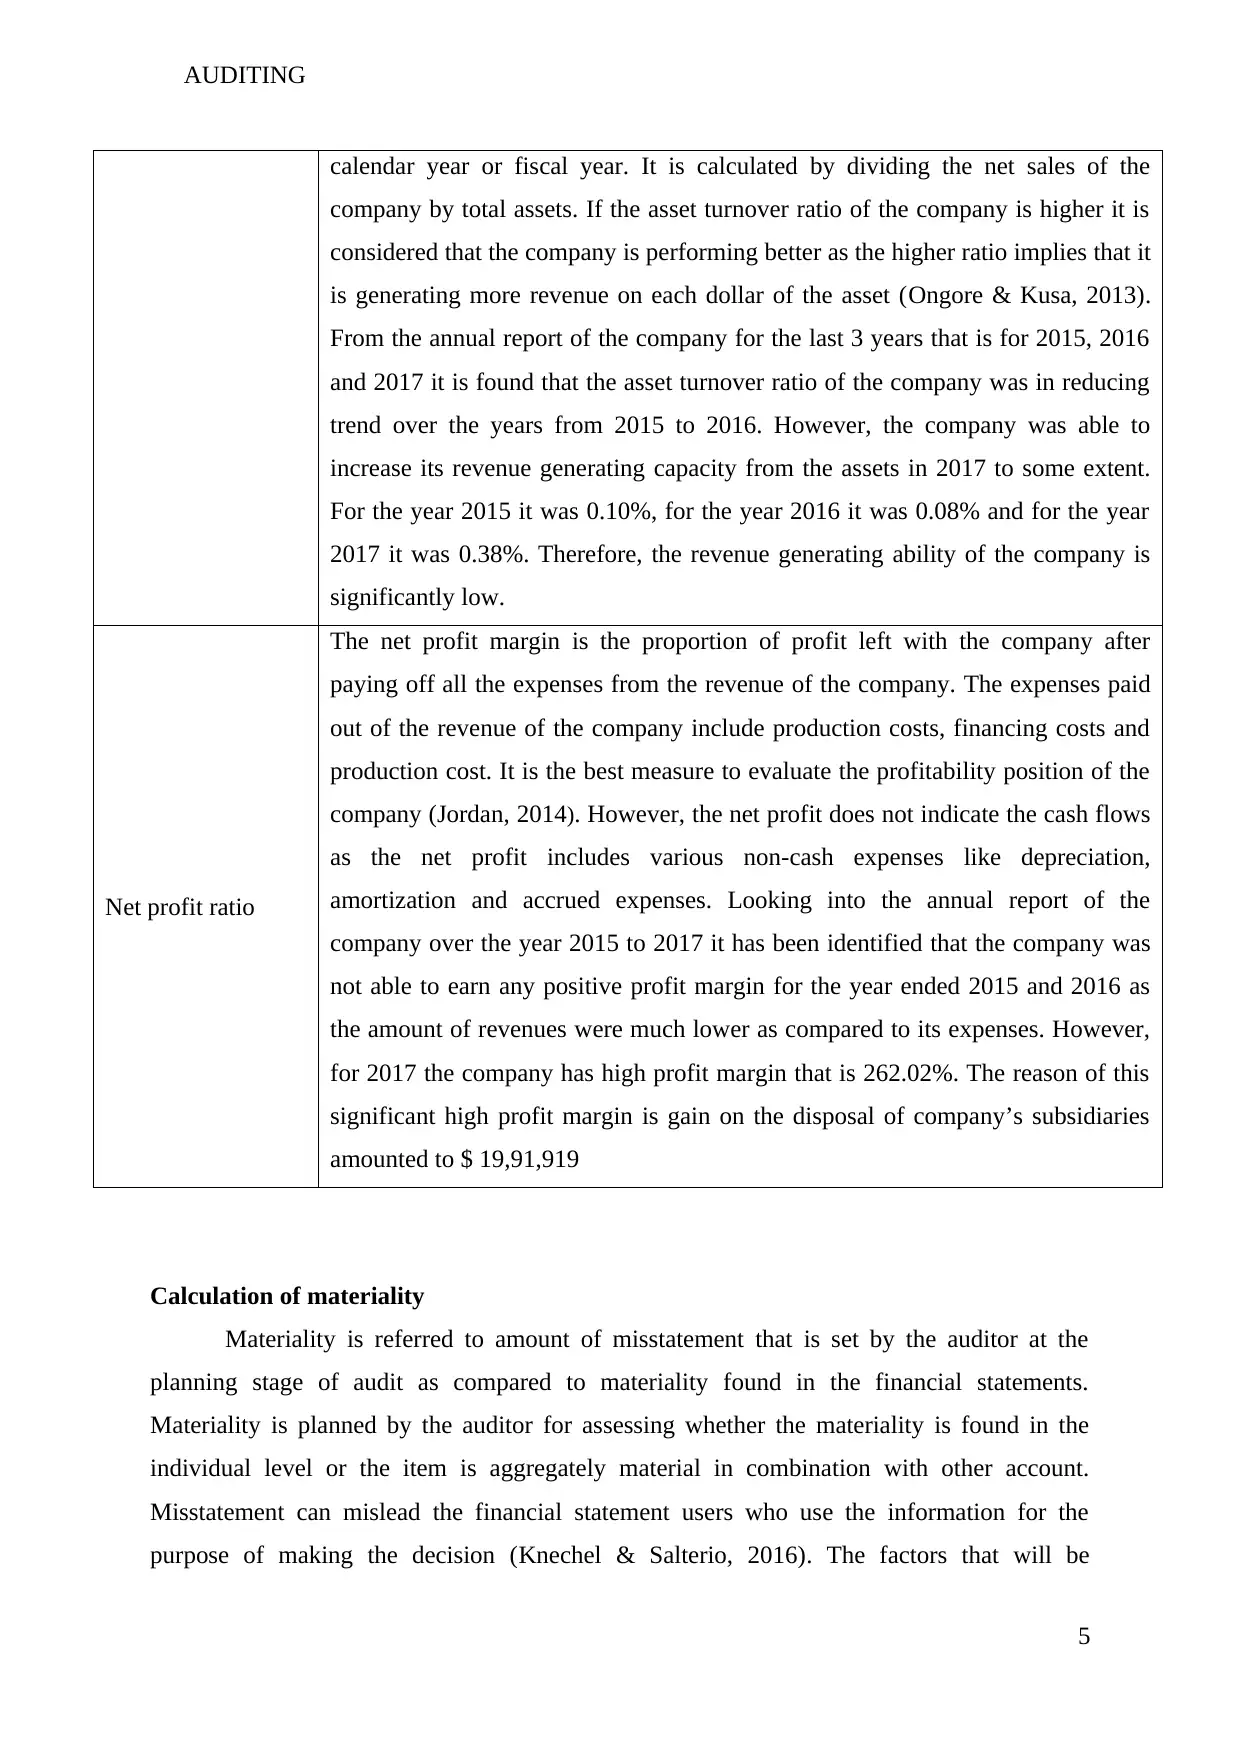
calendar year or fiscal year. It is calculated by dividing the net sales of the
company by total assets. If the asset turnover ratio of the company is higher it is
considered that the company is performing better as the higher ratio implies that it
is generating more revenue on each dollar of the asset (Ongore & Kusa, 2013).
From the annual report of the company for the last 3 years that is for 2015, 2016
and 2017 it is found that the asset turnover ratio of the company was in reducing
trend over the years from 2015 to 2016. However, the company was able to
increase its revenue generating capacity from the assets in 2017 to some extent.
For the year 2015 it was 0.10%, for the year 2016 it was 0.08% and for the year
2017 it was 0.38%. Therefore, the revenue generating ability of the company is
significantly low.
Net profit ratio
The net profit margin is the proportion of profit left with the company after
paying off all the expenses from the revenue of the company. The expenses paid
out of the revenue of the company include production costs, financing costs and
production cost. It is the best measure to evaluate the profitability position of the
company (Jordan, 2014). However, the net profit does not indicate the cash flows
as the net profit includes various non-cash expenses like depreciation,
amortization and accrued expenses. Looking into the annual report of the
company over the year 2015 to 2017 it has been identified that the company was
not able to earn any positive profit margin for the year ended 2015 and 2016 as
the amount of revenues were much lower as compared to its expenses. However,
for 2017 the company has high profit margin that is 262.02%. The reason of this
significant high profit margin is gain on the disposal of company’s subsidiaries
amounted to $ 19,91,919
Calculation of materiality
Materiality is referred to amount of misstatement that is set by the auditor at the
planning stage of audit as compared to materiality found in the financial statements.
Materiality is planned by the auditor for assessing whether the materiality is found in the
individual level or the item is aggregately material in combination with other account.
Misstatement can mislead the financial statement users who use the information for the
purpose of making the decision (Knechel & Salterio, 2016). The factors that will be
5
You're viewing a preview
Unlock full access by subscribing today!
AUDITING
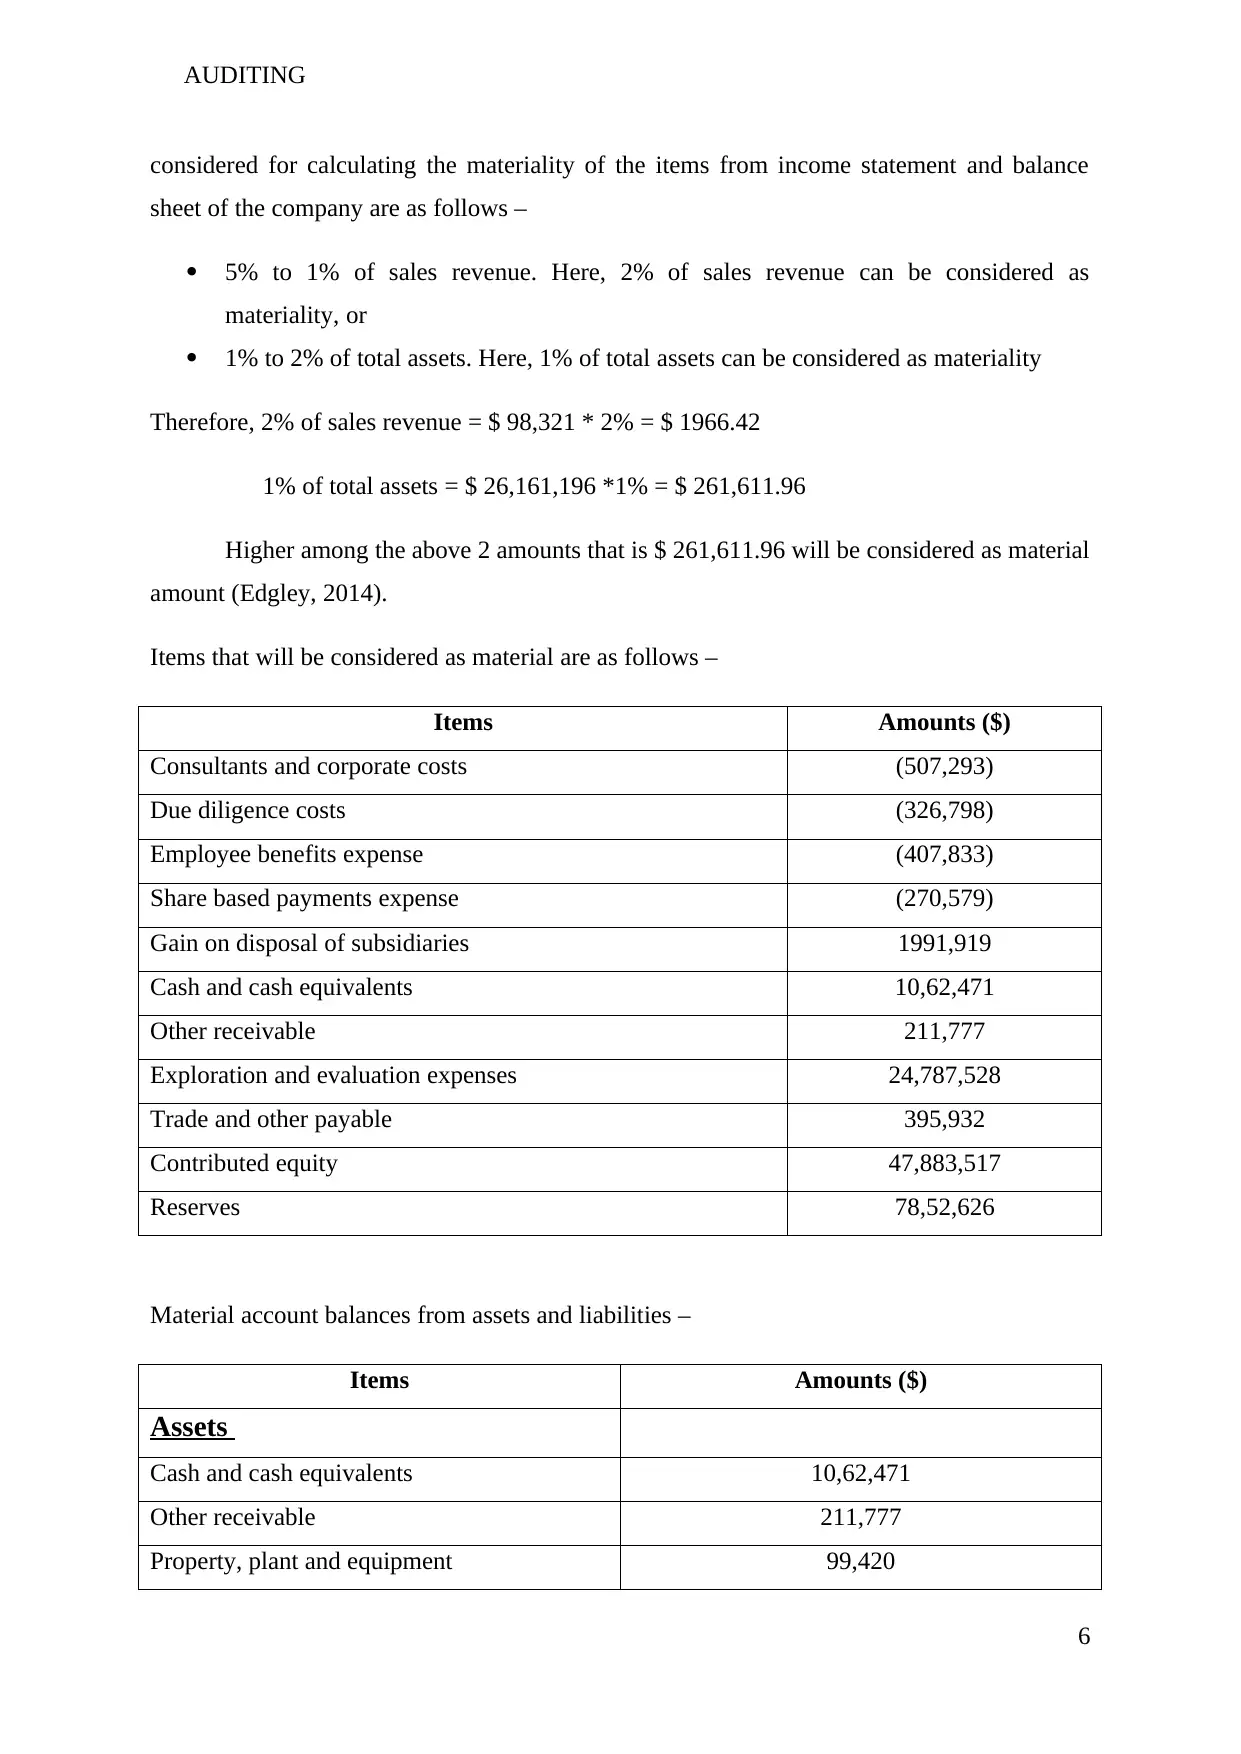
considered for calculating the materiality of the items from income statement and balance
sheet of the company are as follows –
5% to 1% of sales revenue. Here, 2% of sales revenue can be considered as
materiality, or
1% to 2% of total assets. Here, 1% of total assets can be considered as materiality
Therefore, 2% of sales revenue = $ 98,321 * 2% = $ 1966.42
1% of total assets = $ 26,161,196 *1% = $ 261,611.96
Higher among the above 2 amounts that is $ 261,611.96 will be considered as material
amount (Edgley, 2014).
Items that will be considered as material are as follows –
Items Amounts ($)
Consultants and corporate costs (507,293)
Due diligence costs (326,798)
Employee benefits expense (407,833)
Share based payments expense (270,579)
Gain on disposal of subsidiaries 1991,919
Cash and cash equivalents 10,62,471
Other receivable 211,777
Exploration and evaluation expenses 24,787,528
Trade and other payable 395,932
Contributed equity 47,883,517
Reserves 78,52,626
Material account balances from assets and liabilities –
Items Amounts ($)
Assets
Cash and cash equivalents 10,62,471
Other receivable 211,777
Property, plant and equipment 99,420
6
Paraphrase This Document
Need a fresh take? Get an instant paraphrase of this document with our AI Paraphraser
AUDITING
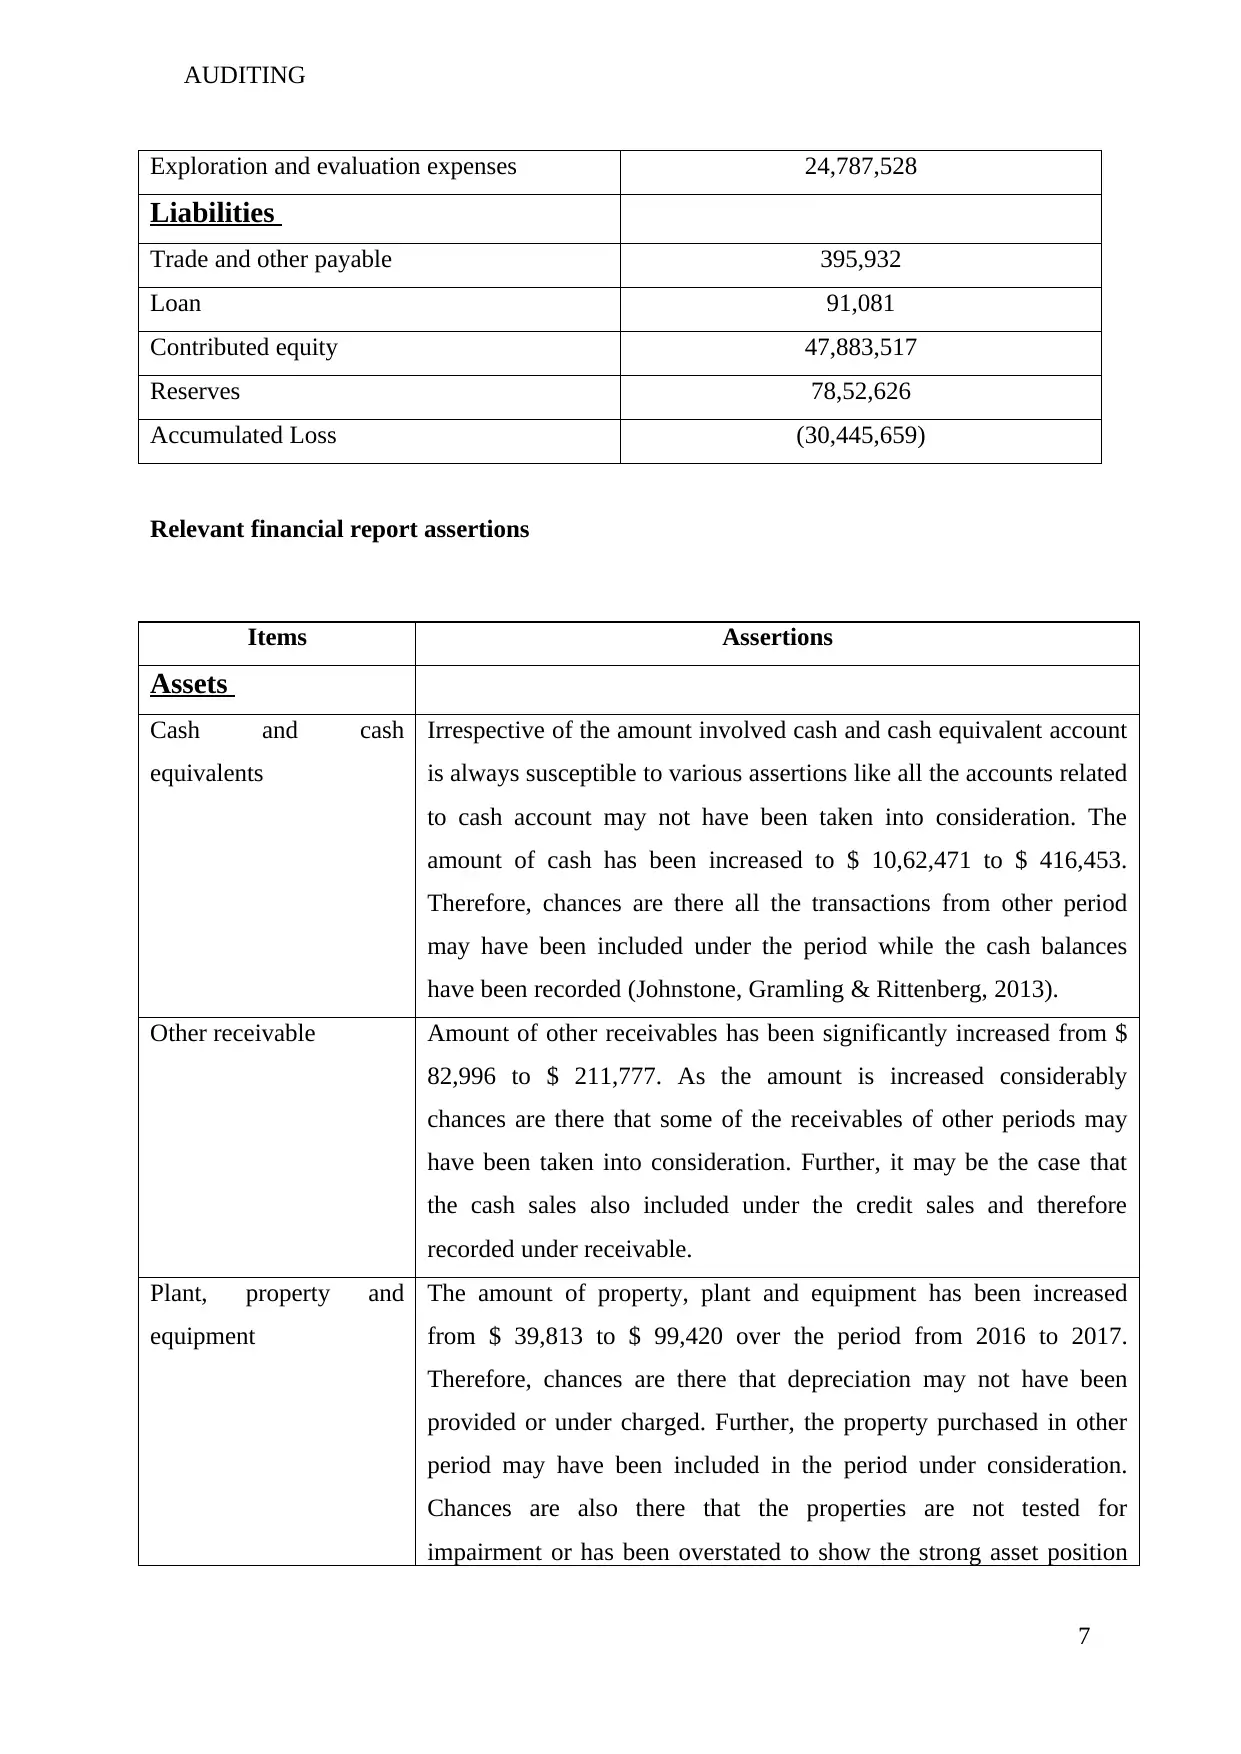
Exploration and evaluation expenses 24,787,528
Liabilities
Trade and other payable 395,932
Loan 91,081
Contributed equity 47,883,517
Reserves 78,52,626
Accumulated Loss (30,445,659)
Relevant financial report assertions
Items Assertions
Assets
Cash and cash
equivalents
Irrespective of the amount involved cash and cash equivalent account
is always susceptible to various assertions like all the accounts related
to cash account may not have been taken into consideration. The
amount of cash has been increased to $ 10,62,471 to $ 416,453.
Therefore, chances are there all the transactions from other period
may have been included under the period while the cash balances
have been recorded (Johnstone, Gramling & Rittenberg, 2013).
Other receivable Amount of other receivables has been significantly increased from $
82,996 to $ 211,777. As the amount is increased considerably
chances are there that some of the receivables of other periods may
have been taken into consideration. Further, it may be the case that
the cash sales also included under the credit sales and therefore
recorded under receivable.
Plant, property and
equipment
The amount of property, plant and equipment has been increased
from $ 39,813 to $ 99,420 over the period from 2016 to 2017.
Therefore, chances are there that depreciation may not have been
provided or under charged. Further, the property purchased in other
period may have been included in the period under consideration.
Chances are also there that the properties are not tested for
impairment or has been overstated to show the strong asset position
7
AUDITING
of the company (Edgley, Jones & Atkins, 2015)
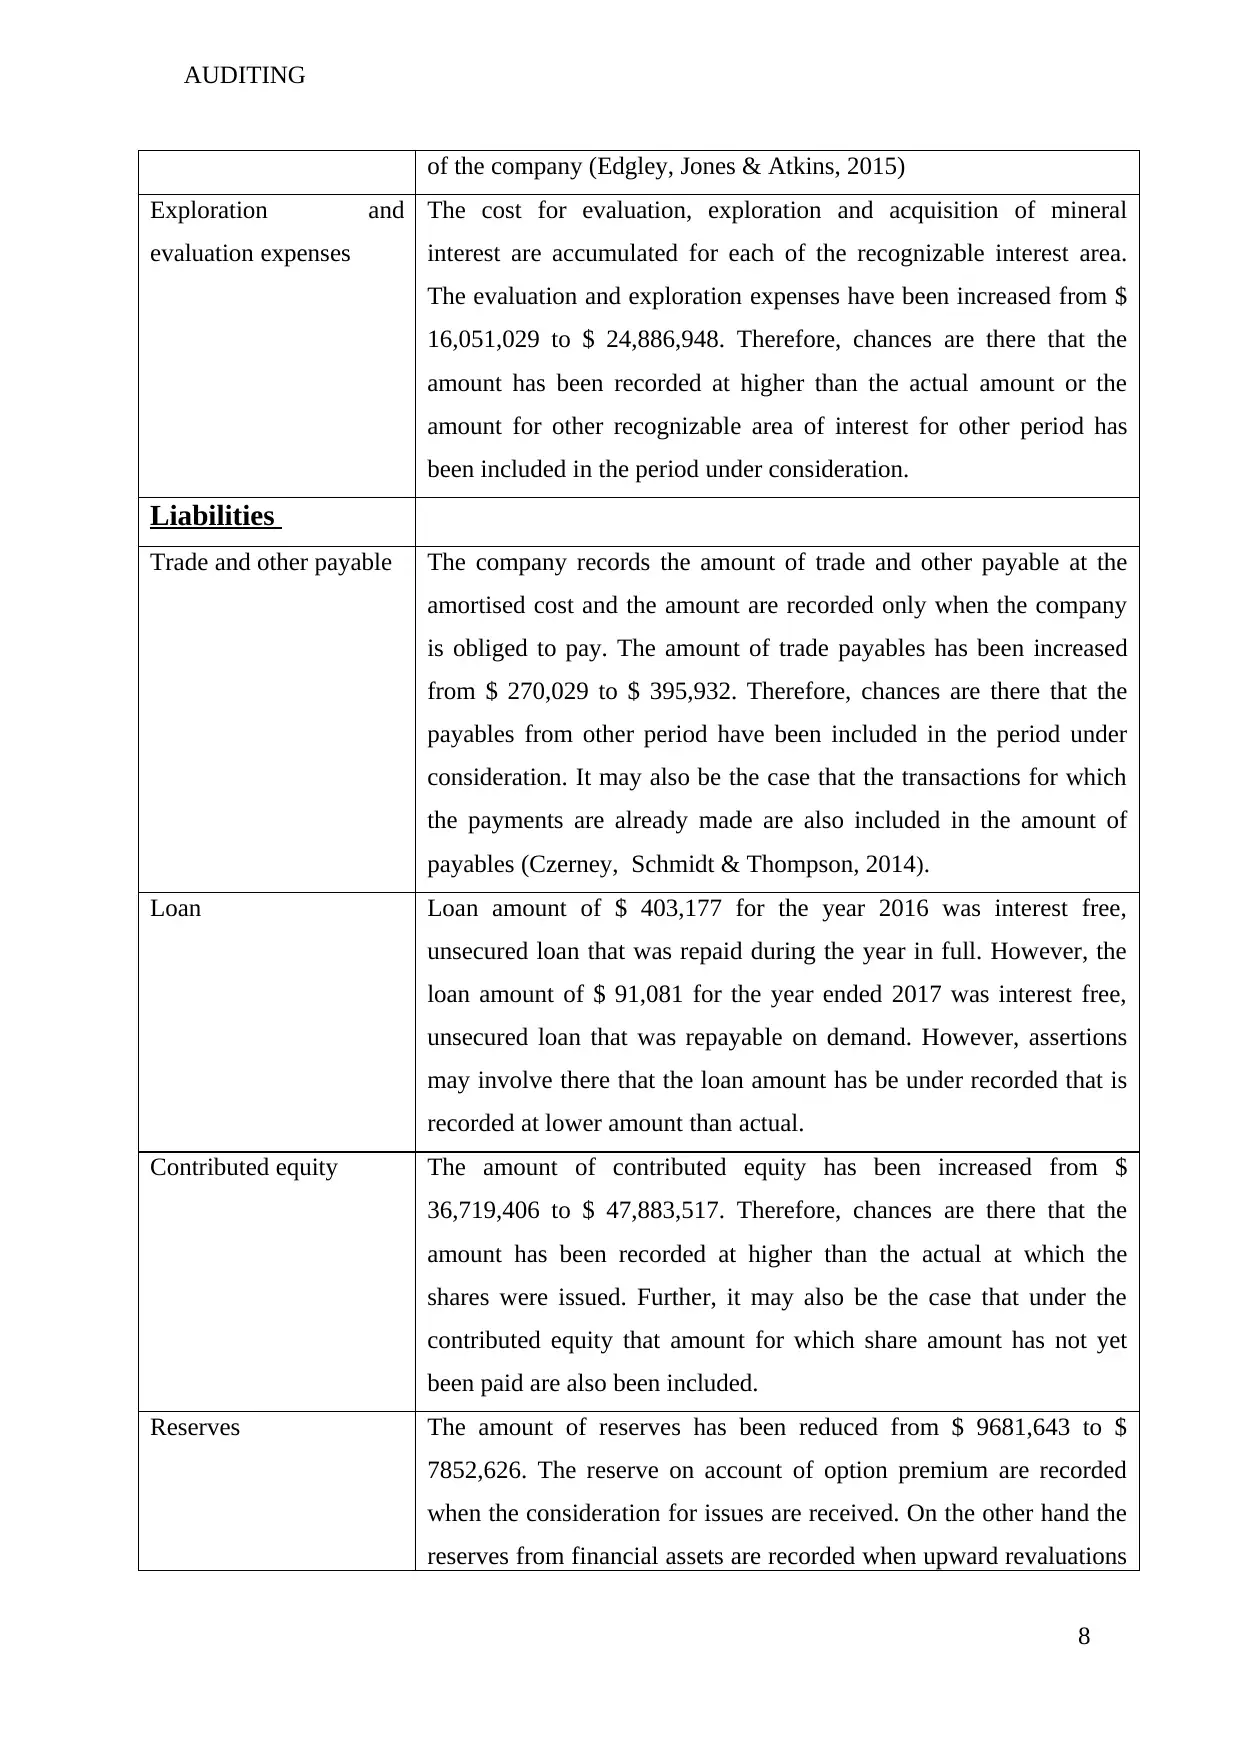
Exploration and
evaluation expenses
The cost for evaluation, exploration and acquisition of mineral
interest are accumulated for each of the recognizable interest area.
The evaluation and exploration expenses have been increased from $
16,051,029 to $ 24,886,948. Therefore, chances are there that the
amount has been recorded at higher than the actual amount or the
amount for other recognizable area of interest for other period has
been included in the period under consideration.
Liabilities
Trade and other payable The company records the amount of trade and other payable at the
amortised cost and the amount are recorded only when the company
is obliged to pay. The amount of trade payables has been increased
from $ 270,029 to $ 395,932. Therefore, chances are there that the
payables from other period have been included in the period under
consideration. It may also be the case that the transactions for which
the payments are already made are also included in the amount of
payables (Czerney, Schmidt & Thompson, 2014).
Loan Loan amount of $ 403,177 for the year 2016 was interest free,
unsecured loan that was repaid during the year in full. However, the
loan amount of $ 91,081 for the year ended 2017 was interest free,
unsecured loan that was repayable on demand. However, assertions
may involve there that the loan amount has be under recorded that is
recorded at lower amount than actual.
Contributed equity The amount of contributed equity has been increased from $
36,719,406 to $ 47,883,517. Therefore, chances are there that the
amount has been recorded at higher than the actual at which the
shares were issued. Further, it may also be the case that under the
contributed equity that amount for which share amount has not yet
been paid are also been included.
Reserves The amount of reserves has been reduced from $ 9681,643 to $
7852,626. The reserve on account of option premium are recorded
when the consideration for issues are received. On the other hand the
reserves from financial assets are recorded when upward revaluations
8
of the company (Edgley, Jones & Atkins, 2015)
Exploration and
evaluation expenses
The cost for evaluation, exploration and acquisition of mineral
interest are accumulated for each of the recognizable interest area.
The evaluation and exploration expenses have been increased from $
16,051,029 to $ 24,886,948. Therefore, chances are there that the
amount has been recorded at higher than the actual amount or the
amount for other recognizable area of interest for other period has
been included in the period under consideration.
Liabilities
Trade and other payable The company records the amount of trade and other payable at the
amortised cost and the amount are recorded only when the company
is obliged to pay. The amount of trade payables has been increased
from $ 270,029 to $ 395,932. Therefore, chances are there that the
payables from other period have been included in the period under
consideration. It may also be the case that the transactions for which
the payments are already made are also included in the amount of
payables (Czerney, Schmidt & Thompson, 2014).
Loan Loan amount of $ 403,177 for the year 2016 was interest free,
unsecured loan that was repaid during the year in full. However, the
loan amount of $ 91,081 for the year ended 2017 was interest free,
unsecured loan that was repayable on demand. However, assertions
may involve there that the loan amount has be under recorded that is
recorded at lower amount than actual.
Contributed equity The amount of contributed equity has been increased from $
36,719,406 to $ 47,883,517. Therefore, chances are there that the
amount has been recorded at higher than the actual at which the
shares were issued. Further, it may also be the case that under the
contributed equity that amount for which share amount has not yet
been paid are also been included.
Reserves The amount of reserves has been reduced from $ 9681,643 to $
7852,626. The reserve on account of option premium are recorded
when the consideration for issues are received. On the other hand the
reserves from financial assets are recorded when upward revaluations
8
You're viewing a preview
Unlock full access by subscribing today!
AUDITING
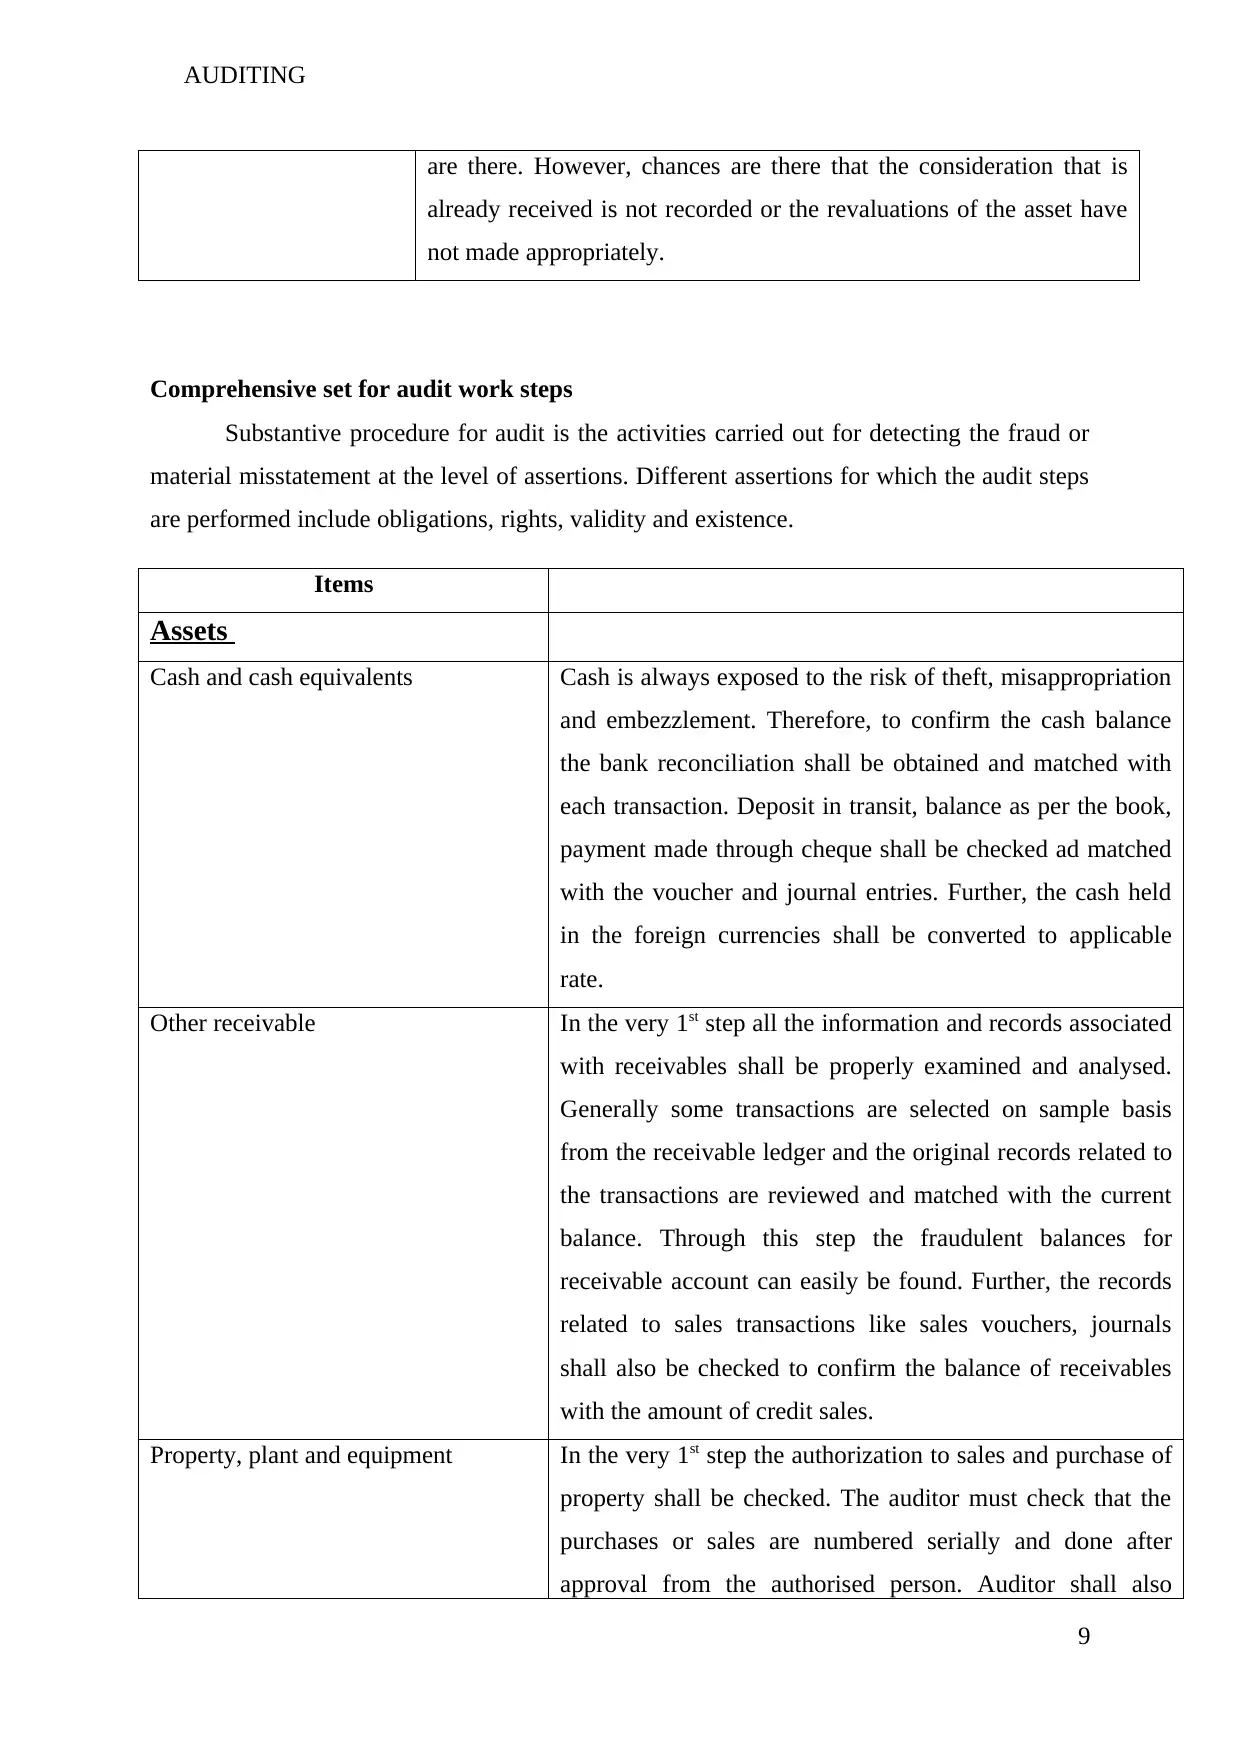
are there. However, chances are there that the consideration that is
already received is not recorded or the revaluations of the asset have
not made appropriately.
Comprehensive set for audit work steps
Substantive procedure for audit is the activities carried out for detecting the fraud or
material misstatement at the level of assertions. Different assertions for which the audit steps
are performed include obligations, rights, validity and existence.
Items
Assets
Cash and cash equivalents Cash is always exposed to the risk of theft, misappropriation
and embezzlement. Therefore, to confirm the cash balance
the bank reconciliation shall be obtained and matched with
each transaction. Deposit in transit, balance as per the book,
payment made through cheque shall be checked ad matched
with the voucher and journal entries. Further, the cash held
in the foreign currencies shall be converted to applicable
rate.
Other receivable In the very 1st step all the information and records associated
with receivables shall be properly examined and analysed.
Generally some transactions are selected on sample basis
from the receivable ledger and the original records related to
the transactions are reviewed and matched with the current
balance. Through this step the fraudulent balances for
receivable account can easily be found. Further, the records
related to sales transactions like sales vouchers, journals
shall also be checked to confirm the balance of receivables
with the amount of credit sales.
Property, plant and equipment In the very 1st step the authorization to sales and purchase of
property shall be checked. The auditor must check that the
purchases or sales are numbered serially and done after
approval from the authorised person. Auditor shall also
9
Paraphrase This Document
Need a fresh take? Get an instant paraphrase of this document with our AI Paraphraser
AUDITING
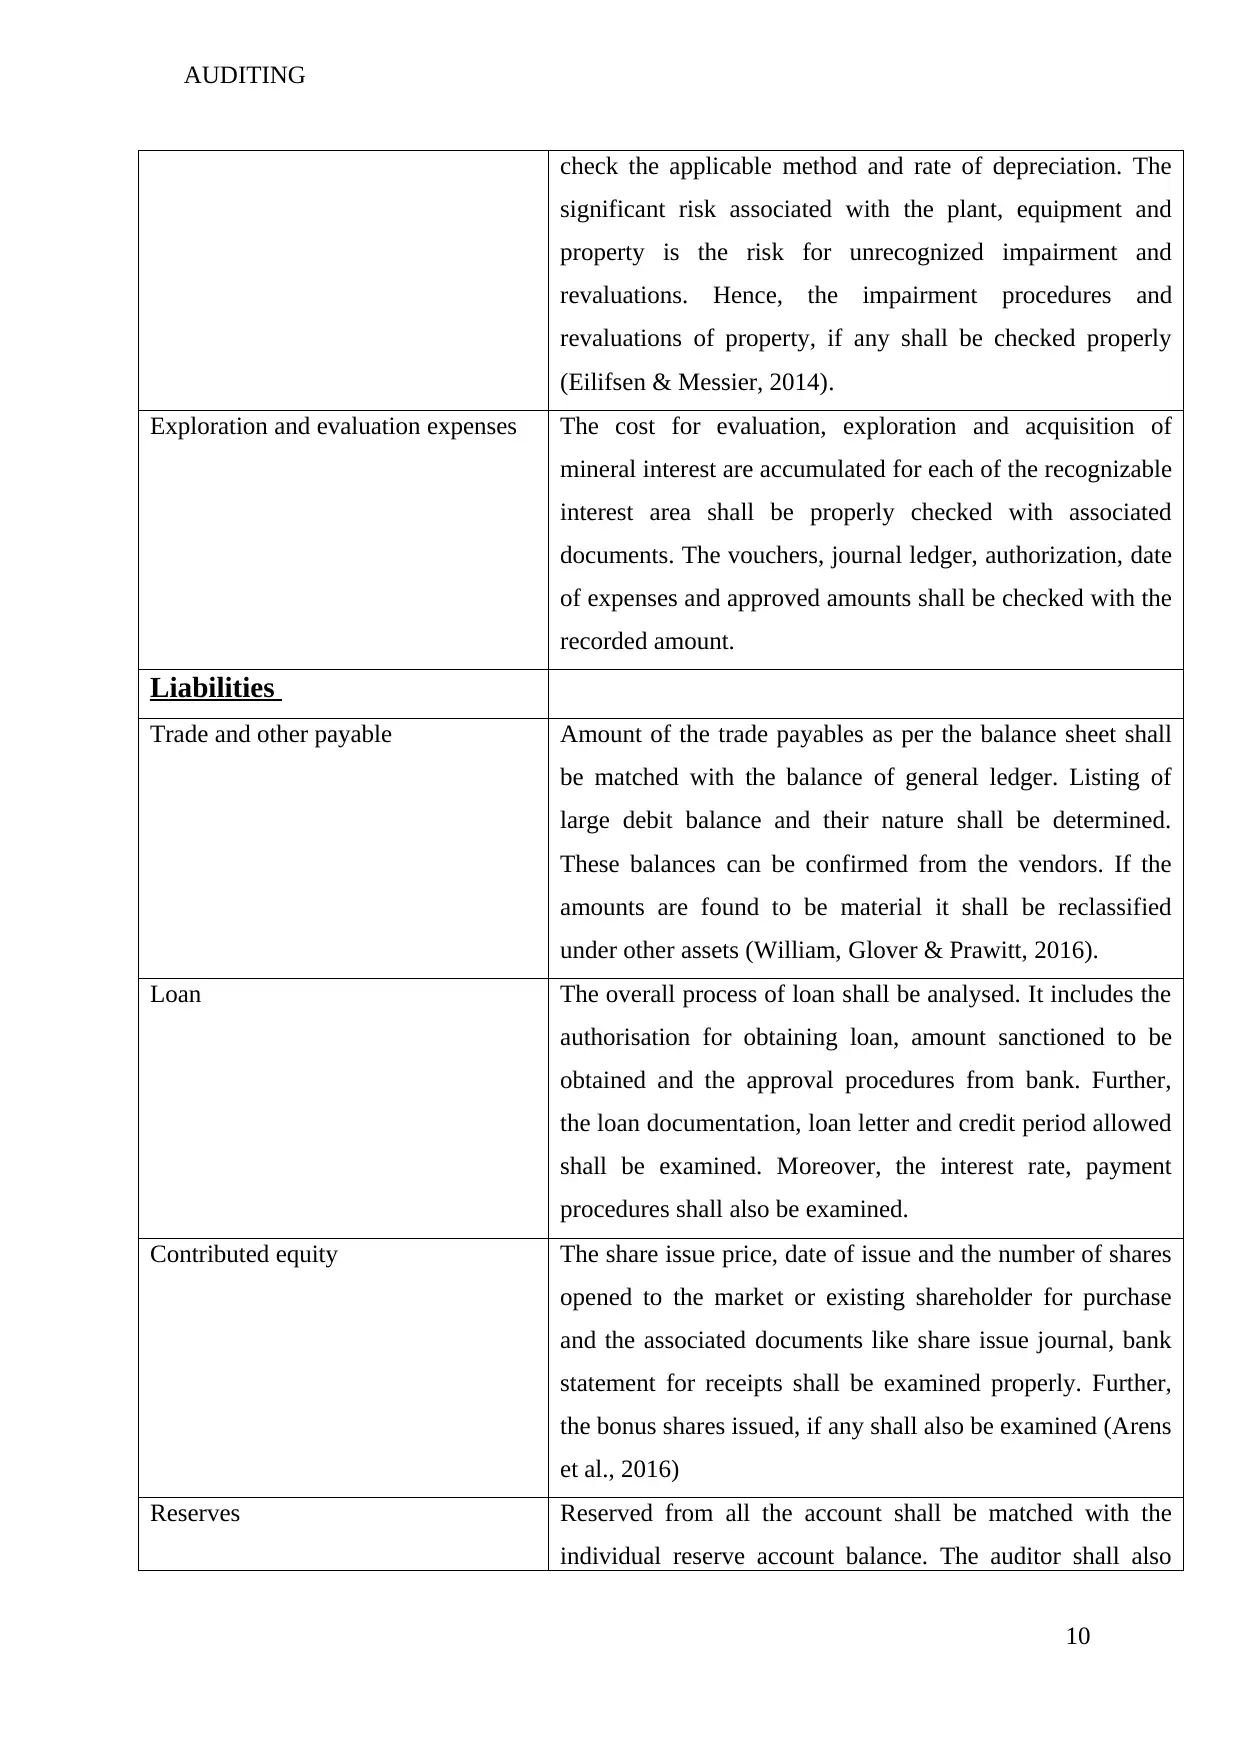
check the applicable method and rate of depreciation. The
significant risk associated with the plant, equipment and
property is the risk for unrecognized impairment and
revaluations. Hence, the impairment procedures and
revaluations of property, if any shall be checked properly
(Eilifsen & Messier, 2014).
Exploration and evaluation expenses The cost for evaluation, exploration and acquisition of
mineral interest are accumulated for each of the recognizable
interest area shall be properly checked with associated
documents. The vouchers, journal ledger, authorization, date
of expenses and approved amounts shall be checked with the
recorded amount.
Liabilities
Trade and other payable Amount of the trade payables as per the balance sheet shall
be matched with the balance of general ledger. Listing of
large debit balance and their nature shall be determined.
These balances can be confirmed from the vendors. If the
amounts are found to be material it shall be reclassified
under other assets (William, Glover & Prawitt, 2016).
Loan The overall process of loan shall be analysed. It includes the
authorisation for obtaining loan, amount sanctioned to be
obtained and the approval procedures from bank. Further,
the loan documentation, loan letter and credit period allowed
shall be examined. Moreover, the interest rate, payment
procedures shall also be examined.
Contributed equity The share issue price, date of issue and the number of shares
opened to the market or existing shareholder for purchase
and the associated documents like share issue journal, bank
statement for receipts shall be examined properly. Further,
the bonus shares issued, if any shall also be examined (Arens
et al., 2016)
Reserves Reserved from all the account shall be matched with the
individual reserve account balance. The auditor shall also
10
AUDITING
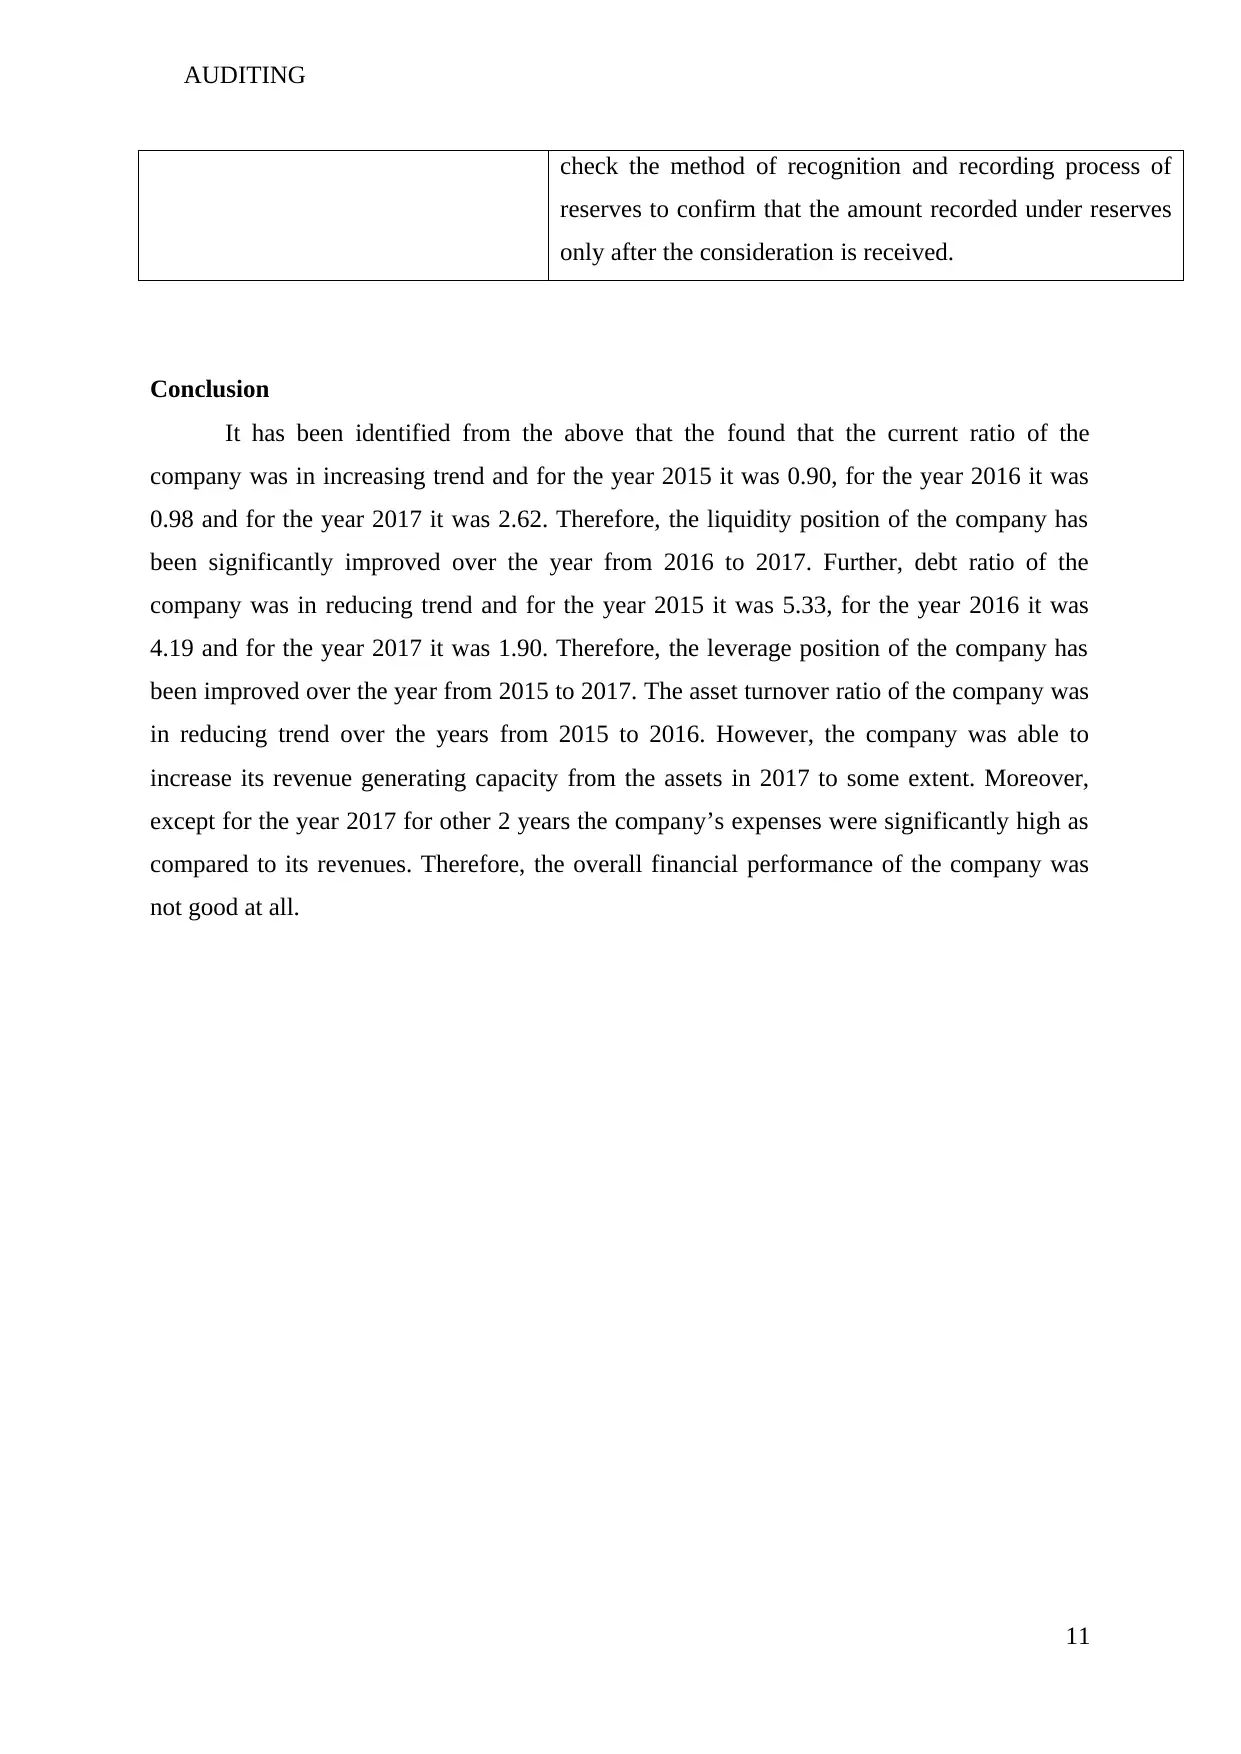
check the method of recognition and recording process of
reserves to confirm that the amount recorded under reserves
only after the consideration is received.
Conclusion
It has been identified from the above that the found that the current ratio of the
company was in increasing trend and for the year 2015 it was 0.90, for the year 2016 it was
0.98 and for the year 2017 it was 2.62. Therefore, the liquidity position of the company has
been significantly improved over the year from 2016 to 2017. Further, debt ratio of the
company was in reducing trend and for the year 2015 it was 5.33, for the year 2016 it was
4.19 and for the year 2017 it was 1.90. Therefore, the leverage position of the company has
been improved over the year from 2015 to 2017. The asset turnover ratio of the company was
in reducing trend over the years from 2015 to 2016. However, the company was able to
increase its revenue generating capacity from the assets in 2017 to some extent. Moreover,
except for the year 2017 for other 2 years the company’s expenses were significantly high as
compared to its revenues. Therefore, the overall financial performance of the company was
not good at all.
11
You're viewing a preview
Unlock full access by subscribing today!
AUDITING
Reference list
Almeida, H., Hsu, P. H., & Li, D. (2013). Less is more: Financial constraints and innovative
efficiency.
Amanigold.com. (2018). Amani Gold | A resources focused ASX-listed company. [online]
Available at: http://amanigold.com/ [Accessed 26 May 2018].
Arens, A. A., Elder, R. J., Beasley, M. S., & Hogan, C. E. (2016). Auditing and assurance
services. Pearson.
Czerney, K., Schmidt, J. J., & Thompson, A. M. (2014). Does auditor explanatory language
in unqualified audit reports indicate increased financial misstatement risk?. The
Accounting Review, 89(6), 2115-2149.
Edgley, C. (2014). A genealogy of accounting materiality. Critical Perspectives on
Accounting, 25(3), 255-271.
Edgley, C., Jones, M. J., & Atkins, J. (2015). The adoption of the materiality concept in
social and environmental reporting assurance: A field study approach. The British
Accounting Review, 47(1), 1-18.
Eilifsen, A., & Messier Jr, W. F. (2014). Materiality guidance of the major public accounting
firms. Auditing: A Journal of Practice & Theory, 34(2), 3-26.
Gomariz, M. F. C., & Ballesta, J. P. S. (2014). Financial reporting quality, debt maturity and
investment efficiency. Journal of Banking & Finance, 40, 494-506.
Hofmann, M. A., & McSwain, D. (2013). Financial disclosure management in the nonprofit
sector: A framework for past and future research. Journal of accounting
literature, 32(1), 61-87.
Johnstone, K., Gramling, A., & Rittenberg, L. E. (2013). Auditing: a risk-based approach to
conducting a quality audit. Cengage learning.
Jordan, B. (2014). Fundamentals of investments. McGraw-Hill Higher Education.
Knechel, W. R., & Salterio, S. E. (2016). Auditing: Assurance and risk. Taylor & Francis.
12
Paraphrase This Document
Need a fresh take? Get an instant paraphrase of this document with our AI Paraphraser
AUDITING
Mousa, G. A. (2015). Financial Ratios versus Data Envelopment Analysis: The Efficiency
Assessment of Banking Sector in Bahrain Bourse. International Journal of Business
and Statistical Analysis, 2(2), 75-84.
Ongore, V. O., & Kusa, G. B. (2013). Determinants of financial performance of commercial
banks in Kenya. International Journal of Economics and Financial Issues, 3(1), 237.
Schönbohm, A. (2013). Performance measurement and management with financial ratios:
the BASF SE case (No. 72). Working Papers of the Institute of Management Berlin at
the Berlin School of Economics and Law (HWR Berlin).
William Jr, M., Glover, S., & Prawitt, D. (2016). Auditing and assurance services: A
systematic approach. McGraw-Hill Education.
13
1 out of 14
Your All-in-One AI-Powered Toolkit for Academic Success.
+13062052269
info@desklib.com
Available 24*7 on WhatsApp / Email
![[object Object]](/_next/static/media/star-bottom.7253800d.svg)
Unlock your academic potential
© 2024 | Zucol Services PVT LTD | All rights reserved.