COMP640 Forecasting: Student Outcomes and Technology's Impact
VerifiedAdded on 2022/09/09
|38
|23492
|17
Project
AI Summary
This capstone project, submitted to the University of the Potomac for COMP640 – Forecasting and Management Technology, investigates the multifaceted impact of technological changes on students. The project begins by outlining the problem of increased technology dependency, referencing literature that highlights both the benefits, such as enhanced learning through tools like calculators, and potential drawbacks of technology overuse in education. The research includes a literature review, methodology, findings, and conclusions, with the student acknowledging the use of various technologies in the classroom to capture attention and increase achievement levels. The project aims to determine the effects of technology, addressing the research question through a well-defined hypothesis, establishing the purpose and significance of the study, and providing a structured organization. The project also includes a table of contents, acronyms, and a list of references, showcasing a comprehensive approach to the topic of technology and its influence on students in a higher education setting. The project examines the effects of technology on students, and references to previous literature on the topic are made throughout the project.
American Economic Review 2018, 108(7): 1737–1772
https://doi.org/10.1257/aer.20161570
1737
* Hershbein: W.E. Upjohn Institute for Employment Research, 300 S Westnedge Avenue, Kalamazoo
49007, and IZA (email: hershbein@upjohn.org); Kahn: Yale School of Management, 165 Whitney Avenue, PO
Box 208200, New Haven, CT 06511, NBER, and IZA (email: lisa.kahn@yale.edu). This paper was accepted to
the AER under the guidance of Hilary Hoynes, Coeditor. We are grateful to Jason Abaluck, Joe Altonji, Dav
Autor, Tim Bartik, David Berger, Nick Bloom, Jeff Clemens, David Deming, David Green, John Horton, Peter
Kuhn, Fabian Lange, Steve Malliaris, Adrien Matray, Alicia Sasser Modestino, Daniel Shoag, Henry Siu, Basit
Zafar, four anonymous referees, and seminar participants at the 2016 AEAs, the Atlanta Fed, Boston
Boston University, Brookings, Georgetown University, Harvard, the LSE, MIT, NBER Summer Institute (Macro
and Labor), Northwestern, Princeton, Rutgers, SOLE/EALE 2015 meetings, Trans Pacific Labor Seminar 2015,
University of British Columbia, University of Chicago, University of Illinois, University of Kansas, University of
Michigan, University of Notre Dame, University of Pennsylvania, University of Pittsburgh, University of South
Florida, and the WEAI 2016 meetings. We are especially indebted to Dan Restuccia, Jake Sherman, and Bled
for providing the Burning Glass data. Jing Cai provided excellent research assistance with CPS data. A previo
version of this paper was titled “Is College the New High School? Evidence from Vacancy Postings.”
† Go to https://doi.org/10.1257/aer.20161570 to visit the article page for additional materials and
disclosure statement(s).
Do Recessions Accelerate Routine-Biased Technological
Change? Evidence from Vacancy Postings†
By Brad Hershbein and Lisa B. Kahn*
We show that skill requirements in job vacancy postings differentially
increased in MSAs that were hit hard by the Great Recession, relative
to lesshard-hit areas. These increases persist through at least the
end of 2015 and are correlated with increases in capital investments,
both at the MSA andfirm levels. We also find that effects are most
pronounced in routine-cognitive occupations, which exhibit relative
wage growth as well. We argue that this evidence is consistent with
the restructuring of production toward routine-biased technologies
and the more-skilled workers that complement them, and that the
Great Recession accelerated this process. (JEL E24, E32, J24, J31,
J63, L23, O33)
The employment shift from occupations in the middle of the skill distribution
toward those in the tails is one of the most important trends in the US labor ma
ket over the last 30 years. Previous research makes the compelling case that a
mary driver of this job polarization isroutine-biased technological change (RBTC),
whereby new machine technologies and overseas labor substitute for middle-s
jobs in the United States and are in turn complementary to high-skill co
jobs.1 Until recently, RBTC had been thought to be a gradual, secular phenomen
However, a long theoretical literature, beginning with Schumpeter’s (1939) “c
ative destruction,” suggests adjustments to technological change may be more
sodic. In boom times, high opportunity costs, or frictions such as adjustment co
may inhibit resources from being reallocated optimally in the face of technolog
1See, for example, the seminal work of Autor, Levy, and Murnane (2003); Goos and Manning (2007); Auto
Katz, and Kearney (2008); and Autor and Dorn (2013).
Paraphrase This Document
Need a fresh take? Get an instant paraphrase of this document with our AI Paraphraser
1738 THE AMERICAN ECONOMIC REVIEW JULY 2018
change. Recessions lower the opportunity cost and can produce large enough s
to overcome these frictions.2
Whether adjustments to new technology are smooth or lumpy is important fo
policy and for our understanding of recoveries. The recoveries from the last thr
US recessions (1991, 2001, 2007–2009) have been jobless: employment was s
to rebound despite recovery in aggregate output. The reasons for jobless recov
are not well understood, but a small theoretical literature points to adjustment
as a potential mechanism, since they can generate reallocation that is concent
downturns (Koenders and Rogerson 2005; Berger 2012; Jaimovich and Siu 2012
Such lumpy adjustment may leave a mass of displaced workers with the
skills for new production. Jaimovich and Siu (2015) provide suggestive evidenc
that countercyclical reallocation, in the form of RBTC, and jobless recove
linked. They show that the vast majority of the declines inmiddle-skill employment
have occurred during recessions and that, over the same time period, recovery
jobless only in these occupations. However, there is still relatively little direct e
dence on how firms restructure employment in the face of technological chang
and, in particular, whether this restructuring is gradual or episodic.3
In this paper we investigate how the demand for skills changed over the Grea
Recession. We use a new dataset collected by Burning Glass Technologie
contains thenear-universe of electronically posted job vacancies in 2007 an
2010–2015. Exploiting spatial variation in economic conditions, we establi
new fact: the skill requirements of job ads increase in metropolitan statistical a
(MSAs) that suffered larger employment shocks in the Great Recession, relative
the same areas before the shock and other areas that experienced smaller sho
Our estimates imply that ads posted in a hard-hit metro area are about 5 perc
points (16 percent) more likely to contain education and experience requireme
and about 2–3 percentage points ( 8–12 percent) more likely to state requirem
for cognitive and computer skills. Moreover, the vast majority of this “upskilling
persists through the end of our sample in 2015. That is, even while most meas
local labor-market strength had converged back to pre-recession levels, differ
in advertised skill demands remain. This is true holding constant a rich set of c
trols for the availability of skilled labor and the composition of ads across firms
occupations. In fact, we find that the very firms that upskilled early in the recov
drive the persistence later in our sample period.
These patterns collectively raise the possibility that a structural shift in
demand for skill occurred disproportionately in harder-hit MSAs. In particular, t
skill requirements we explore (education, experience, cognitive, and computer
known to complement routine-biased technologies (Autor, Levy, and Murnane
Brynjolfsson and McAfee 2011). If a structural shift in line with RBTC is occur-
ring, we would expect changes in these skill requirements to be accompanied b
2Many theoretical papers predict this phenomenon. See, for example, Hall (1991, 2005); Caballer
Hammour (1994, 1996); Mortensen and Pissarides (1994); Gomes, Greenwood, and Rebelo (2001); and Koen
and Rogerson (2005).
3For example, Acemoglu and Restrepo (2017) find that the diffusion of industrial robots across US commu
zones reduced aggregate employment and wages; Harrigan, Reshef, and Toubal (2016) show that job polari
tion was more pronounced in French firms with greater shares oftechnology-related occupations; and Hawkins,
Michaels, and Oh (2015) show that capital investments and employment reductions frequently occur togethe
Korean manufacturing plants, but these papers focus on long-run changes.
1739HERSHBEIN AND KAHN: ROUTINE-BIASED TECHNOLOGICAL CHANGEVOL. 108 NO. 7
accelerated adoption of such technologies, as well. Indeed, we find that increas
in skill requirements are correlated with capital investments at both the MSA a
firm levels. First, using the Ci Technology Database from Harte-Hanks, a marke
intelligence firm, we show that harder-hit MSAs exhibited a relative increase in
investments, as measured by the adoption of personal computers, at the same
as they upskilled in job postings. These differences across MSAs emerge only a
the Great Recession and, once again, persist through our sample period. Secon
link firms in our job postings database to those in the Harte-Hanks database, a
as to publicly traded firms in Compustat. We show that the firms increasing the
capital investments, based on PC adoption and physical capital holdings, are al
more likely to upskill. Thus, increased demand for labor skill appears closely lin
to both general and IT capital investment.
If this increased investment is in fact related to routine-biased techno
we would expect to see the strongest changes to labor characteristics for the jo
most susceptible to such technologies, routine ones. We thus additionally
on different types of routine occupations, exploring joint changes in skill requir
ments, employment, and wages. Following Acemoglu and Autor (2011), we dis
guish routine-cognitive occupations (e.g., clerical, administrative, and sales) fr
routine-manual ones (e.g., production and operatives), and we supplement the
ads data with Current Population Survey (CPS) and Occupational Employm
Statistics (OES) data. For routine-manual occupations, we see evidence consis
with firms’ substitution of technology for labor: a sharp increase in layoff risk fo
harder-hit MSAs early on, and persistently depressed employment, with n
ticular impact on skill requirements. This is the traditional view exhibited in the
polarization literature: employment losses concentrated in occupations we exp
to be most readily replaceable by machines. Consistent with Jaimovich a
(2015), we show that these changes also appear to be episodic around the Gre
Recession. However, in contrast to this conventional view of labor substi
routine-cognitive occupations in harder-hit MSAs surprisingly exhibit only mod
est increases in layoff risk and no relative employment losses. Instead, we show
that these occupations experience pronounced upskilling, as well as modest re
wage and employment growth after the recession. That is, rather than disappe
entirely, surviving routine-cognitive occupations appear to have become both
tively higher-skilled and more productive. These occupations thus became epi
cally less routine, and more cognitive, as a result of the Great Recession.
Taken together, our results suggest that firms located in areas more s
affected by the Great Recession were induced to restructure their production to
greater use of technology and higher-skilled workers; that is, the Great Recess
hastened the polarization of the US labor market.
This paper is related to a number of important literatures. First, we pr
evidence that the Great Recession spurred persistent changes in labor in
a manner consistent with technological change. Several classes of model
adjustment costs can rationalize this result. For instance, firms may make prod
tivity-enhancing improvements in a recession because of a decline in the oppo
nity cost of restructuring (Hall 2005), a shift in managerial attention from grow
to efficiency possibly due to an increased risk of closure (Koenders and Rogers
2005; Gibbons and Roberts 2012), or changes in the costs and benefits of mak
⊘ This is a preview!⊘
Do you want full access?
Subscribe today to unlock all pages.
Trusted by 1+ million students worldwide
1740 THE AMERICAN ECONOMIC REVIEW JULY 2018
layoffs (Berger 2012; Jaimovich and Siu 2012). In addition, recessions may driv
Schumpeterian cleansing, whereby older, less-productive firms die, making wa
newer, more-productive firms. Empirical support for adjustment-cost mod
focused on the impacts of competition or trade shocks on productivity. For exa
Bloom, Draca, and Van Reenen (2016) show that increased Chinese import com
tition in Europe led to technological change within firms.4 Our paper adds to this
literature by highlighting recession-induced changes in the firm-level demand
skill. This may have important consequences for labor market recoveries, since
implies potential for a sudden skill mismatch.
Second, the Burning Glass job postings data provide a unique opportunity to
sure changes in skill requirements both across and within occupations. In contr
the extant literature on job polarization has focused on shifts across occupation
and has therefore been unable to ascertain the importance of the intra-occupa
margin. We show that the bulk of upskilling occurs within occupations, suggest
this margin is quite important. Moreover, our finding that upskilling is concentr
within routine-cognitive occupations and is accompanied by relative wage grow
implies that RBTC occurs both within and across occupations. This result helps
clarify work by Beaudry, Green, and Sand (2014, 2016) and others documentin
“great reversal” in demand for cognitive skill. They show that since 2000, cogn
occupations have seen no gains in employment or wages, and that college grad
have become more likely to work in routine occupations than previously. They
that a decrease in demand for cognitive occupations drove college graduates t
jobs lower in the occupational distribution, squeezing out the high school gradu
who formerly held them. This is something of a puzzle, especially given the com
mon belief that technological change continues and the fact that more-skilled
ers still earn a sizable premium in the labor market (Card, Heining, and Kline 2
Card, Cardoso, and Kline 2016). We hypothesize part of the solution to this puz
that cognitive workers are being drawn into (formerly) routine-task occupation
the skill content of these occupations evolves. These changes make the occupa
more skilled and therefore likely more desirable than before, although probabl
not as desirable as traditional high-skilled jobs.5
Third, we contribute to a growing literature exploiting data on vacancy
ings. Although several studies have used aggregate vacancy data, and even va
microdata, from the Bureau of Labor Statistics’ Job Openings and Labor Market
Turnover (JOLTS) survey (Davis, Faberman, and Haltiwanger 2012, 2013), thes
data contain little information on the characteristics of a given vacancy or the fi
that is posting it. Fewer studies have used vacancy data that contain informatio
on the occupation or specific requirements of the job posted, and these have g
ally used narrow slices of the data (Rothwell 2014), or data that are limited to o
vacancy source (Kuhn and Shen 2013; Marinescu 2017). To our knowledg
4Additionally, Nickell (1996) provides evidence that increased competition is associated with faster total
tor productivity growth; Syverson (2004a, b) shows that productivity is higher in industries and geographies
greater substitutability of products across firms; and Bernard, Redding, and Schott (2011) show firms shift t
higher productivity products upon the liberalization of firm trade. Other examples are cited in each of these
5Our analyses, however, do not explain why employment and wages have not grown in high-skill occupa
Deming (2017) proposes a compelling hypothesis that a rising importance of social skills, especially in conju
with cognitive skills, can help account for this fact.
Paraphrase This Document
Need a fresh take? Get an instant paraphrase of this document with our AI Paraphraser
1741HERSHBEIN AND KAHN: ROUTINE-BIASED TECHNOLOGICAL CHANGEVOL. 108 NO. 7
are the first study to use data based on anear-universe of online job postings that
covers every metropolitan area in the United States. Online job vacancies repre
but one slice of the labor market, and, by their nature, will overrepresent grow
firms (Davis, Faberman, and Haltiwanger 2013). Nonetheless, we show that lin
vacancies to data on employment, wages, and capital investments, the last at
firm level, presents consistent evidence on how labor markets changed followin
the Great Recession.
We demonstrate that during the Great Recession firms changed not only who
they would hire in the recovery, but how they would produce. Instead of occurr
gradually, with relatively few workers needing to be reallocated at any given ti
we find support that changes in demand for skill were episodic, resulting in a sw
of displaced workers whose skills were suddenly rendered obsolete as fir
cheted up their requirements. The need to reallocate workers on such a large s
may help drive jobless recoveries. It also has distributional consequences
that low-skill workers are well known to suffer worse employment and wage co
quences in recessions.6 Finally, this type of episodic reallocation likely plays a role
in the well-noted and marked decline in male employment-to-population ratio
the past 25 years, especially since these declines have beenstair-step around reces-
sions (Moffitt 2012).7 The evidence provided in this paper is thus integral for under
standing worker reallocation, and can help inform policymakers about the optim
mix during a downturn of worker retraining and subsidizing job search th
unemployment insurance.
The remainder of this paper proceeds as follows. Section I introduces the dat
while Section II summarizes our methodology. Section III presents new fa
on changes in skill requirements as a function of local labor market con
Section IVinvestigateshow thesechangesare linked to capitalinvestments.
Section V examines cross-occupation heterogeneity in response to local labor
ket shocks on skill requirements, employment, and wages, with a particular foc
routine occupations. Section VI concludes.
I. Data
Our data come from a unique source: microdata from nearly 100 million elec
tronic job postings in the United States that span the Great Recession (
2007 and 2015). These job postings were collected and assembled by Burning
Technologies, an employment analytics and labor market information firm. In t
section, we describe the data and our particular sample construction. We provi
detailed examination of the sample’s characteristics and representativeness in
Appendix A.
6See von Wachter and Handwerker (2008); Hoynes, Miller, and Schaller (2012); and Forsythe (2016).
7Supporting the notion that episodic restructuring drives stair-step declines in male employment, Foote a
Ryan (2014) point out that middle-skill workers, the most vulnerable to RBTC, are most at risk of leaving the
force when unemployed.
1742 THE AMERICAN ECONOMIC REVIEW JULY 2018
A. Burning Glass Overview
Burning Glass Technologies—henceforth, BG or Burning Glass—examines som
40,000 online job boards and company websites to aggregate the job postings,
and deduplicate them into a systematic,machine-readable form, and create labor
market analytic products. Thanks to the breadth of this coverage, BG believes
resulting database captures a near-universe of jobs that were posted online. T
a special agreement, we obtained these posting-level data for the years 2007
from 2010 through 2015, covering every MSA in the United States.8
The two key advantages of our data are its breadth and detail. The broad cov
age of the database presents a substantial strength over datasets based on a s
vacancy source, such as CareerBuilder.com. While the JOLTS asks a nationally
resentative sample of employers about vacancies they wish to fill in the near te
it is typically available only at aggregated levels, and contains relatively little in
mation about the characteristics of vacancies. In contrast, the BG data contain
70 possible standardized fields for each vacancy. We exploit detailed informati
occupation, geography, skill requirements, and firm identifiers. The codified sk
include stated education and experience requirements, as well as thousands of
cific skills standardized from open text in each job posting.9 The data thus allow for
analysis of a key, but largely unexplored, margin of firm demand: skill requirem
within occupation.10 Moreover, they allow for afirm-level analysis, which, as we
show below, is key to disentangling mechanisms for upskilling.
However, the richness of the BG data comes with a few shortcomings. Notab
the database covers only vacancies posted on the internet. First, Davis, Faberm
and Haltiwanger (2013) show that the distribution of vacancies in JOLTS overre
resents growing firms. Although roughly two-thirds of hiring is replacement hir
(Lazear and Spletzer 2012), vacancies in general will be somewhat skewed tow
certain areas of the economy. Second, even though vacancies for availab
have increasingly appeared online instead of in traditional sources, such as new
papers, one may worry that the types of jobs posted online are not representat
of all openings. In online Appendix A, we provide a detailed description o
industry-occupation mix of vacancies in BG relative to other sources (JOLTS, th
Current Population Survey, and Occupational Employment Statistics), an analy
8Our dataset was provided in February 2016. Although BG’s algorithms for removing duplicates and codin
ad characteristics change over time, each iteration is applied to all postings in the data. The database unfort
lacks postings from 2008 and 2009. These years would be useful for completeness and for understanding th
timing over which skill requirements changed; however, since hiring volume fell byone-third in 2008 and did not
begin to recover until 2010 (per JOLTS), and our focus is on longer-term changes in hiring demand, addition
for the recession years are not integral for this paper. We also have data on jobs posted in Micropolitan Stat
Areas, which we do not use for lack of some of the labor market indicators in these areas, and substantial no
the ones that are available. They represent 5.6 percent of all posted ads.
9For example, an ad might ask for a worker who is bilingual or who can organize and manage a team. BG
and codes these and other skills into a taxonomy of thousands of unique, but standardized requirements. Be
with a set of predefined possible skills, BG searches text in an ad for an indication that the skill is required.
example, for team work, they search for the key words “team work” but also look for variations such as “abi
work as a team.”
10Other private-sector firms, such as Wanted Analytics, used by the Conference Board’s Help-Wanted On
Index, also offer disaggregated data, but not skill requirements. State vacancy surveys, conducted by a limit
ber of states, sometimes collect certain skill requirements, but cover only a few geographic areas and are ge
not comparable across states (Carnevale, Jayasundera, and Repnikov 2014; Rothwell 2014).
⊘ This is a preview!⊘
Do you want full access?
Subscribe today to unlock all pages.
Trusted by 1+ million students worldwide
1743HERSHBEIN AND KAHN: ROUTINE-BIASED TECHNOLOGICAL CHANGEVOL. 108 NO. 7
of how it has changed over our sample period, and various validity checks cond
on the data both by us and by other researchers. To briefly summarize, althoug
postings are disproportionately concentrated in occupations and industries tha
ically require greater skill, the distributions are relatively stable across time, an
the aggregate and industry trends in the quantity of vacancies track other sour
reasonably closely.
Another downside of the BG data is that vacancies represent just one
by which a firm may adjust labor inputs: through stated, but not necessarily rea
ized, demand. For a complete picture, one would also like to see hires, separat
wages, and other measures (e.g., incumbent worker training, recruitment inten
(Davis, Faberman, and Haltiwanger 2013)). Thus, we also provide corroborating
evidence on some of these margins using supplemental datasets, as described
We restrict our main BG sample to ads withnon-missing employers that posted
at least 10 ads over the sample period of 2007 and 2010–2015. Employer nam
missing in 40 percent of postings, primarily from those listed on recruiting web
that typically do not reveal the employer.11 Many of our analyses exploitfirm-level
information to distinguish among possible mechanisms for upskilling. We there
choose to focus our entire analysis on the consistent sample of ads with non-m
firms, with a sufficient number of observations per firm to estimate firm-level c
acteristics. However, we have performed analyses not requiring firm-level info
tion on the full dataset and obtain very similar results. Moreover, we have confi
that the probability of satisfying this sample criterion (having a valid firm ident
does not vary over the business cycle (see online Appendix A.8). Thus, our sam
restriction should not confound the estimated relationship between local labor
ket conditions and the skill requirements of postings.
B. Skill Requirements in Burning Glass
In our analyses, we exploit four categories of skill requirements: stated educ
and experience requirements, stated demand for skills that we classify as “cog
tive,” and stated demand for computer skills. We choose these skill requiremen
for two reasons. First, they represent a broad swath of human capital measures
which both employers and economists have interest. Second, they reflect what
economics discipline has learned about technological change over the past 20
(Autor, Levy, and Murnane 2003; Brynjolfsson and McAfee 2011). In particular,
the RBTC literature emphasizes that new information technology or cheap over
labor substitute for routine, algorithmic, middle-skill tasks. These new technolo
are in turn complementary with high-skill cognitive, abstract tasks.12 High-skilled
workers favored by RBTC may be required to work with computers and perform
11When name is available, Burning Glass uses a proprietary algorithm to group name variants into a stan
set: for example, “Bausch and Lomb,” “Bausch Lomb,” and “Bausch & Lomb” would be grouped together. W
perform some additional cleaning on firm name, removing any remaining punctuation, spaces, and a few pro
atic words, such as “Incorporated” or “Inc.” The 10-ad restriction drops about 4 percent of job ads that list a
name. However, employer names with very few ads are likely to be miscoded (for example, capturing a frag
of the city name).
12This literature finds also that RBTC may indirectly affect low-skill, manual tasks (Autor and Dorn 2013)
downside of the BG sample is that low-skill jobs are underrepresented. We thus focus our analysis on the de
which employers shift demand from medium- toward high-skill tasks and workers.
Paraphrase This Document
Need a fresh take? Get an instant paraphrase of this document with our AI Paraphraser

1744 THE AMERICAN ECONOMIC REVIEW JULY 2018
more versatile set of functions. Indeed, thenon-algorithmic tasks that complement
routine-task performing machines or overseas labor involve more complexity,
lem solving, and analytical skills, and the ability to determine which tasks need
be performed at a given moment.
In accord with human capital theory, we believe more-educated workers or t
with greater experience on the job will be better able to perform these function13
In online Appendix A.3, to cross-validate the data, we show that education req
ments strongly correlate with average education levels of employed workers at
MSA and occupation levels.
We categorize cognitive and computer skill requirements based on the open
fields for skills. We designate an ad as requiring computer skills if it contains th
key word “computer” or it is categorized as software by BG.14 We define cognitive
skill requirements based on a set of key words chosen deliberately to match
non-routine analytical job tasks used in Autor, Levy, and Murnane (2003) and s
sequently used by the majority of papers studying RBTC and polarization. We a
ensure that the presence of these key words correlates with external measures
cognitive skill at the occupation level.15
This set of skills (education, experience, cognitive, and computer) aligns wel
with our priors on how jobs change with the availability of computers (Brynjolfs
and McAfee 2011). For example, a sales person who previously devoted most o
or her energy to client relations may now be required to use data analytics to b
ter target packages to clients. This salesperson now needs computer and analy
skills, and some experience in the field may help in mapping data recommenda
to practice. Similarly, thanks to machine vision technology, a quality control op
ator no longer need spend his or her time measuring and identifying the shape
produced goods, but instead can be diverted to other tasks such as troubleshoo
and making judgment calls in design optimization. This set of tasks requires hig
cognitive function and intuition that can be gained by experience.16
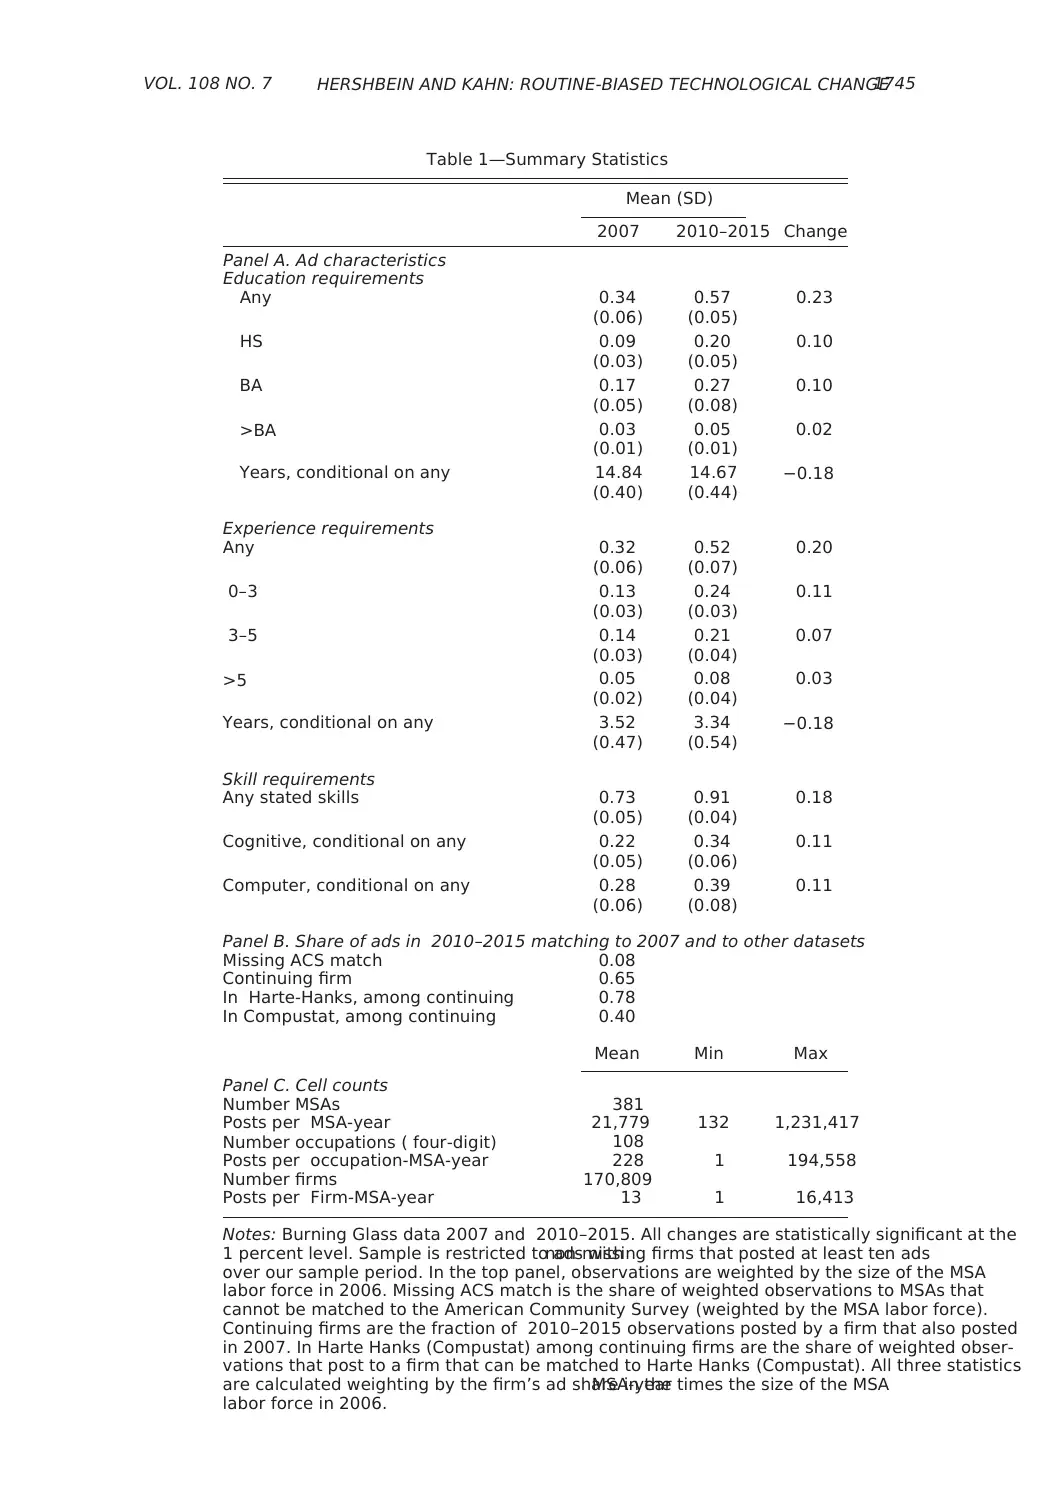
Table 1 summarizes data for the primary regression sample.17 In 2007, 34 percent
of the weighted ads list any education requirement (column 1, row 1). Among a
with an education requirement, one-half (17 percent of all ads) specify minimu
education of a bachelor’s degree, another one-quarter ask for a high school dip
13In the raw data, there are two fields each for education and experience requirements: a minimum level
or years of experience) and a preferred level. Postings that do not list an education or experience requireme
these fields set to missing. We use the fields for the minimum levels to generate variables for the presence o
cation or experience requirement as well as the number of years of education or experience required; the m
is much more commonly specified than the preferred, and it is always available when a preferred level is list
14BG includes common software (e.g., Excel, PowerPoint, AutoCAD), as well as less common software and
languages (e.g., Java, SQL, Python).
15Specifically, an ad is categorized as requesting a cognitive skill if any listed skills include at least one of
the following phrases or fragments: “research,” “analy,” “decision,” “solving,” “math,” “statistic,” or “thinki
The fraction of ads at the occupation level that contain each of these skills is strongly correlated with an O*N
measure developed by Deming (2017) meant to categorize cognitive occupations. We obtain this measure f
Deming and Kahn (2018), who categorize a wide range of key words found in the BG job ads into 10 general
including cognitive.
16It has been suggested by Deming (2017) and others that technology complements workers with interpe
skills, since machines are still poor at reading and inferring human emotion. We have also analyzed changes
demand for a composite “social” skill requirement and obtained results very similar to those presented here
cognitive and computer skills.
17In the top two panels, observations are weighted as they are in our regression analyses: we give equal
to ads within an MSA-year, but upweight larger MSAs, based on the size of the labor force in 2006.
more versatile set of functions. Indeed, thenon-algorithmic tasks that complement
routine-task performing machines or overseas labor involve more complexity,
lem solving, and analytical skills, and the ability to determine which tasks need
be performed at a given moment.
In accord with human capital theory, we believe more-educated workers or t
with greater experience on the job will be better able to perform these function13
In online Appendix A.3, to cross-validate the data, we show that education req
ments strongly correlate with average education levels of employed workers at
MSA and occupation levels.
We categorize cognitive and computer skill requirements based on the open
fields for skills. We designate an ad as requiring computer skills if it contains th
key word “computer” or it is categorized as software by BG.14 We define cognitive
skill requirements based on a set of key words chosen deliberately to match
non-routine analytical job tasks used in Autor, Levy, and Murnane (2003) and s
sequently used by the majority of papers studying RBTC and polarization. We a
ensure that the presence of these key words correlates with external measures
cognitive skill at the occupation level.15
This set of skills (education, experience, cognitive, and computer) aligns wel
with our priors on how jobs change with the availability of computers (Brynjolfs
and McAfee 2011). For example, a sales person who previously devoted most o
or her energy to client relations may now be required to use data analytics to b
ter target packages to clients. This salesperson now needs computer and analy
skills, and some experience in the field may help in mapping data recommenda
to practice. Similarly, thanks to machine vision technology, a quality control op
ator no longer need spend his or her time measuring and identifying the shape
produced goods, but instead can be diverted to other tasks such as troubleshoo
and making judgment calls in design optimization. This set of tasks requires hig
cognitive function and intuition that can be gained by experience.16
Table 1 summarizes data for the primary regression sample.17 In 2007, 34 percent
of the weighted ads list any education requirement (column 1, row 1). Among a
with an education requirement, one-half (17 percent of all ads) specify minimu
education of a bachelor’s degree, another one-quarter ask for a high school dip
13In the raw data, there are two fields each for education and experience requirements: a minimum level
or years of experience) and a preferred level. Postings that do not list an education or experience requireme
these fields set to missing. We use the fields for the minimum levels to generate variables for the presence o
cation or experience requirement as well as the number of years of education or experience required; the m
is much more commonly specified than the preferred, and it is always available when a preferred level is list
14BG includes common software (e.g., Excel, PowerPoint, AutoCAD), as well as less common software and
languages (e.g., Java, SQL, Python).
15Specifically, an ad is categorized as requesting a cognitive skill if any listed skills include at least one of
the following phrases or fragments: “research,” “analy,” “decision,” “solving,” “math,” “statistic,” or “thinki
The fraction of ads at the occupation level that contain each of these skills is strongly correlated with an O*N
measure developed by Deming (2017) meant to categorize cognitive occupations. We obtain this measure f
Deming and Kahn (2018), who categorize a wide range of key words found in the BG job ads into 10 general
including cognitive.
16It has been suggested by Deming (2017) and others that technology complements workers with interpe
skills, since machines are still poor at reading and inferring human emotion. We have also analyzed changes
demand for a composite “social” skill requirement and obtained results very similar to those presented here
cognitive and computer skills.
17In the top two panels, observations are weighted as they are in our regression analyses: we give equal
to ads within an MSA-year, but upweight larger MSAs, based on the size of the labor force in 2006.
1745HERSHBEIN AND KAHN: ROUTINE-BIASED TECHNOLOGICAL CHANGEVOL. 108 NO. 7
Table 1—Summary Statistics
Mean (SD)
2007 2010–2015 Change
Panel A. Ad characteristics
Education requirements
Any 0.34 0.57 0.23
(0.06) (0.05)
HS 0.09 0.20 0.10
(0.03) (0.05)
BA 0.17 0.27 0.10
(0.05) (0.08)
>BA 0.03 0.05 0.02
(0.01) (0.01)
Years, conditional on any 14.84 14.67 −0.18
(0.40) (0.44)
Experience requirements
Any 0.32 0.52 0.20
(0.06) (0.07)
0–3 0.13 0.24 0.11
(0.03) (0.03)
3–5 0.14 0.21 0.07
(0.03) (0.04)
>5 0.05 0.08 0.03
(0.02) (0.04)
Years, conditional on any 3.52 3.34 −0.18
(0.47) (0.54)
Skill requirements
Any stated skills 0.73 0.91 0.18
(0.05) (0.04)
Cognitive, conditional on any 0.22 0.34 0.11
(0.05) (0.06)
Computer, conditional on any 0.28 0.39 0.11
(0.06) (0.08)
Panel B. Share of ads in 2010–2015 matching to 2007 and to other datasets
Missing ACS match 0.08
Continuing firm 0.65
In Harte-Hanks, among continuing 0.78
In Compustat, among continuing 0.40
Mean Min Max
Panel C. Cell counts
Number MSAs 381
Posts per MSA-year 21,779 132 1,231,417
Number occupations ( four-digit) 108
Posts per occupation-MSA-year 228 1 194,558
Number firms 170,809
Posts per Firm-MSA-year 13 1 16,413
Notes: Burning Glass data 2007 and 2010–2015. All changes are statistically significant at the
1 percent level. Sample is restricted to ads withnon-missing firms that posted at least ten ads
over our sample period. In the top panel, observations are weighted by the size of the MSA
labor force in 2006. Missing ACS match is the share of weighted observations to MSAs that
cannot be matched to the American Community Survey (weighted by the MSA labor force).
Continuing firms are the fraction of 2010–2015 observations posted by a firm that also posted
in 2007. In Harte Hanks (Compustat) among continuing firms are the share of weighted obser-
vations that post to a firm that can be matched to Harte Hanks (Compustat). All three statistics
are calculated weighting by the firm’s ad share in theMSA-year times the size of the MSA
labor force in 2006.
⊘ This is a preview!⊘
Do you want full access?
Subscribe today to unlock all pages.
Trusted by 1+ million students worldwide
1746 THE AMERICAN ECONOMIC REVIEW JULY 2018
and the remainder are roughly evenly split between associate degrees (not sho
master’s degrees, and professional degrees or PhDs. Converting the degrees to
modal equivalent years of schooling, the average education requirement, cond
on one being specified, is nearly 15 years.
The second column shows skill requirements averaged over the period 2010
The third column shows the within-MSA change in skill requirements across th
two sample periods. The share of ads specifying an education requirement incr
by 23 percentage points (ppts), on average. This is roughly evenly split across
requiring high school and ads requiring college; because the proportional incre
is slightly larger for high school, the overall (conditional) years of schooling fall
slightly. All differences in means are statistically significant at the 1 percent lev
Experience requirements follow a very similar pattern to education requirem
In 2007, almost one-third of ads specify some amount of experience in the fiel
Among ads with a requirement, the vast majority ask for less than five years, w
much of the remainder asking for between 5 and 10 years. Conditional on post
experience requirement, the average ad asks for 3.5 years. In the later time pe
the propensity to specify an experience requirement increases by 20 ppts. The
increases are again concentrated in the lower categories, so that the average,
tional on specifying any requirement, falls by about one-fifth of a year.
Finally, in 2007, 73 percent of weighted ads specify at least one specific, tex
skill requirement. Among these, 22 percent specify a cognitive skill requiremen
and 28 percent have a computer requirement. In 2010–2015, 91 percent
have at least one text-based skill requirement, and the shares specifying cogn
skills or computer skills increase to roughly one-third and two-fifths, respectiv
In regression analyses, we use the probability of posting a cognitive or comput
skill requirement, conditional on posting a specifictext-based skill, as dependent
variables, rather than the unconditional probabilities, which might instead pick
tendency for ads to become more verbose as posting costs decline.
These increases in stated skill demand could be driven by the nationa
sion that took place between 2007 and the 2010–2015 period. However, they c
also be driven by a variety of other factors, such as changing composition of fir
posting ads online orpreexisting national trends. Because of these issues and the
relatively short panel we have to work with, our regression analyses always con
for year dummies. We therefore fully absorb the overall change in skill requirem
illustrated in Table 1. Instead, we identify differences in the change in skill requ
ments across metro areas as a function of how they weathered the Great Rece
The bottom panel of Table 1 provides an idea of our sample coverage
have a balanced panel of 381 MSAs, which contain an (unweighted) average of
21,779 posts per MSA-year. When we disaggregate to the four-digit occu
level, we have 108 occupations represented, with an average of 228 posts in e
occupation-MSA-year.18 Finally, our data contain roughly 171,000 unique firms,
which translate into an average of 14 posts in each firm-MSA-year.
18Though occupation is available in the BG data at the six-digit Standard Occupation Classification (SOC)
level, we restrict our attention to comparisons across and within four-digit SOC codes, which provid
ads per occupation-MSA-year cell and ensure a balanced panel of occupation-MSAs across years in nearly a
cases. Virtually all ads posted in the 2010–2015 period are in occupation-MSAs that also posted in
within-occupation analyses, we drop the 0.36 percent of ads that cannot be matched.
Paraphrase This Document
Need a fresh take? Get an instant paraphrase of this document with our AI Paraphraser
1747HERSHBEIN AND KAHN: ROUTINE-BIASED TECHNOLOGICAL CHANGEVOL. 108 NO. 7
II. Methodology
Our goal is to understand how the Great Recession affected the demand for s
Because we have only a short panel and need to worry about concurren
that may have affected online job ads (e.g., utilization, prices, preexisting nati
trends in upskilling), we exploit cross-sectional geographic variation in the sev
of the Great Recession. Our general approach is to examine temporal changes
skill requirements as a function of an MSA-level employment shock generated
the Great Recession.
Our initial regression specification is shown in equation (1). The term outcomgmt
is any of several different measures associated with changes in labor skill dem
(and eventually changes in other production inputs, as discussed later) in MSAm ,
year t , and sometimes in subgroupg (for example, occupation or firm). The left-hand
side is the difference in the outcome variable between 2007 and year t . The r
sion sample thus includes each post-recession year t ∈ [2010, 2015] . Finally,m
is a measure of the local employment shock generated by the Great Recessiont
are year dummies, controls are additional control variables described in more
below, and εgmt is an error term:
(1) outcom egmt − outcom egm2007 = α0 + [shockm × It ] α1 + It + controls + εgmt .
The variable shoc km is fixed at theMSA-level for our entire sample period; we
describe its construction in detail below. Through an exhaustive set ofshoc km -year
interactions, the regression estimates the impact of the local employment shoc
the change in skill requirements (or other outcomes) for a given MSA (and grou
between 2007 and a subsequent year. The difference specification implicitly co
trols for time-invariant factors at the MSA (or group-MSA) level. We use 2007
the base year in most analyses since this is the only pre-recession year availab
BG. Such a specification allows us to empirically investigate the timing and per
sistence of upskilling in relation to local labor market shocks through the vecto
coefficients, α1 . The inclusion of year fixed effects ( It ) means we identify the key
coefficients purely off of differences across metro areas in the employment sho
rather than relying on the national shock itself.
We cluster standard errors by MSA to address possible serial correlation with
an area. For regressions at the MSA-year level, we weight observations by the
the MSA’s labor force in 2006. This weighting scheme allows us to upweight are
with larger populations, helping with precision, while fixing the weight applied t
each MSA-year. The latter ensures that we identify off of the same MSA weight
mix in each year, regardless of any (endogenous) changes in ads posted. When
further disaggregate to the MSA-year-group level, we weight cells by the produ
the 2006 MSA labor force and the group’s observation share withinMSA-year (the
observation shares sum to unity), so that more aggregate regressions produce
identical to those using more disaggregated data when the underlying specifica
is the same.
The key explanatory variable,shoc km , is theMSA-specific change in projected
annual employment growth between 2006 and 2009, the national peak and tro
years surrounding the Great Recession. We project employment growth in an M
1748 THE AMERICAN ECONOMIC REVIEW JULY 2018
based on its employment shares inthree-digit North American Industry Classification
System (NAICS) industry codes averaged over 2004 and 2005 and national em
ment changes at the three-digit industry level. This type ofshift-share method is
sometimes referred to as a Bartik shock, following the strategy of Bartik (199119
Specifically, we define projected employment growth, Δ Eˆmt in equation (2),
where for K three-digit industries, ϕ is the employment share of industry k
at time τ (in practice, τ is the average of 2004 and 2005), ln Ekt is the log of national
employment in industry k in year t , and ln Ekt−1 is the log of national employment in
the industry one year prior:20
(2) Δ Eˆmt =∑
k=1
K
ϕm, k, τ (ln Ekt − ln Ek, t−1 ), shoc km = Δ Eˆm2009 − Δ Eˆm2006 .
We then define shoc km as the change in projected employment growth from peak
trough (2006 to 2009). The calculated values of shoc km range from about −0.12 to
−0.04 across MSAs, but to make the coefficients easier to interpret, we renorm
this variable so that a one unit change is equal to the difference between the te
and ninetieth percentile MSAs, −0.026 log points; a larger value corresponds to
worse economic shock.
We use this Bartik measure, instead of actual employment growth, for two re
sons. First, actual employment growth at the MSA level is measured with subst
error, while the Bartik measure allows for more precision. Second, actual emplo
ment growth will reflect shocks to labor demand as well as other city-s
shocks, including those to labor supply, which may be problematic.21 We note that
other direct measures of local labor market tightness, such as the local unemp
ment rate, have similar shortcomings in terms of measurement error or revers
sality; for instance, an unemployment rate may be high precisely because a su
demand shift toward more-skilled labor generates structural mismatch. We ex
the robustness of our results to other ways of defining the Bartik shock.
The top left panel of Figure 1 summarizes the relationship between the Barti
employment shock and actual annual (log) employment growth at the MSA lev
(obtained from the BLS State and Metro Area Employment program). We estim
equation (1), which nets out the actual employment growth rate in 2007 throug
the differences specification, for 2000–2015, controlling only for year fixed effe
The coefficients, α1 , thus represent difference-in-differences estimates: the cha
in actual employment growth between a given year t and 2007, for a hard-hi
(ninetieth percentile employment shock) relative to a less hard-hit MSA (tenth
centile employment shock).
19Some other papers utilizing a form of Bartik shock include Blanchard and Katz (1992), Notowidigdo (20
and Yagan (2016).
20We obtain seasonally adjusted national employment for each three-digitindustry-month from the BLS Current
Employment Statistics program, and take an unweighted average over months to obtain Ekt . We construct ϕ using
County Business Patterns data and the algorithm of Isserman and Westervelt (2006) to overcome data supp
the resulting county-level statistics are mapped to MSAs using the definitions provided by the Census Burea
set by the Office of Management and Budget. See http://www.census.gov/population/metro/data/def.html.
21For example, MSAs with secular increases in population due to migration flows may experience employ
changes that are higher than average but still have a weakening labor market. The Bartik shock addresses t
⊘ This is a preview!⊘
Do you want full access?
Subscribe today to unlock all pages.
Trusted by 1+ million students worldwide
1 out of 38
Your All-in-One AI-Powered Toolkit for Academic Success.
+13062052269
info@desklib.com
Available 24*7 on WhatsApp / Email
![[object Object]](/_next/static/media/star-bottom.7253800d.svg)
Unlock your academic potential
Copyright © 2020–2026 A2Z Services. All Rights Reserved. Developed and managed by ZUCOL.