Financial Performance Evaluation of H&M: Ratio Analysis Report
VerifiedAdded on 2022/08/09
|12
|3175
|28
Report
AI Summary
This report provides a comprehensive analysis of Hennes & Mauritz AB (H&M)'s financial performance, evaluating its stability and sustainability. The analysis focuses on key financial ratios, including Return on Capital Employed (ROCE), Net Profit Margin, Current Ratio, Debtors Collection Period, and Creditors Payment Period, calculated for the years 2017-2019. The report also examines the impact of macro and microeconomic factors, such as GDP, inflation, political factors, and technological advancements, on H&M's business operations. The findings reveal trends in profitability, liquidity, and efficiency, offering insights into the company's financial health and providing recommendations for improvement, such as enhancing asset utilization and managing costs to boost financial performance. The report uses financial statements and economic data to support its conclusions, providing a detailed overview of H&M's financial standing and future prospects.
An analysis and evaluation of financial performance of H & M
1
1
Paraphrase This Document
Need a fresh take? Get an instant paraphrase of this document with our AI Paraphraser
Executive Summary
The module is about providing understanding of the ways to evaluate the financial
performance of a company. The financial analysis aims at examining the financial position of a
company for determining its stability and sustainability aspects. The assignment is about
evaluating the financial performance of a selected company, that is, Hennes & Mauritz AB
(H&M) by the use of ratio analysis. The ratio analysis is highly important to measure the
operational efficiency, liquidity, stability and profitability of a company in order to provide
relevant financial information to the investors and guide them in decision-making.
2
Contents
Executive Summary.........................................................................................................................2
Introduction......................................................................................................................................4
Part A: Analysis of Economic Factors and its impact on the business...........................................4
Macro Economic Factors.............................................................................................................4
Micro Economic Factors..............................................................................................................6
Part B: Calculation of Ratios...........................................................................................................6
C. Accounting Ratios & their Importance in Business....................................................................7
I. Return on Capital Employed (ROCE)......................................................................................8
II. Net Profit Margin....................................................................................................................8
III. Current Ratio..........................................................................................................................8
IV. Average Receivable days/ Debtors collection period............................................................9
V. Average Payable days/ Creditors collection period................................................................9
VI. Efficiency Ratio.....................................................................................................................9
Part D. Recommendation.................................................................................................................9
Part E. Conclusion.........................................................................................................................10
References......................................................................................................................................11
3
⊘ This is a preview!⊘
Do you want full access?
Subscribe today to unlock all pages.
Trusted by 1+ million students worldwide
Introduction
There is large impact of the economic factors on the growth and development of
businesses and gaining an understanding of these factors is essential to promote a company’s
growth. The economic factors mainly refer to the goods, services and money. These variables
has a large impact on the financial condition of an economy and thus impact the operations of a
company by influencing the demand of the consumers, value of assets and taxes. The economic
factors influence the businesses by changing the rate of interest, exchange rate, recession,
inflation, taxes and supply and demand pattern. The movement along the curve occurs when
there is fluctuation in the price of the good which causes a subsequent change in the quantity
supplied. The shift in the curve can be caused by the changes in factors such as average income
and preferences that can cause the demand curve to shift to the right side. The report has
presented a discussion regarding the analysis of macro and micro-economic factors and their
impact on the business. This is followed by calculating the key financial ratios of the selected
company, H&M, and carrying out their interpretations for examining the financial performance
of the company for the past three financial years.
Part A: Analysis of Economic Factors and its impact on the business
Macro Economic Factors and impact of these on chosen company performance over three
years
The two most important macro economic factors that impact the clothing retail sector are
Gross Domestic Product (GDP) and In.
(I) GDP: It refers the money value of the goods and services manufactured in the particular
economy (Here is Sweden Economy) during the given year or quarter. It is one of the important
economic factors that help to measure the economic health of the country. GDP critically
impacts every business sector within the economy (Economics stats, 2019). When GDP is strong,
business hires more workers as they can afford to pay more wages and salaries. These results in
higher spending by the customers on goods and services produced within the country. GDP of
Sweden has expanded by 1.7% YoY basis in year September 2019 as compared to 1.0 % in
previous quarter. Average growth rate in GDP of Sweden was 2.7% during last 10 years
(Trading Economics, 2019).
4
Paraphrase This Document
Need a fresh take? Get an instant paraphrase of this document with our AI Paraphraser
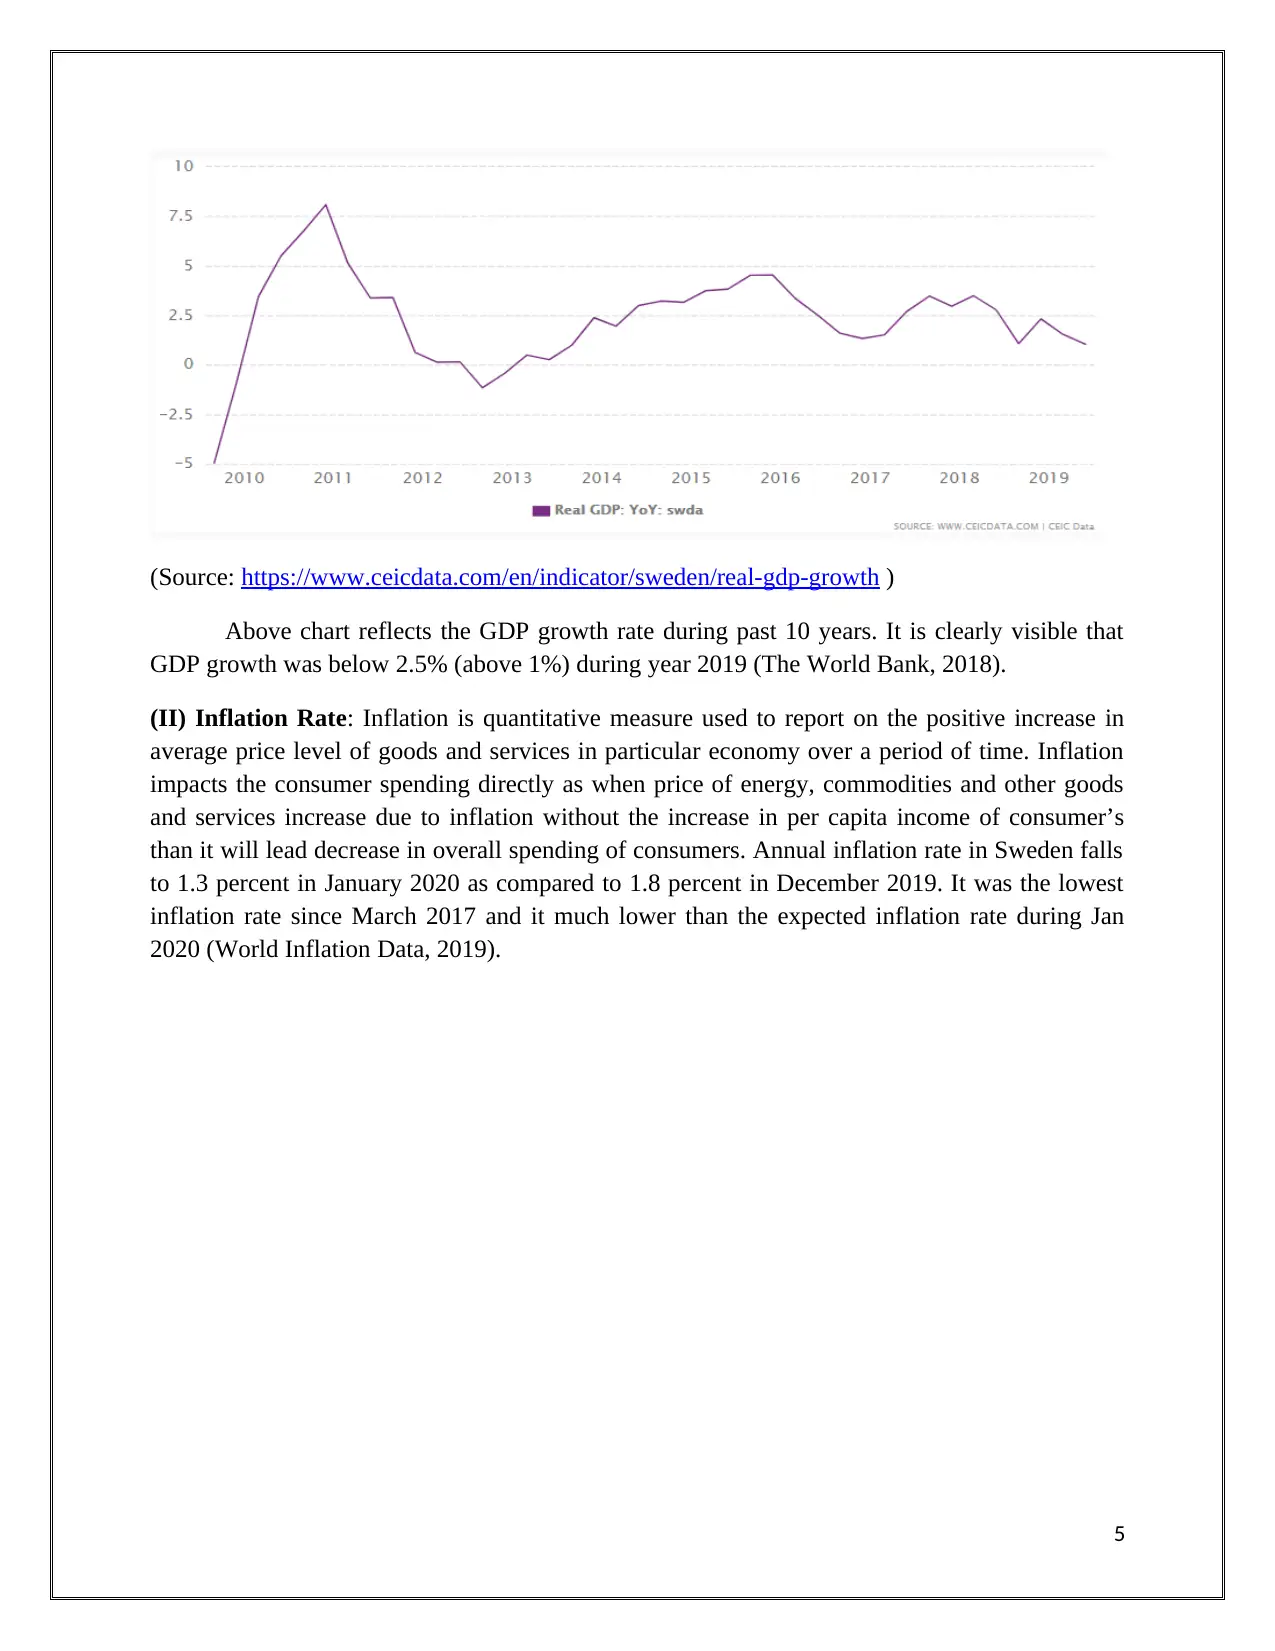
(Source: https://www.ceicdata.com/en/indicator/sweden/real-gdp-growth )
Above chart reflects the GDP growth rate during past 10 years. It is clearly visible that
GDP growth was below 2.5% (above 1%) during year 2019 (The World Bank, 2018).
(II) Inflation Rate: Inflation is quantitative measure used to report on the positive increase in
average price level of goods and services in particular economy over a period of time. Inflation
impacts the consumer spending directly as when price of energy, commodities and other goods
and services increase due to inflation without the increase in per capita income of consumer’s
than it will lead decrease in overall spending of consumers. Annual inflation rate in Sweden falls
to 1.3 percent in January 2020 as compared to 1.8 percent in December 2019. It was the lowest
inflation rate since March 2017 and it much lower than the expected inflation rate during Jan
2020 (World Inflation Data, 2019).
5
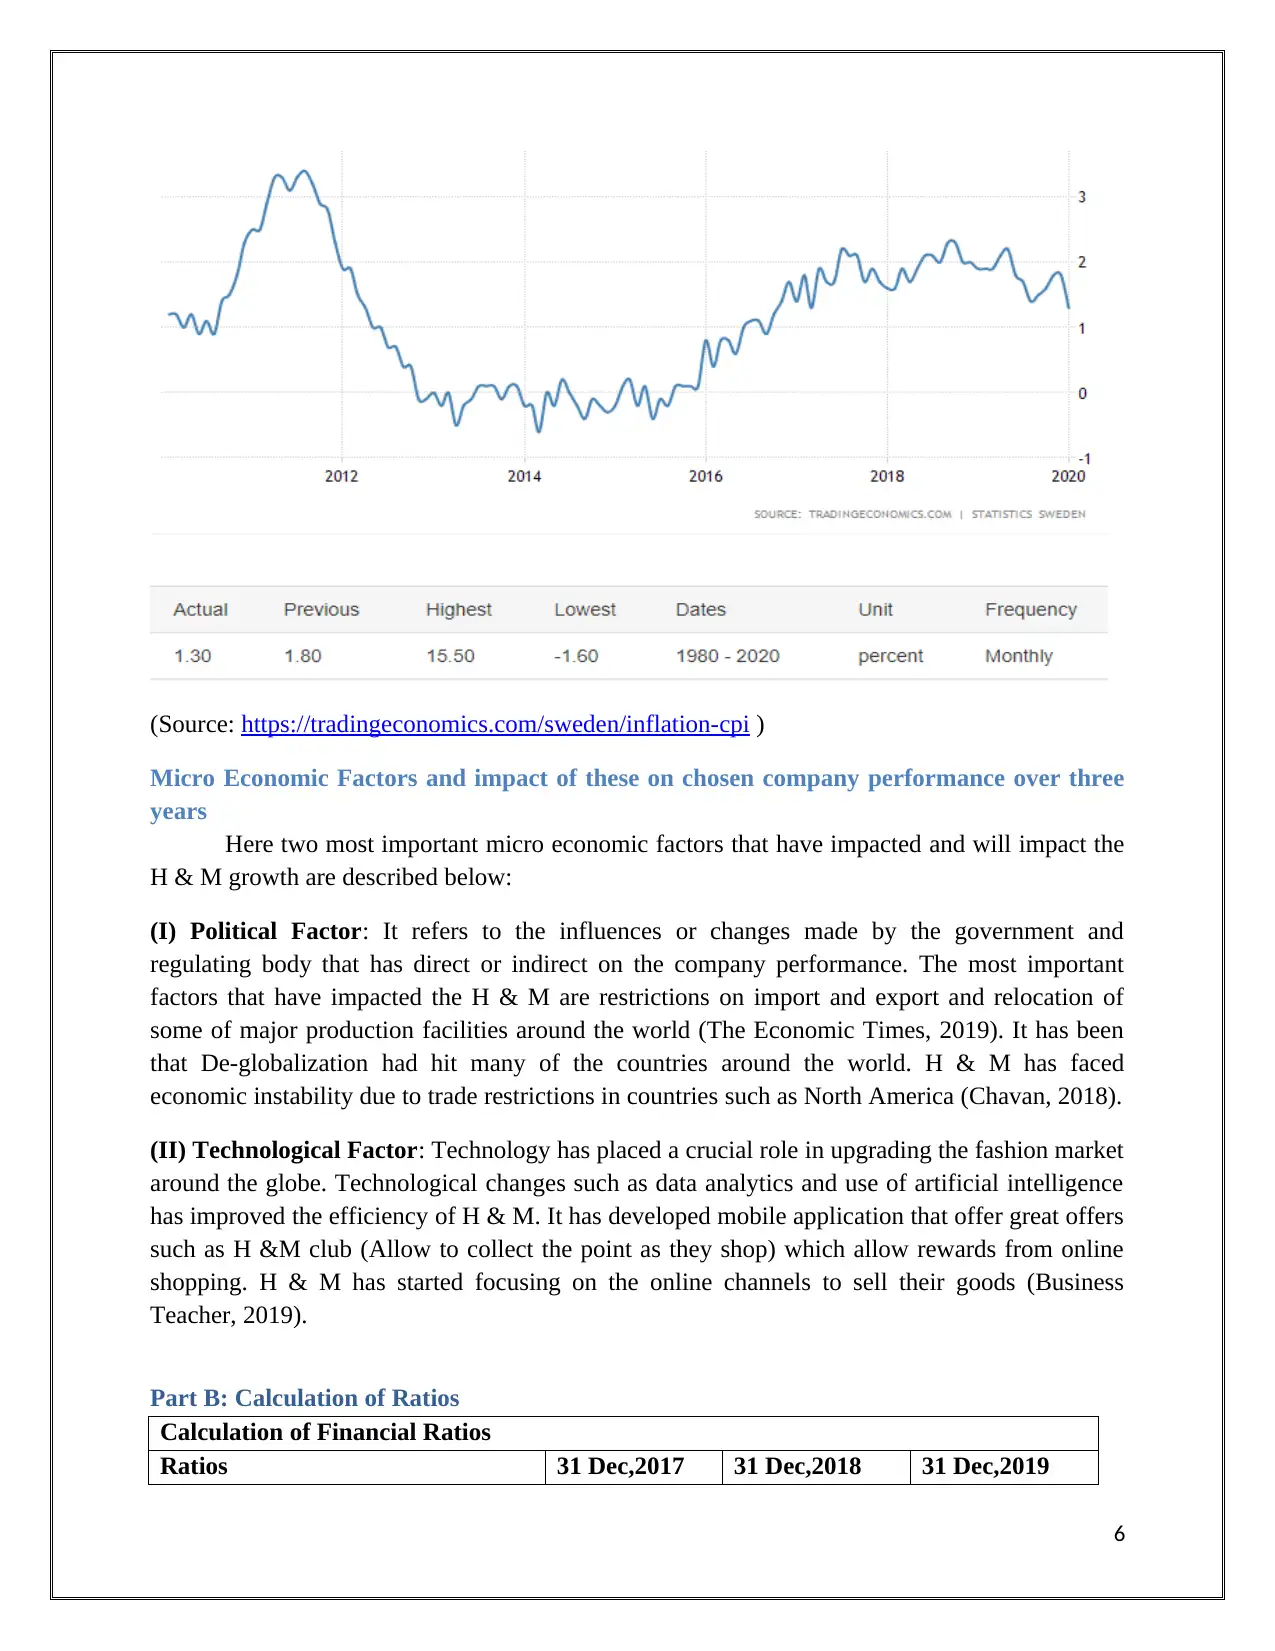
(Source: https://tradingeconomics.com/sweden/inflation-cpi )
Micro Economic Factors and impact of these on chosen company performance over three
years
Here two most important micro economic factors that have impacted and will impact the
H & M growth are described below:
(I) Political Factor: It refers to the influences or changes made by the government and
regulating body that has direct or indirect on the company performance. The most important
factors that have impacted the H & M are restrictions on import and export and relocation of
some of major production facilities around the world (The Economic Times, 2019). It has been
that De-globalization had hit many of the countries around the world. H & M has faced
economic instability due to trade restrictions in countries such as North America (Chavan, 2018).
(II) Technological Factor: Technology has placed a crucial role in upgrading the fashion market
around the globe. Technological changes such as data analytics and use of artificial intelligence
has improved the efficiency of H & M. It has developed mobile application that offer great offers
such as H &M club (Allow to collect the point as they shop) which allow rewards from online
shopping. H & M has started focusing on the online channels to sell their goods (Business
Teacher, 2019).
Part B: Calculation of Ratios
Calculation of Financial Ratios
Ratios 31 Dec,2017 31 Dec,2018 31 Dec,2019
6
⊘ This is a preview!⊘
Do you want full access?
Subscribe today to unlock all pages.
Trusted by 1+ million students worldwide
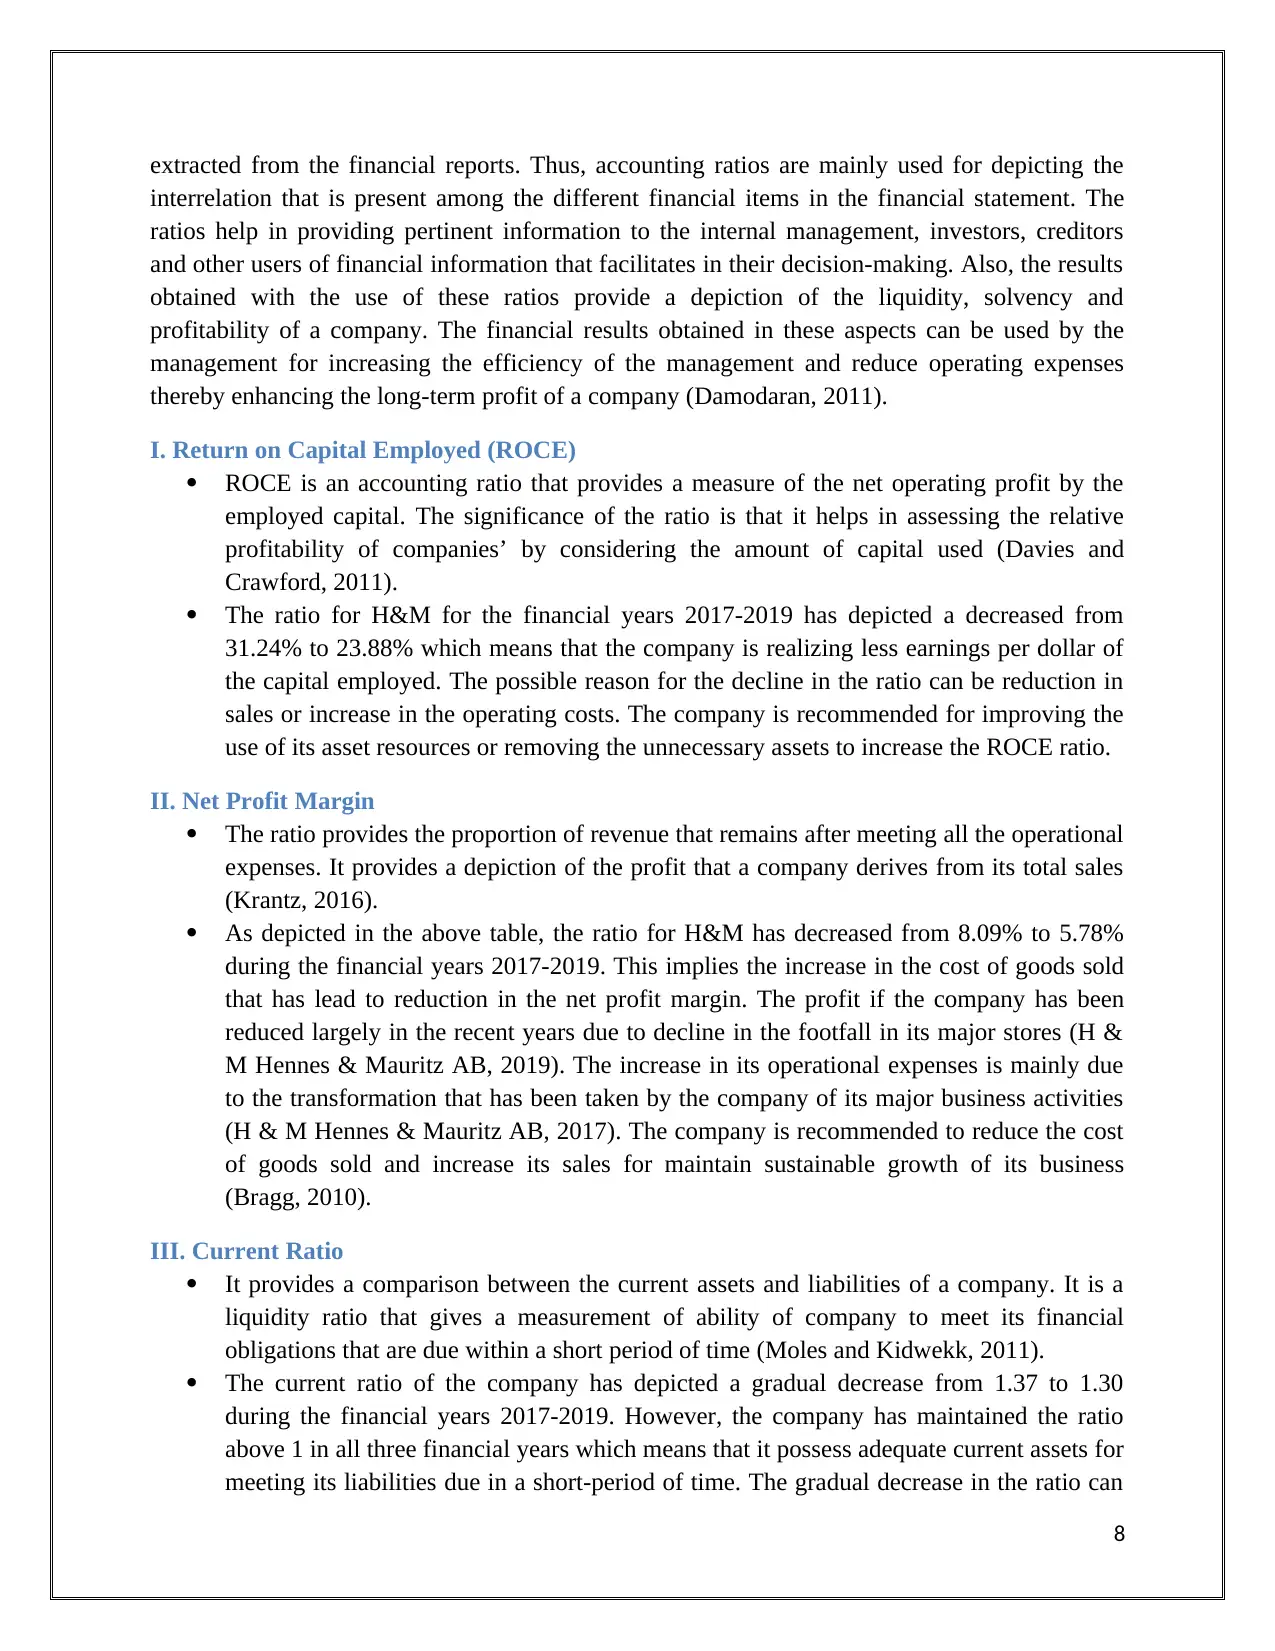
Figure in SEK Million
Return on capital employed
Operating Profit 20569.00 15493.00 17346.00
Capital Employed 65839.00 74571.00 72649.00
Ratio 31.24% 20.78% 23.88%
Net Profit Margin
Net Profit 16184.00 12652.00 13443.00
Sales Revenue 200004.00 210400.00 232755.00
Ratio 8.09% 6.01% 5.78%
Current Ratio
Current Assets 55746.00 61576.00 62272.00
Current Liabilities 40723.00 44219.00 47836.00
Ratio (In Times) 1.37 1.39 1.30
Debtors collection period
Trade Receivables 5297.00 6329.00 5879.00
Credit Sales 200004.00 210400.00 232755.00
Ratio (In days) 9.67 10.98 9.22
Creditors payment period
Trade Payables 7215.00 6800.00 7838.00
Beginning Inventory 31732.00 33712.00 37721.00
Ending Inventory 33712.00 37721.00 37823.00
Cost of Goods Sold 91914.00 99513.00 110302.00
Credit Purchases 93894.00 103522.00 110404.00
Ratio (In days) 28.05 23.98 25.91
(H & M Hennes & Mauritz AB, 2017); (H & M Hennes & Mauritz AB, 2018) and (H & M
Hennes & Mauritz AB, 2019)
C. Accounting Ratios & their Importance in Business
Accounting ratios are an important set of financial ratios that are used for gaining an
analysis of the efficiency and profitability performance of a company on the basis of information
7
Paraphrase This Document
Need a fresh take? Get an instant paraphrase of this document with our AI Paraphraser
extracted from the financial reports. Thus, accounting ratios are mainly used for depicting the
interrelation that is present among the different financial items in the financial statement. The
ratios help in providing pertinent information to the internal management, investors, creditors
and other users of financial information that facilitates in their decision-making. Also, the results
obtained with the use of these ratios provide a depiction of the liquidity, solvency and
profitability of a company. The financial results obtained in these aspects can be used by the
management for increasing the efficiency of the management and reduce operating expenses
thereby enhancing the long-term profit of a company (Damodaran, 2011).
I. Return on Capital Employed (ROCE)
ROCE is an accounting ratio that provides a measure of the net operating profit by the
employed capital. The significance of the ratio is that it helps in assessing the relative
profitability of companies’ by considering the amount of capital used (Davies and
Crawford, 2011).
The ratio for H&M for the financial years 2017-2019 has depicted a decreased from
31.24% to 23.88% which means that the company is realizing less earnings per dollar of
the capital employed. The possible reason for the decline in the ratio can be reduction in
sales or increase in the operating costs. The company is recommended for improving the
use of its asset resources or removing the unnecessary assets to increase the ROCE ratio.
II. Net Profit Margin
The ratio provides the proportion of revenue that remains after meeting all the operational
expenses. It provides a depiction of the profit that a company derives from its total sales
(Krantz, 2016).
As depicted in the above table, the ratio for H&M has decreased from 8.09% to 5.78%
during the financial years 2017-2019. This implies the increase in the cost of goods sold
that has lead to reduction in the net profit margin. The profit if the company has been
reduced largely in the recent years due to decline in the footfall in its major stores (H &
M Hennes & Mauritz AB, 2019). The increase in its operational expenses is mainly due
to the transformation that has been taken by the company of its major business activities
(H & M Hennes & Mauritz AB, 2017). The company is recommended to reduce the cost
of goods sold and increase its sales for maintain sustainable growth of its business
(Bragg, 2010).
III. Current Ratio
It provides a comparison between the current assets and liabilities of a company. It is a
liquidity ratio that gives a measurement of ability of company to meet its financial
obligations that are due within a short period of time (Moles and Kidwekk, 2011).
The current ratio of the company has depicted a gradual decrease from 1.37 to 1.30
during the financial years 2017-2019. However, the company has maintained the ratio
above 1 in all three financial years which means that it possess adequate current assets for
meeting its liabilities due in a short-period of time. The gradual decrease in the ratio can
8
however depict an increase in the short-term debt or decline in the current assets. The
company as such should improve its cash position for reducing the risk of not able to
meet its financial obligations in a timely manner.
IV. Average Receivable days/ Debtors collection period
It gives a depiction of the average number of days that a company takes for collection of
its funds after making sales. It gives a measure of the cash position of a company and its
long-term growth prospects (Schlichting, 2013).
The ratio for H&M has depicted a decrease from 9.68 to 9.22 over the financial years
2017-2019 which means that there is decrease in the number of days taken by the
company for collection of its credit. This indicates the presence of adequate the cash flow
within the business which can positively impact its long-term growth prospects. This
means that company is able to collect its outstanding payments as they become due and
this infers the presence of sufficient liquidity within the company (Baker and Powell,
2010).
V. Average Payable days/ Creditors collection period
The ratio provides an estimate of the average time taken by a company to meet debt
obligation of its trade suppliers. It helps in providing an insight of the potential advantage
taken by a company of its trade credit availability (Zimmerman and Yahya-Zadeh, 2011).
The credit collection period for H&M over the financial years 2017-2018 has decreased
from 28.05 to 25.91. This indicates the increase in the efficiency of the company to meet
its debt obligations and ensuring that it is taking full advantage of its trade credit
availability. This means that the company is having sufficient cash to meet the
obligations of its creditors. The presence of adequate cash flow within H&M despite of
decrease in its profitability in the recent years indicates that it able to maintain sufficient
cash flows and thus is having effective cash flow management (H & M Hennes &
Mauritz AB, 2018).
VI. Efficiency Ratio
It provides a measure of the non-interest expenses of a company by its net income. It
gives an insight into the ability of a company for using its assets and managing its
liabilities in an effective manner in the short-term (Arnold, 2013).
Part D. Recommendation
H&M, the world’s biggest apparel retailer ahs depicted from the financial analysis ahs
depicted a decrease in its net profitability over the past three years. This is mainly due to
decrease in its net sales and increase in the cost of goods sold and therefore it is
recommended to the management of the company for taking strategic measures to
increase the net sales by the use of attractive discount offers which helps in enhancing the
9
⊘ This is a preview!⊘
Do you want full access?
Subscribe today to unlock all pages.
Trusted by 1+ million students worldwide
footfall. The operational expenses should be decreased by increasing the production by
enhancing the market share (The Global Fashion Business Journal, 2019).
The decline in the ROCE ratio infers the decrease in its operational profitability which is
mainly due to decline in the visit to stores. As such, the company should adopt the use of
e-commerce and sale its products through online platform which would help in increasing
the sales volume. It would help the company to accelerate its online sales and meeting the
competition in the apparel market.
It is also recommended to the company for selling its unwanted or unused assets to
improve the ROCE ratio by ensuring the optimum utilization of capital employed (The
IRISH Times, 2020).
Part E. Conclusion
It can be stated form the overall analysis held within the report that both macro and
micro-economic factors such as interest rate, inflation rate, exchange rates and others have large
impact on the growth prospects of a business. The financial analysis of a company can be
effectively carried out with the use of ratio analysis tool. The ratio analysis of the company
H&M has inferred that there is decrease in the net profit position of the company due to decline
in its net sales. However, it has maintained sufficient cash flows within the company which
ensures that there is less financial risk for not meeting its debt obligations and will support its
future expansion plans.
10
Paraphrase This Document
Need a fresh take? Get an instant paraphrase of this document with our AI Paraphraser
References
Arnold, G., 2013. Corporate financial management. USA: Pearson Higher Ed.
Baker, K. and Powell, G. 2010. Understanding Financial Management: A Practical Guide.
USA: John Wiley & Sons.
Bragg, S. 2010. Business Ratios and Formulas: A Comprehensive Guide. US: John Wiley &
Sons.
Business Teacher. 2019. H&M PESTEL Analysis. [Online]. Available at:
https://businessteacher.org.uk/pestel/hm.php [Accessed on: 20 February 2020].
Chavan, R.B. 2018. Analysis of Fashion Industry Business Environment. [Online]. Available at:
https://lupinepublishers.com/fashion-technology-textile-engineering/fulltext/analysis-of-fashion-
industry-business-environment.ID.000144.php [Accessed on: 20 February 2020].
Damodaran, A, 2011. Applied corporate finance. USA: John Wiley & sons.
Davies, T. and Crawford, I., 2011. Business accounting and finance. USA: Pearson.
Economics stats. 2019. Sweden Inflation Rate. [Online]. Available at:
https://tradingeconomics.com/sweden/inflation-cpi [Accessed on: 20 February 2020].
H & M Hennes & Mauritz AB. 2017. Full Year Report. [Online]. Available at:
https://hmgroup.com/content/dam/hmgroup/groupsite/documents/en/cision/
2018/01/2110334_en.pdf [Accessed on: 20 February 2020].
H & M Hennes & Mauritz AB. 2018. Full Year Report. [Online]. Available at:
https://hmgroup.com/content/dam/hmgroup/groupsite/documents/masterlanguage/cision/
2019/01/2371044.pdf [Accessed on: 20 February 2020].
H & M Hennes& Mauritz AB. 2019. Full Year Report. [Online]. Available at:
https://hmgroup.com/content/dam/hmgroup/groupsite/documents/masterlanguage/cision/
2020/01/2629510.pdf [Accessed on: 20 February 2020].
Krantz, M. 2016. Fundamental Analysis for Dummies. USA: John Wiley & Sons.
Moles, P. and Kidwekk, D. 2011. Corporate finance. USA: John Wiley &sons.
Schlichting, T. 2013. Fundamental Analysis, Behavioural Finance and Technical Analysis on the
Stock Market. Australia: GRIN Verlag.
11
The Economic Times. 2019. H&M India sales increase 39% in second quarter.
https://economictimes.indiatimes.com/industry/services/retail/hm-india-sales-increase-39-in-
second-quarter/articleshow/69971168.cms?from=mdr [Accessed on: 20 February 2020].
The Global Fashion Business Journal. 2019. H&M keeps transforming: profit down 41% but
sales up 10%. [Online]. Available at: https://www.themds.com/companies/hm-keeps-
transforming-profit-down-41-but-sales-up-10.html [Accessed on: 20 February 2020].
The IRISH Times. 2020. H&M profit falls less than expected after it curbs discounts. [Online].
Available at: https://www.irishtimes.com/business/retail-and-services/h-m-profit-falls-less-than-
expected-after-it-curbs-discounts-1.3842804 [Accessed on: 20 February 2020].
The World Bank. 2018. GDP growth (annual %). [Online]. Available at:
https://data.worldbank.org/indicator/NY.GDP.MKTP.KD.ZG?
end=2018&locations=SE&start=2000&view=chart [Accessed on: 20 February 2020].
Trading Economics. 2019. Sweden GDP Annual Growth Rate. [Online]. Available at:
https://tradingeconomics.com/sweden/gdp-growth-annual [Accessed on: 20 February 2020].
World Inflation Data. 2019. Inflation Sweden 2019. [Online]. Available at:
https://www.inflation.eu/inflation-rates/sweden/historic-inflation/cpi-inflation-sweden-2019.aspx
[Accessed on: 20 February 2020].
Zimmerman, J.L. and Yahya-Zadeh, M., 2011. Accounting for decision making and
control. Issues in Accounting Education, 26(1), pp.258-259.
12
⊘ This is a preview!⊘
Do you want full access?
Subscribe today to unlock all pages.
Trusted by 1+ million students worldwide
1 out of 12
Related Documents


Your All-in-One AI-Powered Toolkit for Academic Success.
+13062052269
info@desklib.com
Available 24*7 on WhatsApp / Email
![[object Object]](/_next/static/media/star-bottom.7253800d.svg)
Unlock your academic potential
Copyright © 2020–2026 A2Z Services. All Rights Reserved. Developed and managed by ZUCOL.