Sony Corporation Financial Analysis: An In-depth Study
VerifiedAdded on 2024/05/21
|16
|925
|80
Report
AI Summary
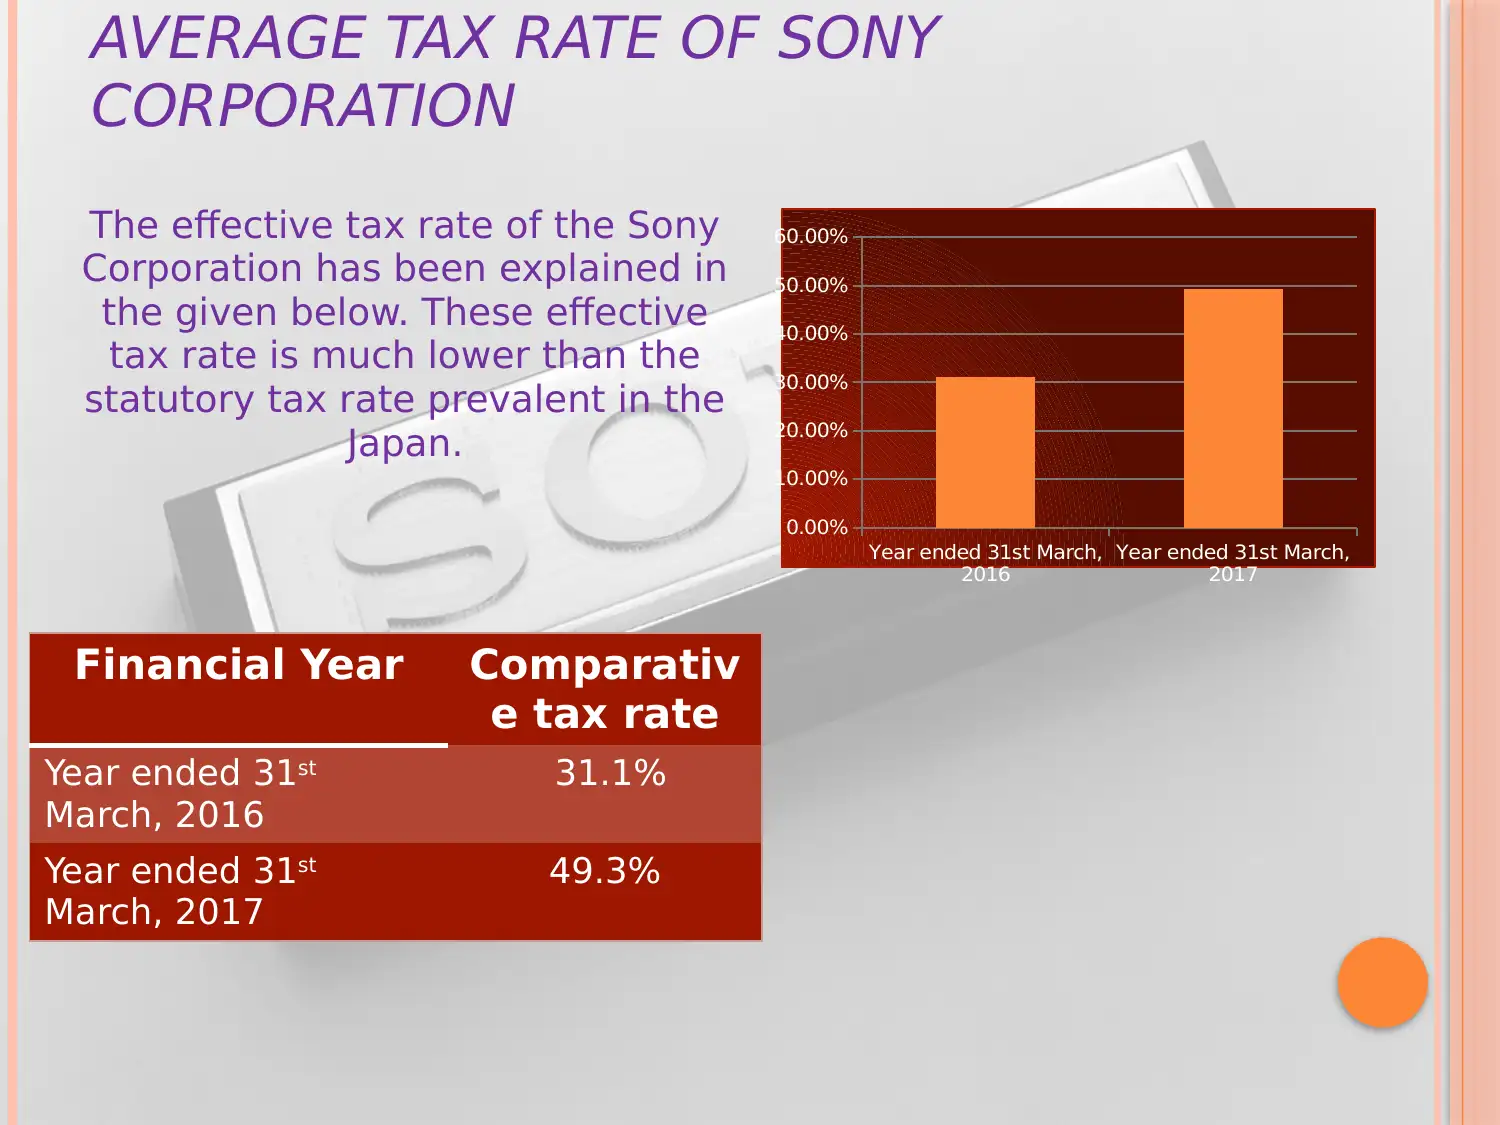
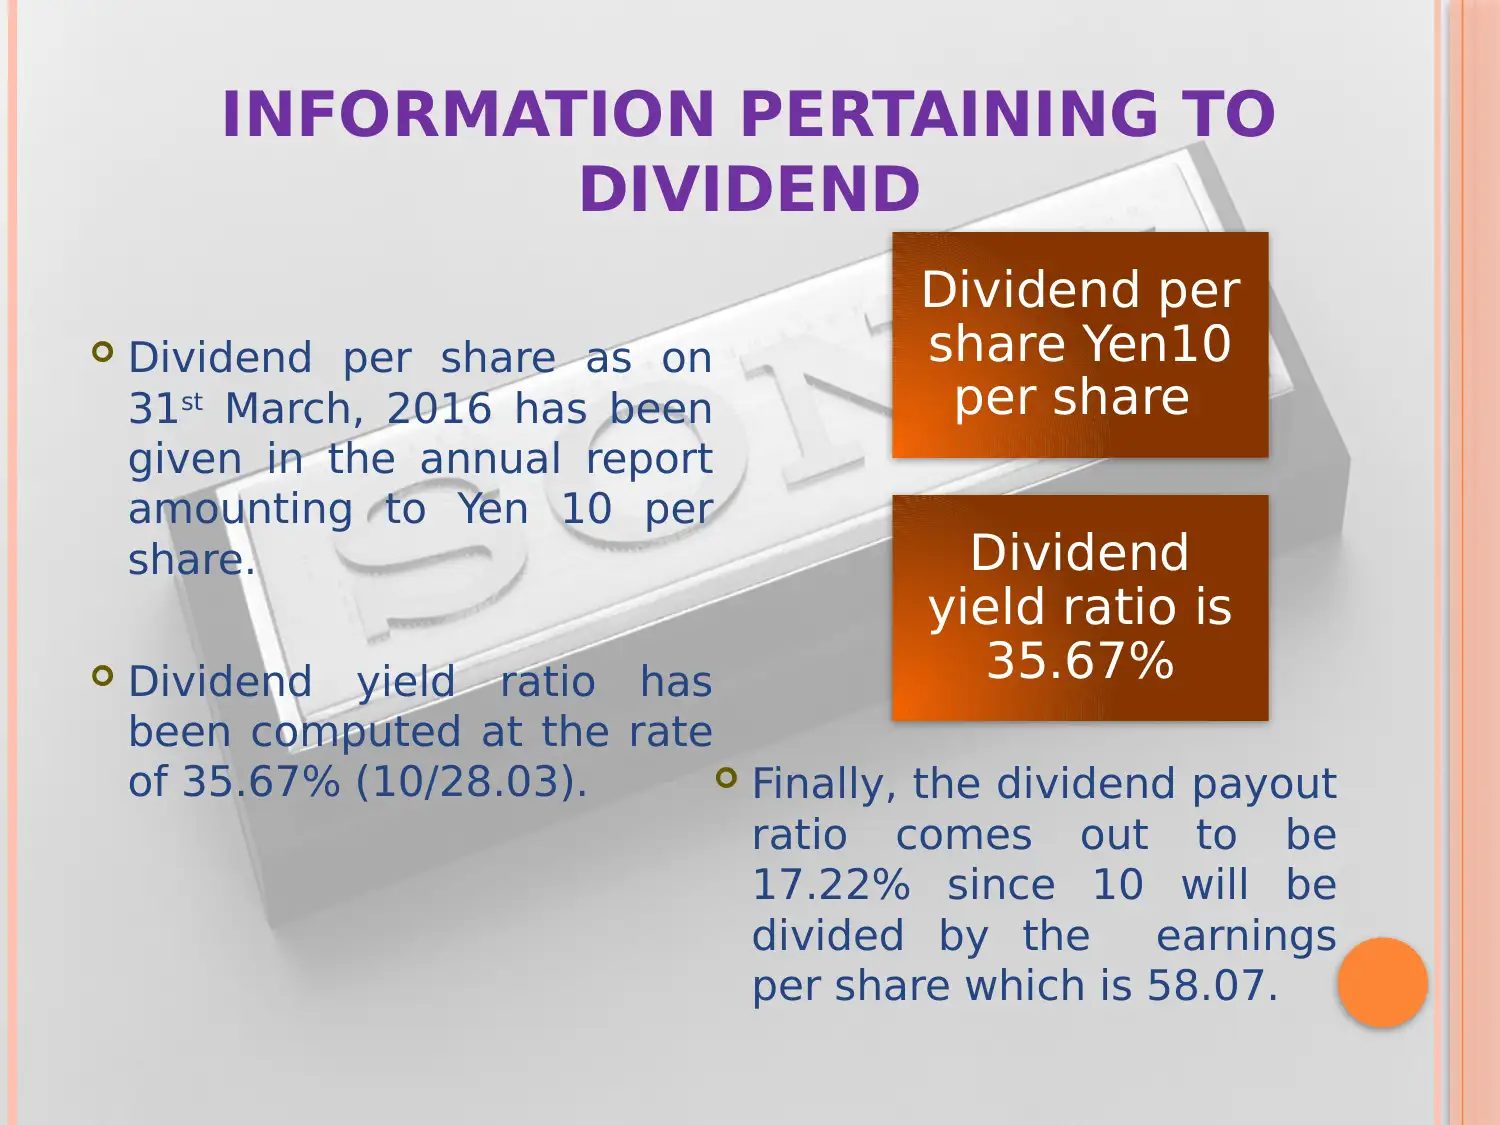
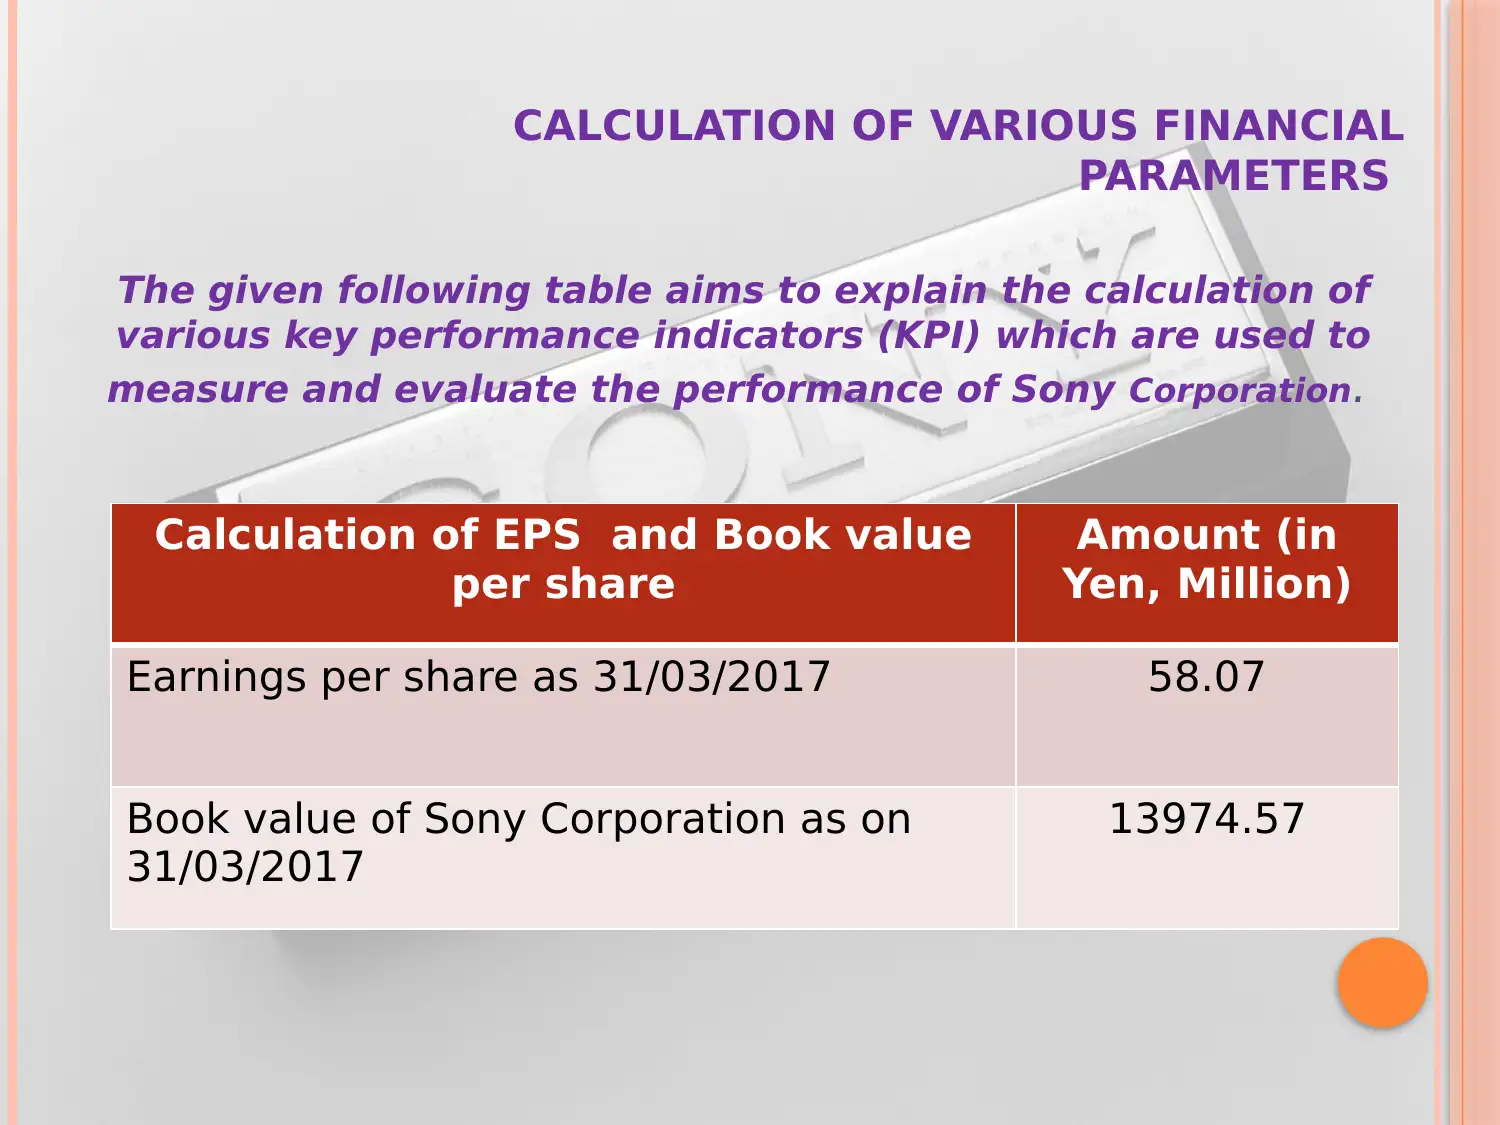
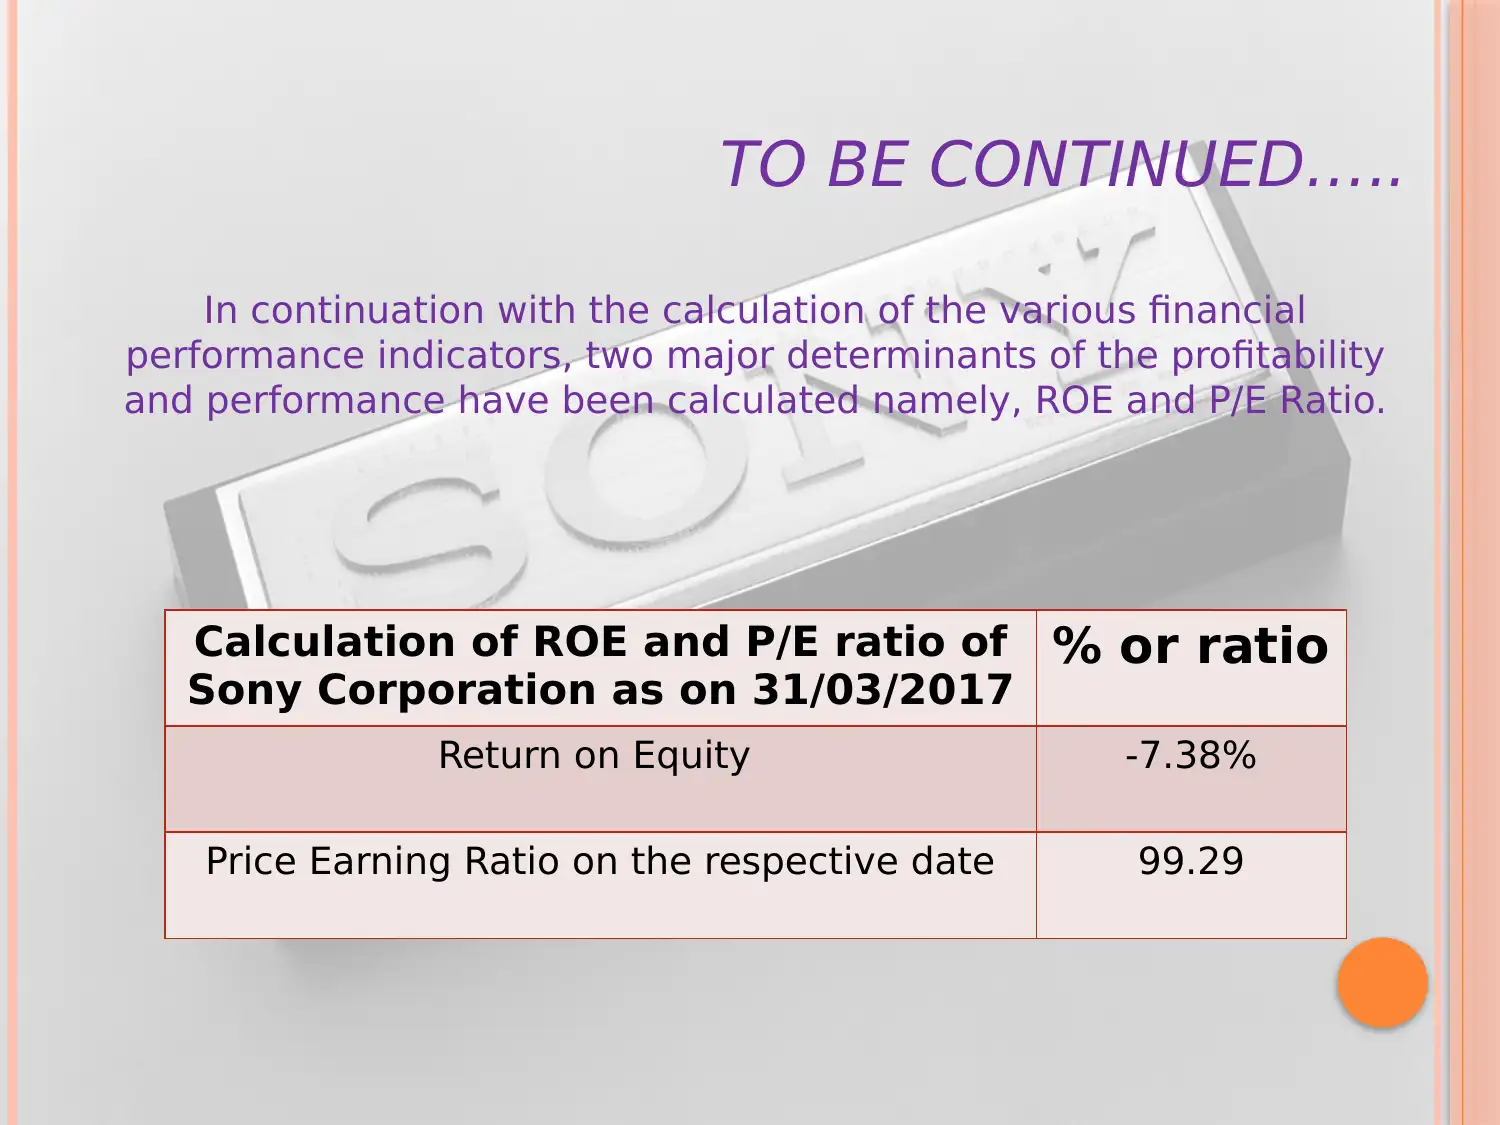
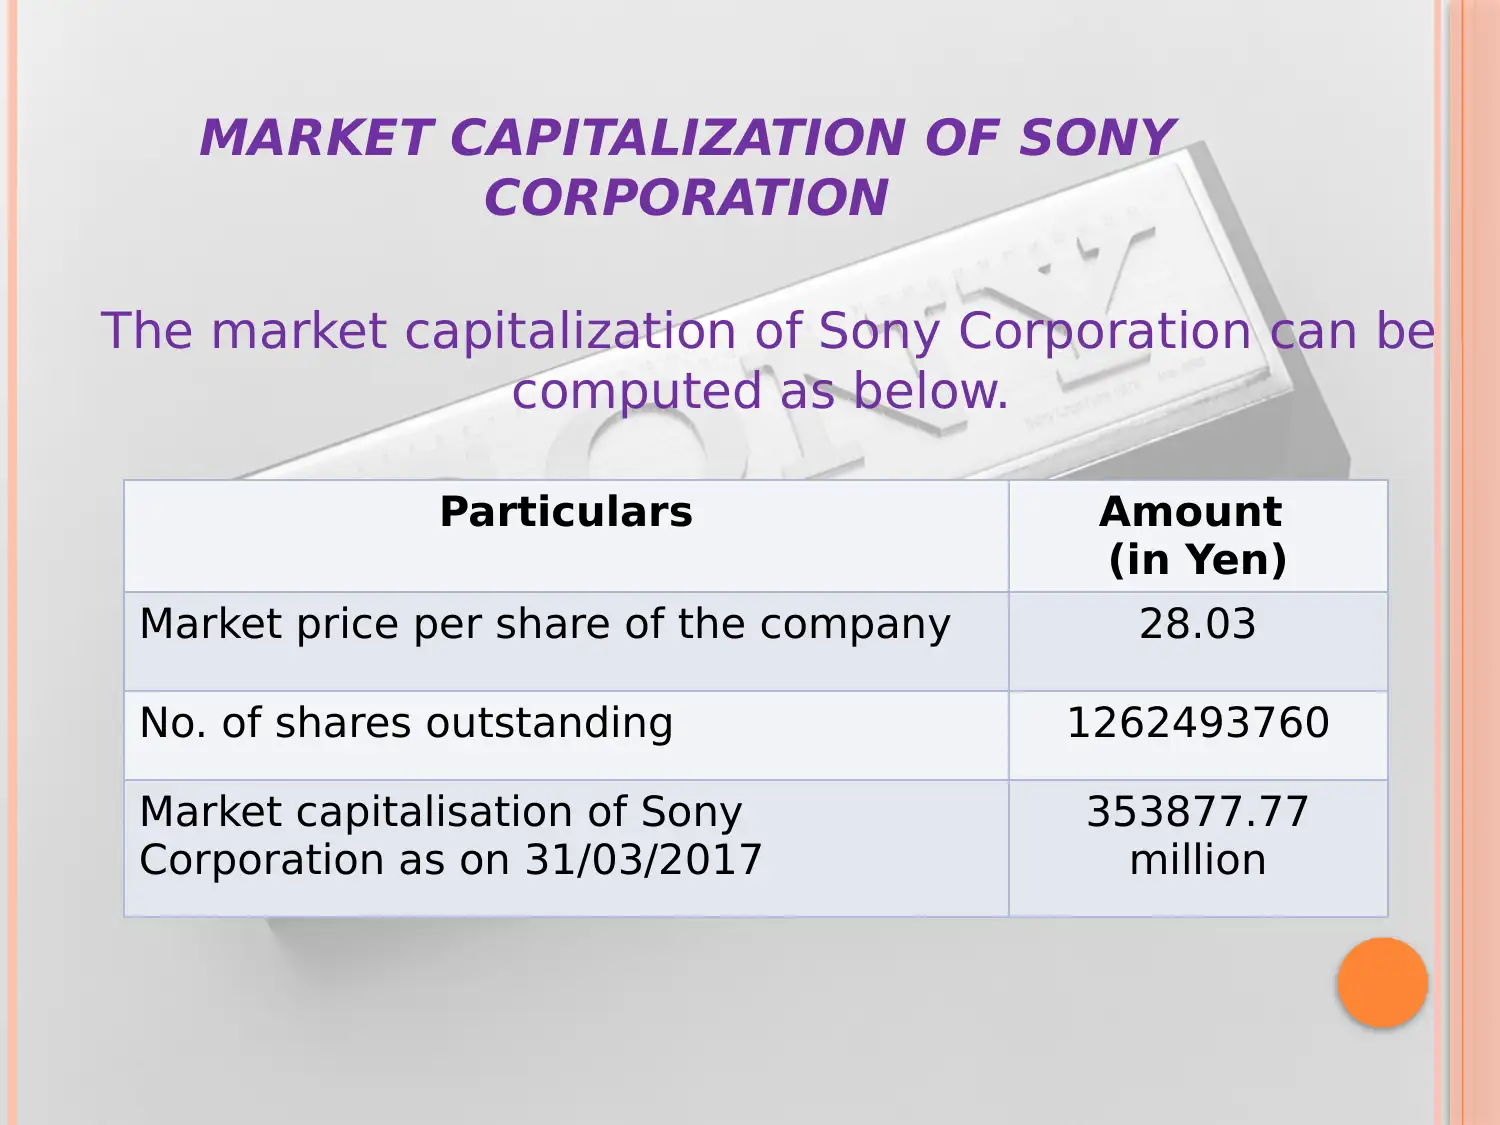
This report presents a comprehensive financial analysis of Sony Corporation, examining key performance indicators such as the average tax rate, dividend information, earnings per share, book value, return on equity, and price-to-earnings ratio. It assesses the current and expected growth rates of the company, determines the expected share price, and evaluates the market capitalization. The analysis also covers Sony's dividend payments, share buyback activities (or lack thereof), sources of cash, and the utilization of acquired funds. The report concludes with an overview of Sony Corporation's financial performance, highlighting the accuracy and transparency of its operations for effective growth and development.

AN ANALYSIS
AND INDEPTH
STUDY OF SONY
CORPORATION
AND INDEPTH
STUDY OF SONY
CORPORATION
Paraphrase This Document
Need a fresh take? Get an instant paraphrase of this document with our AI Paraphraser

TABLE OF CONTENTS
Introduction
Average tax rate of Sony Corporation
Information pertaining to Dividend
Calculation of various financial parameters
Current and expected growth rate
Determination of expected share price
Market capitalization of Sony Corporation
Payment of cash dividend
Buyback of shares
Sources of cash
Utilization of cash acquired

INTRODUCTION
The given presentation aims to give a
glimpse of analysis and interpretation of
financial information of Sony Corporation,
an organisation which is engaged in the
production of generally electronic items.
The given presentation aims to give a
glimpse of analysis and interpretation of
financial information of Sony Corporation,
an organisation which is engaged in the
production of generally electronic items.
⊘ This is a preview!⊘
Do you want full access?
Subscribe today to unlock all pages.

Trusted by 1+ million students worldwide

AVERAGE TAX RATE OF SONY
CORPORATION
The effective tax rate of the Sony
Corporation has been explained in
the given below. These effective
tax rate is much lower than the
statutory tax rate prevalent in the
Japan.
Financial Year Comparativ
e tax rate
Year ended 31st
March, 2016
31.1%
Year ended 31st
March, 2017
49.3%
Year ended 31st March,
2016
Year ended 31st March,
2017
0.00%
10.00%
20.00%
30.00%
40.00%
50.00%
60.00%
Paraphrase This Document
Need a fresh take? Get an instant paraphrase of this document with our AI Paraphraser

INFORMATION PERTAINING TO
DIVIDEND
Dividend per share as on
31st March, 2016 has been
given in the annual report
amounting to Yen 10 per
share.
Dividend yield ratio has
been computed at the rate
of 35.67% (10/28.03). Finally, the dividend payout
ratio comes out to be
17.22% since 10 will be
divided by the earnings
per share which is 58.07.
Dividend per
share Yen10
per share
Dividend
yield ratio is
35.67%

CALCULATION OF VARIOUS FINANCIAL
PARAMETERS
Calculation of EPS and Book value
per share
Amount (in
Yen, Million)
Earnings per share as 31/03/2017 58.07
Book value of Sony Corporation as on
31/03/2017
13974.57
The given following table aims to explain the calculation of
various key performance indicators (KPI) which are used to
measure and evaluate the performance of Sony Corporation.
⊘ This is a preview!⊘
Do you want full access?
Subscribe today to unlock all pages.

Trusted by 1+ million students worldwide

TO BE CONTINUED…..
Calculation of ROE and P/E ratio of
Sony Corporation as on 31/03/2017 % or ratio
Return on Equity -7.38%
Price Earning Ratio on the respective date 99.29
In continuation with the calculation of the various financial
performance indicators, two major determinants of the profitability
and performance have been calculated namely, ROE and P/E Ratio.
Paraphrase This Document
Need a fresh take? Get an instant paraphrase of this document with our AI Paraphraser

CURRENT AND EXPECTED GROWTH
RATE
The growth rate of the Sony Corporation
ranges from 3% to 11%. This growth rate can
be used for fair value measurement. A single
growth rate cannot be defined as it is engaged
in multiple operations. since it will helps to
take crucial financial decisions.
RATE
The growth rate of the Sony Corporation
ranges from 3% to 11%. This growth rate can
be used for fair value measurement. A single
growth rate cannot be defined as it is engaged
in multiple operations. since it will helps to
take crucial financial decisions.

MARKET CAPITALIZATION OF SONY
CORPORATION
The market capitalization of Sony Corporation can be
computed as below.
Particulars Amount
(in Yen)
Market price per share of the company 28.03
No. of shares outstanding 1262493760
Market capitalisation of Sony
Corporation as on 31/03/2017
353877.77
million
CORPORATION
The market capitalization of Sony Corporation can be
computed as below.
Particulars Amount
(in Yen)
Market price per share of the company 28.03
No. of shares outstanding 1262493760
Market capitalisation of Sony
Corporation as on 31/03/2017
353877.77
million
⊘ This is a preview!⊘
Do you want full access?
Subscribe today to unlock all pages.

Trusted by 1+ million students worldwide

DETERMINATION OF EXPECTED
SHARE PRICE
The dividend paid during the current year 2017
amounts to Yen 20 per share.
If the expected return of the shareholders of Sony
Corporation is 10%, then the expected share price
of the financial year 2017 comes out to Yen 200.
This amount has been arrived by simply dividing
the dividend paid by the expected rate of dividend
or generally known as cost of capital.
Paraphrase This Document
Need a fresh take? Get an instant paraphrase of this document with our AI Paraphraser

PAYMENT OF CASH DIVIDEND
Sony Corporation has paid cash dividend
during the financial year 2016 and 2017
amounting Yen 10 each year. This can be
further explained with the help of following
table.
Particulars 2016 2017
Interim cash dividends declared 10 10
Fiscal year-end cash dividends 10 10
Total cash dividend paid during
the year
20 20

BUYBACK OF SHARES
Sony Corporation has not buyback any share
during the FY 2016 and 2017. There are
different types of ordinary equity and Sony
has not buyback any kind of shares.
As such company has sufficient funds so it
does not require buyback of shares. Besides,
the corporate don’t have any future plans
regarding expansion or growth for which it
needs to buy back the shares.
⊘ This is a preview!⊘
Do you want full access?
Subscribe today to unlock all pages.

Trusted by 1+ million students worldwide
1 out of 16
Related Documents
Your All-in-One AI-Powered Toolkit for Academic Success.
+13062052269
info@desklib.com
Available 24*7 on WhatsApp / Email
Unlock your academic potential
Copyright © 2020–2026 A2Z Services. All Rights Reserved. Developed and managed by ZUCOL.


