Analysing a Network Management Tool
VerifiedAdded on 2023/01/18
|10
|2644
|67
AI Summary
This report analyzes the network management tool ManageEngine OpManager and its benefits for organizations. It also compares OpManager with other network management tools.
Contribute Materials
Your contribution can guide someone’s learning journey. Share your
documents today.

Running head: ANALYSING A NETWORK MANAGEMENT TOOL
ANALYSING A NETWORK MANAGEMENT TOOL
Name of the Student
Name of the University
Author Note
ANALYSING A NETWORK MANAGEMENT TOOL
Name of the Student
Name of the University
Author Note
Secure Best Marks with AI Grader
Need help grading? Try our AI Grader for instant feedback on your assignments.

1ANALYSING A NETWORK MANAGEMENT TOOL
Executive Summary
The aim of this report is to analyse a network management tool ManageEngine OpManager.
This gives an organization several benefits by real time monitoring on the network. A
comparison of the OpManager is also compared with other network management tools. The
report is concluded how the organization is benefitted by the tool.
2ANALYSING A NETWORK MANAGEMENT TOOL
Table of Contents
Introduction................................................................................................................................3
Discussion..................................................................................................................................3
Part 1: ManageEngine OpManager........................................................................................3
Part 2: Applications of ManageEngine OpManager..............................................................5
Part 3: Differences and similarities between ManageEngine OpManager with any other
network management tool:-....................................................................................................7
Conclusion..................................................................................................................................7
References..................................................................................................................................9
3ANALYSING A NETWORK MANAGEMENT TOOL
Introduction
ManageEngine OpManager is a software that is used by various mixed-vendor IT enterprise
which ensures end-to-end encryption [1]. For managing and scaling purpose it provides a unique
approach. It provides management of distributed IT infrastructure, management of performance and
fault across IT resources that e critical with the help of network devices, Wide area network
connection, servers, domain controller, virtual servers, MS SQL and many other components of IT
infrastructure. ManageEngine OpManager provides a range of functionalities for example, virtual
and physical monitoring of server, analysis of bandwidth based on flow, log analysis on the firewall,
management of switch port which allow the users control and visibility that they required for their
network [2]. The setup of the system is straightforward and quick to install. For installing as a service
and to for using the in-built MySQL or MSSQL server that is standalone the system offers a variety of
options. The OpManager allow the user to make templates that enhance the design by making it fast
and straightforward. Elements such as interval polling, tracking the device parameters the user can
specify these things in the templates. Real time performance tracking of the network devices can be
achieved using live dashboards and graphs [3]. Performance metrics, which are essential such as
utilisation of memory, CPU, disk space and availability across physical and virtual servers, can be
monitored. In this report, there are three parts. The first part consists of the management of
network performance. The second part will discuss the points of Management Engine OpManager
providing real-time availability monitor, how analysis of network traffic is achieved. The third part
gives a comparison between ManageEngine OpManager and other tools for network management.
Discussion
Part 1: Manage Engine OpManager
For the IT infrastructure, the computer network is the backbone of the enterprise. To
enhance the experience of the end users management and monitoring is an important thing. To
keep the organization running successfully the network performance need to be improved. To
deliver the critical solutions smoothly and swiftly by maintaining the SLA(Service Level Agreements is
ensured by this system. The network that is prone to errors can have a severe impact on
performance. Thus, to ensure fast and smooth functioning of some applications that are critical it is
important to monitor the issues related to the production of network and mishaps prevention [4].
The monitoring process the network related problems need to be diagnosed and troubleshooting
them before they trouble the end users.
Secure Best Marks with AI Grader
Need help grading? Try our AI Grader for instant feedback on your assignments.
4ANALYSING A NETWORK MANAGEMENT TOOL
Out of the other network, monitoring tool OpManager is considered as one of the perfect
network-monitoring tools. Several benefits are offered by the OpManager and it provides
functionalities by coming out of the box. OpManager version12.3 is considered as first integrated
network managing software for smarter and faster management of the network. It provides
transparency and control that is required by the system by allowing virtual and physical monitoring
of the server, analysis of bandwidth, configuration, archiving, change management, management of
switch ports and IP address. It also provides quick setup of the installation process. OpManager is
configurable to a high level which makes it a good choice of the user for network management [5].
The OpManager offers task on startup for example network discovery. It makes entry to the IP
ranges and SNMP string very quick. The development of new networks and adding devices becomes
simple with the use of ManageEngine OpManager. Identification and rectification of network related
issues are enabled by the Threshold-based alert. The methods of network monitoring such as
forwarding trap, reading,generations of alarm, syslog messages and many others help to correct the
errors that are generated.
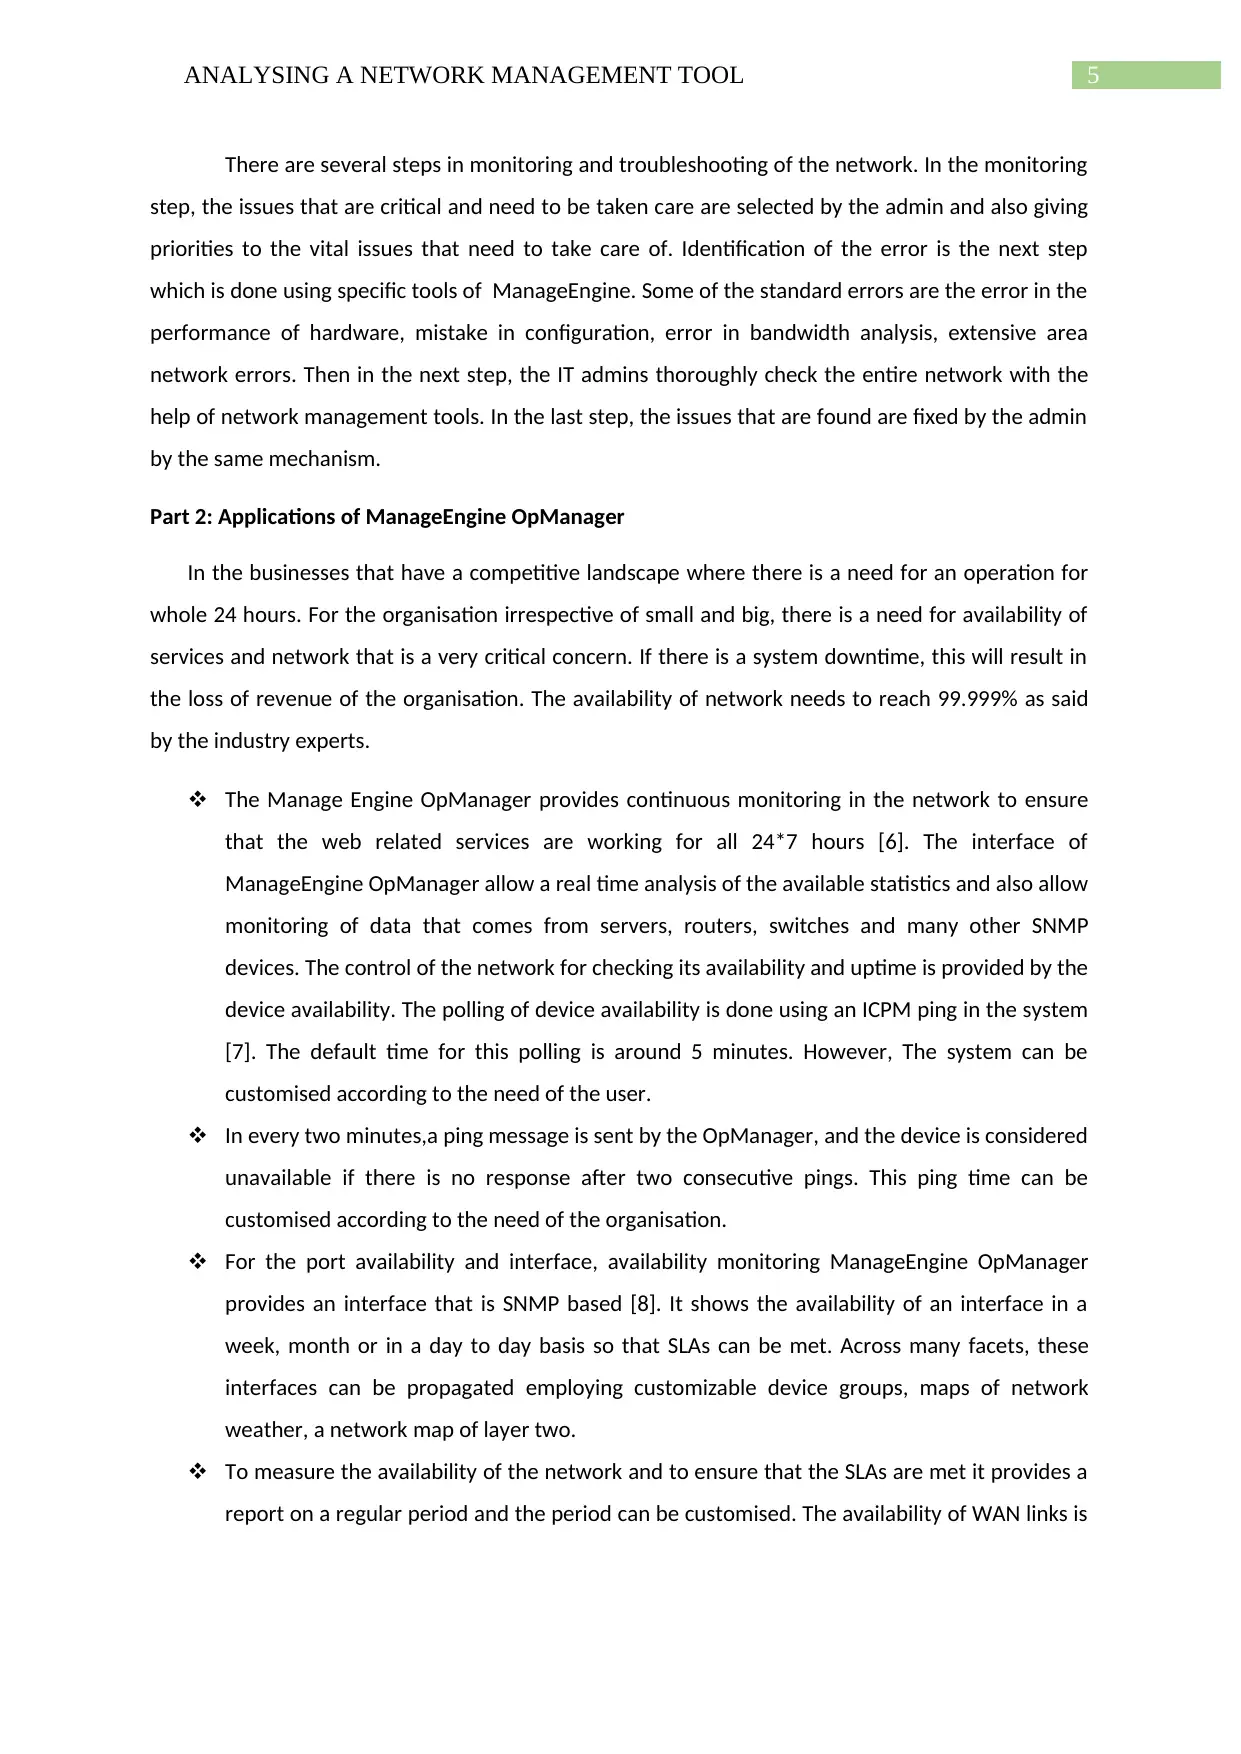
Network Diagram for motoring and troubleshooting :
Figure1
(Source: Created by Author)
5ANALYSING A NETWORK MANAGEMENT TOOL
There are several steps in monitoring and troubleshooting of the network. In the monitoring
step, the issues that are critical and need to be taken care are selected by the admin and also giving
priorities to the vital issues that need to take care of. Identification of the error is the next step
which is done using specific tools of ManageEngine. Some of the standard errors are the error in the
performance of hardware, mistake in configuration, error in bandwidth analysis, extensive area
network errors. Then in the next step, the IT admins thoroughly check the entire network with the
help of network management tools. In the last step, the issues that are found are fixed by the admin
by the same mechanism.
Part 2: Applications of ManageEngine OpManager
In the businesses that have a competitive landscape where there is a need for an operation for
whole 24 hours. For the organisation irrespective of small and big, there is a need for availability of
services and network that is a very critical concern. If there is a system downtime, this will result in
the loss of revenue of the organisation. The availability of network needs to reach 99.999% as said
by the industry experts.
The Manage Engine OpManager provides continuous monitoring in the network to ensure
that the web related services are working for all 24*7 hours [6]. The interface of
ManageEngine OpManager allow a real time analysis of the available statistics and also allow
monitoring of data that comes from servers, routers, switches and many other SNMP
devices. The control of the network for checking its availability and uptime is provided by the
device availability. The polling of device availability is done using an ICPM ping in the system
[7]. The default time for this polling is around 5 minutes. However, The system can be
customised according to the need of the user.
In every two minutes,a ping message is sent by the OpManager, and the device is considered
unavailable if there is no response after two consecutive pings. This ping time can be
customised according to the need of the organisation.
For the port availability and interface, availability monitoring ManageEngine OpManager
provides an interface that is SNMP based [8]. It shows the availability of an interface in a
week, month or in a day to day basis so that SLAs can be met. Across many facets, these
interfaces can be propagated employing customizable device groups, maps of network
weather, a network map of layer two.
To measure the availability of the network and to ensure that the SLAs are met it provides a
report on a regular period and the period can be customised. The availability of WAN links is
6ANALYSING A NETWORK MANAGEMENT TOOL
one of the expensive element in the IT infrastructure. To improve the performance in the
area of extensive area network, a solution is provided by the OpManager.
The availability of the Wide Area Network can also be monitored using the OpManager
tool.The links of the Wide Area Network is the most important and expensive component of
an IT organisation [9]. The SLA from Cisco is used for monitoring the availability of Wide
Area Network links that in turns improve the application of WAN. Details of latency in the
Wide Area Network
To ensure the availability service monitoring a report and graphs is provided by the
OpManager to provide information about response time and availability of TCP service.
OpManager also provides information monitoring using WMI.
It also provides website monitoring that includes motoring of HTTP/HTTPS, web servers,
intranet sites, web applications and many others. It ensures that the website is running and
is not in risk of hacking. Website content can also be checked by monitoring the site.
For monitoring of the process, a variety of protocols is given by the OpManager. It provides
control of the process running in Linux, Windows, UNIX, IBM AIX, virtual machines and many
more.
Every organisation face the problem of traffic in network resulting in slow network availability.
Bandwidth related issues are encountered by a system or application.OpManager provides the
advantage of identifying the hogs within the bandwidthand rectifying it before it affects the network.
The protocol of managing the network by the OpManager has done by analysing the traffic [14].With
the help of these protocols user can achieve filtering the traffic with the time interval, the value of
the polled traffic can be seen, and traffic in the interface can also be seen.Within the OpManager
helps by providinga transparency pattern of network traffic and utilisation of bandwidth.The module
of network flow Network traffic analysis is done with the help of a software that uses a Cisco Net
flow for monitoring of the bandwidth and how it runs in a different platform. The routing and the
switch devices that are introduced by Cisco involves in exporting of Network flow in the form of UDP
packets [10]. The OpManager uses cache memory of the invention for recording the traffic. The
availability of extensive area network monitoring helps in improving the performance in the WAN.
Part 3: Differences and similarities between ManageEngine OpManager with any other network
management tool:-
A comparison between SolarWinds Performance monitor and ManageEngine OpManager is
made. The structure of price in SolarWinds is excellent. Elements that are monitored is used for
licensing. In the SolarWind interface of the web is customizable which allow the user to select a view
Paraphrase This Document
Need a fresh take? Get an instant paraphrase of this document with our AI Paraphraser
7ANALYSING A NETWORK MANAGEMENT TOOL
that is comfortable for them [11].The interface in OpManager is straightforward to use. The
OpManager is used for analysing the traffic within the network. SolarWind is used for monitoring the
availability of system and performance. The SolarWind performance manager is a map, which
consists of the topology of layer 2 [12]. The solar wind can automatically discover network device.
The OpManager is involved in monitoring the virtualisation. The other involved in intelligently
alerting the network. Both the system is used in large enterprises and medium size organisation.
Both the system provides a variety of support options that includes FAQs, online support, knowledge
base, video tutorials.
Conclusion
It can be concluded from the above report that ManageEngine OpManager is a traffic one of
the best tool for monitoring the traffic. It is used by many organisations to get rid of the network
traffic related issues, which affects their production. This system offers monitoring of real time
traffic. It helps to deal with the organisation with several problems related to several network
devices and network issues. It assist in building a customizable network interface design which is
very helpful. It is available at a reasonable price and is highly configurable, and hence it is preferred
by many small and big organisation. Thus, many small, medium as well as big business highly
recommend this system as their tool for network management.
8ANALYSING A NETWORK MANAGEMENT TOOL
References
[1] J., Hernantes, G.Gallardo, and N.Serrano, IT infrastructure-monitoring tools. IEEE Software, 32(4),
pp.88-93, 2015.
[2]K., Alhamazani, R., Ranjan, R., K., Mitra, F., Rabhi, P.P., Jayaraman, S.U., Khan, A., Guabtni, and
V.,Bhatnagar, An overview of the commercial cloud monitoring tools: research dimensions, design
issues, and state-of-the-art. Computing, 97(4), pp.357-377, 2015.
[3] C.N.,Udanor and O.U., Oparaku, A performance evaluation of a multi-agent mobile learning
system. International Journal of Interactive Mobile Technologies (iJIM), 10(2), pp.10-18, 2016.
[4] D., Gedam, R., Holla, andS., Mithyantha, Citrix Systems Inc. Systems and methods for trap
monitoring in multi-core and cluster systems. U.S. Patent 9,699,061, 2017.
[5] V.T., Guimarães, A reuse-based approach to promote the adoption of info vis tecniques for
network and service management tasks, 2016.
[6] F.T., Rothaermel, Strategic management. McGraw-Hill Education, 2015.
[7] J., Wiggs, and B.O.T.T., Eric, NetMotion Wireless Inc, Analysis and diagnosis of connectivity in a
multi-device network. U.S. Patent Application 14/790,865, 2016.
[8] C., Tian, SNMP for Common Lisp. arXiv preprint arXiv:1705.08708, 2017.
[9] R., Govindan, I., Minei, M., Kallahalla, B., Koley, and A., Vahdat, Evolve or die: High-availability
design principles drawn from googles network infrastructure. In Proceedings of the 2016 ACM
SIGCOMM Conference (pp. 58-72). ACM ,2016,August.
[10] O., Santos, Network Security with NetFlow and IPFIX: Big Data Analytics for Information Security.
Cisco Press, 2015.
9ANALYSING A NETWORK MANAGEMENT TOOL
[11] J., Hernantes, G., Gallardo, and N., Serrano, I infrastructure-monitoring tools. IEEE
Software, 32(4), pp.88-93, 2015.
[12] G.M., Panozzo, O., Rubin, K., Mooney, S., Bytnar and Z., Cai, Panduit Corp, Network
infrastructure management. U.S. Patent 9,762,447, 2017.
[13] A. , Aeri and S., Tukadiya, A comparative study of network based system log management tools.
In 2015 International Conference on Computer Communication and Informatics (ICCCI) (pp. 1-6).
IEEE, 2015,January.
[14] K., Flanagan, E., Fallon, A., Awad, and P., Connolly, February. Self-configuring NetFlow anomaly
detection using cluster density analysis. In 2017 19th International Conference on Advanced
Communication Technology (ICACT) (pp. 421-427). IEEE, 2017.
1 out of 10
Related Documents
Your All-in-One AI-Powered Toolkit for Academic Success.
+13062052269
info@desklib.com
Available 24*7 on WhatsApp / Email
![[object Object]](/_next/static/media/star-bottom.7253800d.svg)
Unlock your academic potential
© 2024 | Zucol Services PVT LTD | All rights reserved.


