Report: Analyzing Germany's Stationary Market Data and Trends
VerifiedAdded on 2020/09/17
|14
|3045
|29
Report
AI Summary
This report provides a comprehensive analysis of the German stationary market, focusing on trends, sales data, and market predictions. The report begins with an introduction to the stationary business in Germany, highlighting its growth and the application of various analytical techniques. Task 1 examines the trends in the German stationary market, analyzing the number of firms and the market's position within Europe. Task 2 identifies key countries based on sales value. Task 3 delves into sales data from 2015 to 2017, including pie charts and correlation coefficient analysis, along with predictions based on trend lines. Task 4 presents a table of pros and cons and discusses the application of international standards like ISO. Task 5 focuses on calculating monthly costs. Task 6 explores confidence intervals. Task 7 offers recommendations for improvement and descriptive statistics. The report concludes with a summary of the findings and references. The analysis uses statistical tools to interpret data and forecast future trends, providing valuable insights into the market's dynamics and potential investment opportunities.
ANALYSING INFORMATION & DATA
FOR PROBLEM SOLVING
FOR PROBLEM SOLVING
Paraphrase This Document
Need a fresh take? Get an instant paraphrase of this document with our AI Paraphraser
TABLE OF CONTENTS
INTRODUCTION...........................................................................................................................3
TASK 1............................................................................................................................................3
Trends in Germany stationary market..........................................................................................3
TASK 2............................................................................................................................................4
TASK 3............................................................................................................................................5
(a) Total sales value of products from 2015 to 2017...................................................................5
(b) Pie chart for sales amid of 2016 and 2017 product-wise......................................................6
C. Correlation coefficient:...........................................................................................................6
(d) Making prediction on basis of trend line................................................................................8
TASK 4............................................................................................................................................9
(a)Completion of table.................................................................................................................9
(b)International standard applied to the firm business.................................................................9
TASK 5..........................................................................................................................................10
(a)Monthly cost by considering year.........................................................................................10
(b)Monthly cost by considering month......................................................................................11
TASK 6.........................................................................................................................................11
Confidence interval....................................................................................................................11
TASK 7 ........................................................................................................................................12
(a)Recommendation to improve situation..................................................................................12
(b)Descriptive statistics..............................................................................................................12
CONCLUSION..............................................................................................................................13
REFERENCE.................................................................................................................................13
INTRODUCTION
Stationary business is the one of the growing business in Germany. Number of business
firms in stationary business are growing at rapid rate which are producing scales, pencil,
sharpeners and many other stationary items. In the current report stationary business is analyzed
across varied EU nations. Correlation and trend line like techniques are applied on data-set and
meaningful interpretations are made. Correlation results reflect that with increase in year in
positive manner sales value of stationary also increase at rapid rate. Trend analysis results reflect
that in upcoming time period sales value will increase at rapid pace Means that in future time
period sales of stationary products will increase in rapid pace as same thing is reflected by both
correlation and trend analysis. At end of the report, descriptive statistics are applied and
comparison between variables are made. By forming conclusion research work is completed in
the report.
TASK 1
Trends in Germany stationary market
Figure 1Wholesale stationary business in Germany
Interpretation
3 | P a g e
⊘ This is a preview!⊘
Do you want full access?
Subscribe today to unlock all pages.
Trusted by 1+ million students worldwide
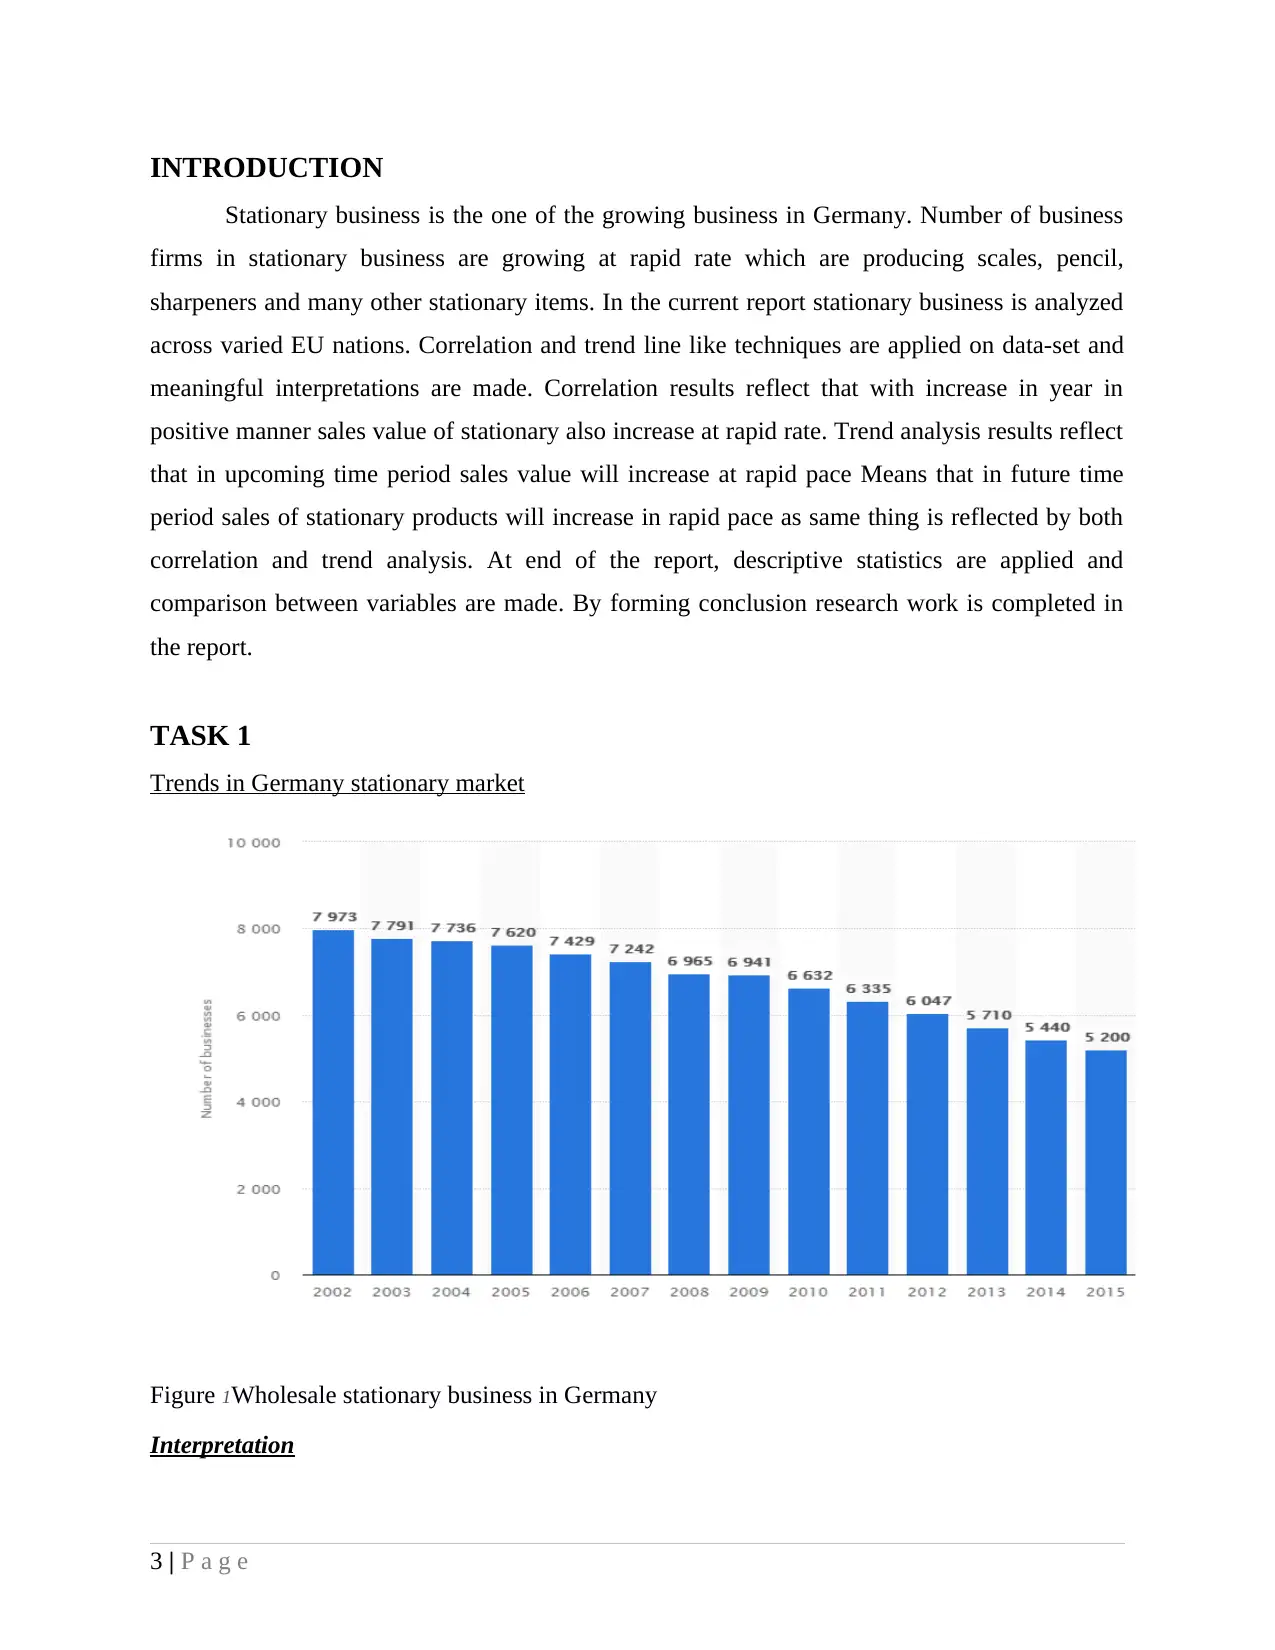
The above chart is demonstrating that there was large number of firms that were
operating in the stationary business in Germany. 1,2, 3 are reflecting years in the above given
chart. Earlier these numbers was 7973 which comes down to 5300 and on this basis it can be
deduced that now less number of firms are operating in stationary business (International
suppliers, 2017). Post-recession trend was begin but after 2008 decline happened at rapid pace in
number of firms that are in stationary business. This also indicates that to some extent
competition get reduced in the market. On basis of results it can be said that in future time period
the number of firms may decline in the industry which will prove good for the company as
number of competitors may be reduced. In next five to ten years if same trend continue firm may
become benefit to large extent. Out of all the spending made by the European nations in drawing
and writing material, second position was secured by the German market.
Yes decline in a use of paper is very beneficial from the environment point of view. As the
advancements are evolving and each and every sector of the organisation it is very beneficial for
the companies to use digital method for transferring and receiving information rather than paper.
Out of all the spending made by the European nations in drawing and writing material, second
position was secured by the German market. As technologies are increasing at a rapid speed
demand for digital products are much more higher than of stationary products, because digital
methods provides easy way for completing the task in a more effective manner.
TASK 2
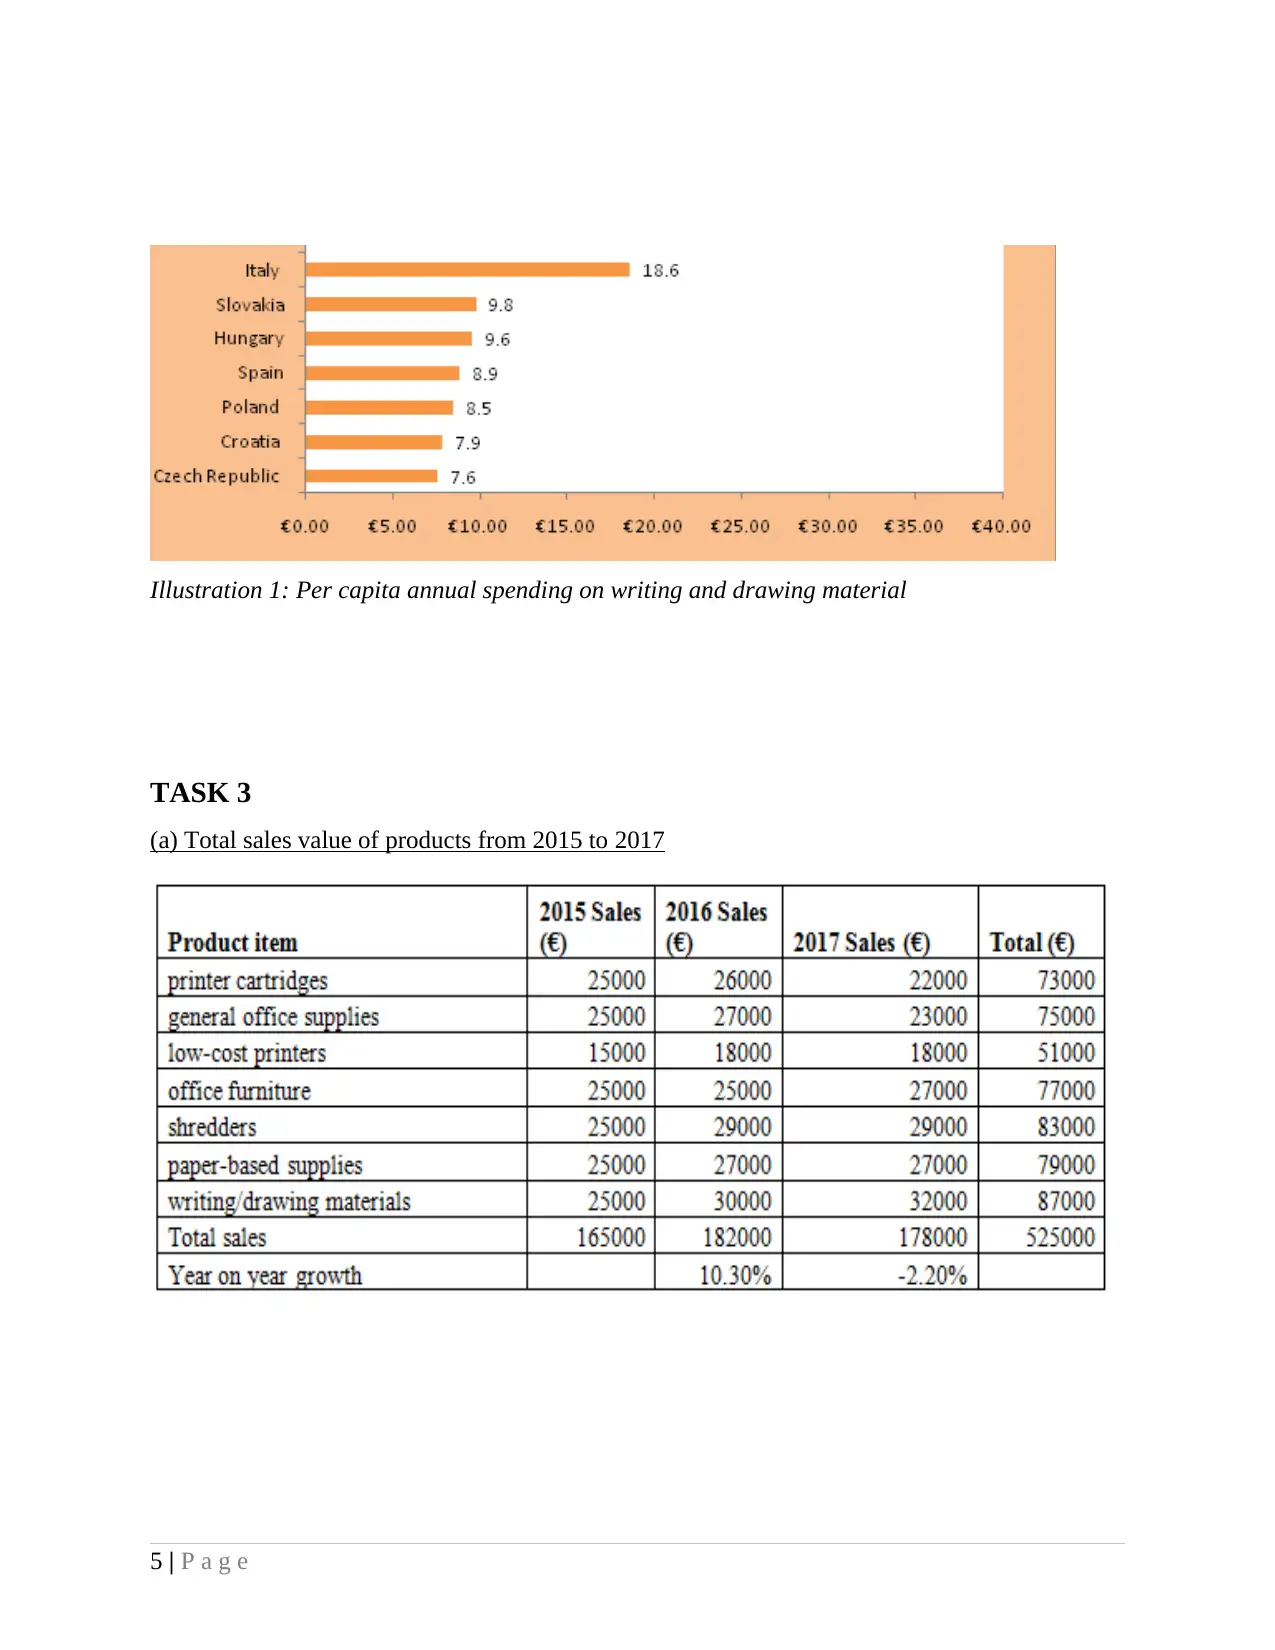
On basis of chart that is given varied things can be observed like Germany and
Switzerland are the two countries where demand is on peak and due to this reason value of sales
is also greater then other nations that are in the chart. It can be seen that after Germany and
Switzerland country where sales value is high is Romania. Apart from these nations Poland,
France and Italy are the nations that comes in fourth, fifth and sixth position in the market. Thus,
it can concluded that in two EU nations which are Germany and Switzerland higher amount of
sales is made. In Germany usually students spend 300 Euro of amount on purchasing varied
items of stationary. For education purpose number of foreign people comes in mentioned nation
every year. Hence, per capita expenditure on stationary may further increase
4 | P a g e
operating in the stationary business in Germany. 1,2, 3 are reflecting years in the above given
chart. Earlier these numbers was 7973 which comes down to 5300 and on this basis it can be
deduced that now less number of firms are operating in stationary business (International
suppliers, 2017). Post-recession trend was begin but after 2008 decline happened at rapid pace in
number of firms that are in stationary business. This also indicates that to some extent
competition get reduced in the market. On basis of results it can be said that in future time period
the number of firms may decline in the industry which will prove good for the company as
number of competitors may be reduced. In next five to ten years if same trend continue firm may
become benefit to large extent. Out of all the spending made by the European nations in drawing
and writing material, second position was secured by the German market.
Yes decline in a use of paper is very beneficial from the environment point of view. As the
advancements are evolving and each and every sector of the organisation it is very beneficial for
the companies to use digital method for transferring and receiving information rather than paper.
Out of all the spending made by the European nations in drawing and writing material, second
position was secured by the German market. As technologies are increasing at a rapid speed
demand for digital products are much more higher than of stationary products, because digital
methods provides easy way for completing the task in a more effective manner.
TASK 2
On basis of chart that is given varied things can be observed like Germany and
Switzerland are the two countries where demand is on peak and due to this reason value of sales
is also greater then other nations that are in the chart. It can be seen that after Germany and
Switzerland country where sales value is high is Romania. Apart from these nations Poland,
France and Italy are the nations that comes in fourth, fifth and sixth position in the market. Thus,
it can concluded that in two EU nations which are Germany and Switzerland higher amount of
sales is made. In Germany usually students spend 300 Euro of amount on purchasing varied
items of stationary. For education purpose number of foreign people comes in mentioned nation
every year. Hence, per capita expenditure on stationary may further increase
4 | P a g e
Paraphrase This Document
Need a fresh take? Get an instant paraphrase of this document with our AI Paraphraser
TASK 3
(a) Total sales value of products from 2015 to 2017
5 | P a g e
Illustration 1: Per capita annual spending on writing and drawing material
(a) Total sales value of products from 2015 to 2017
5 | P a g e
Illustration 1: Per capita annual spending on writing and drawing material
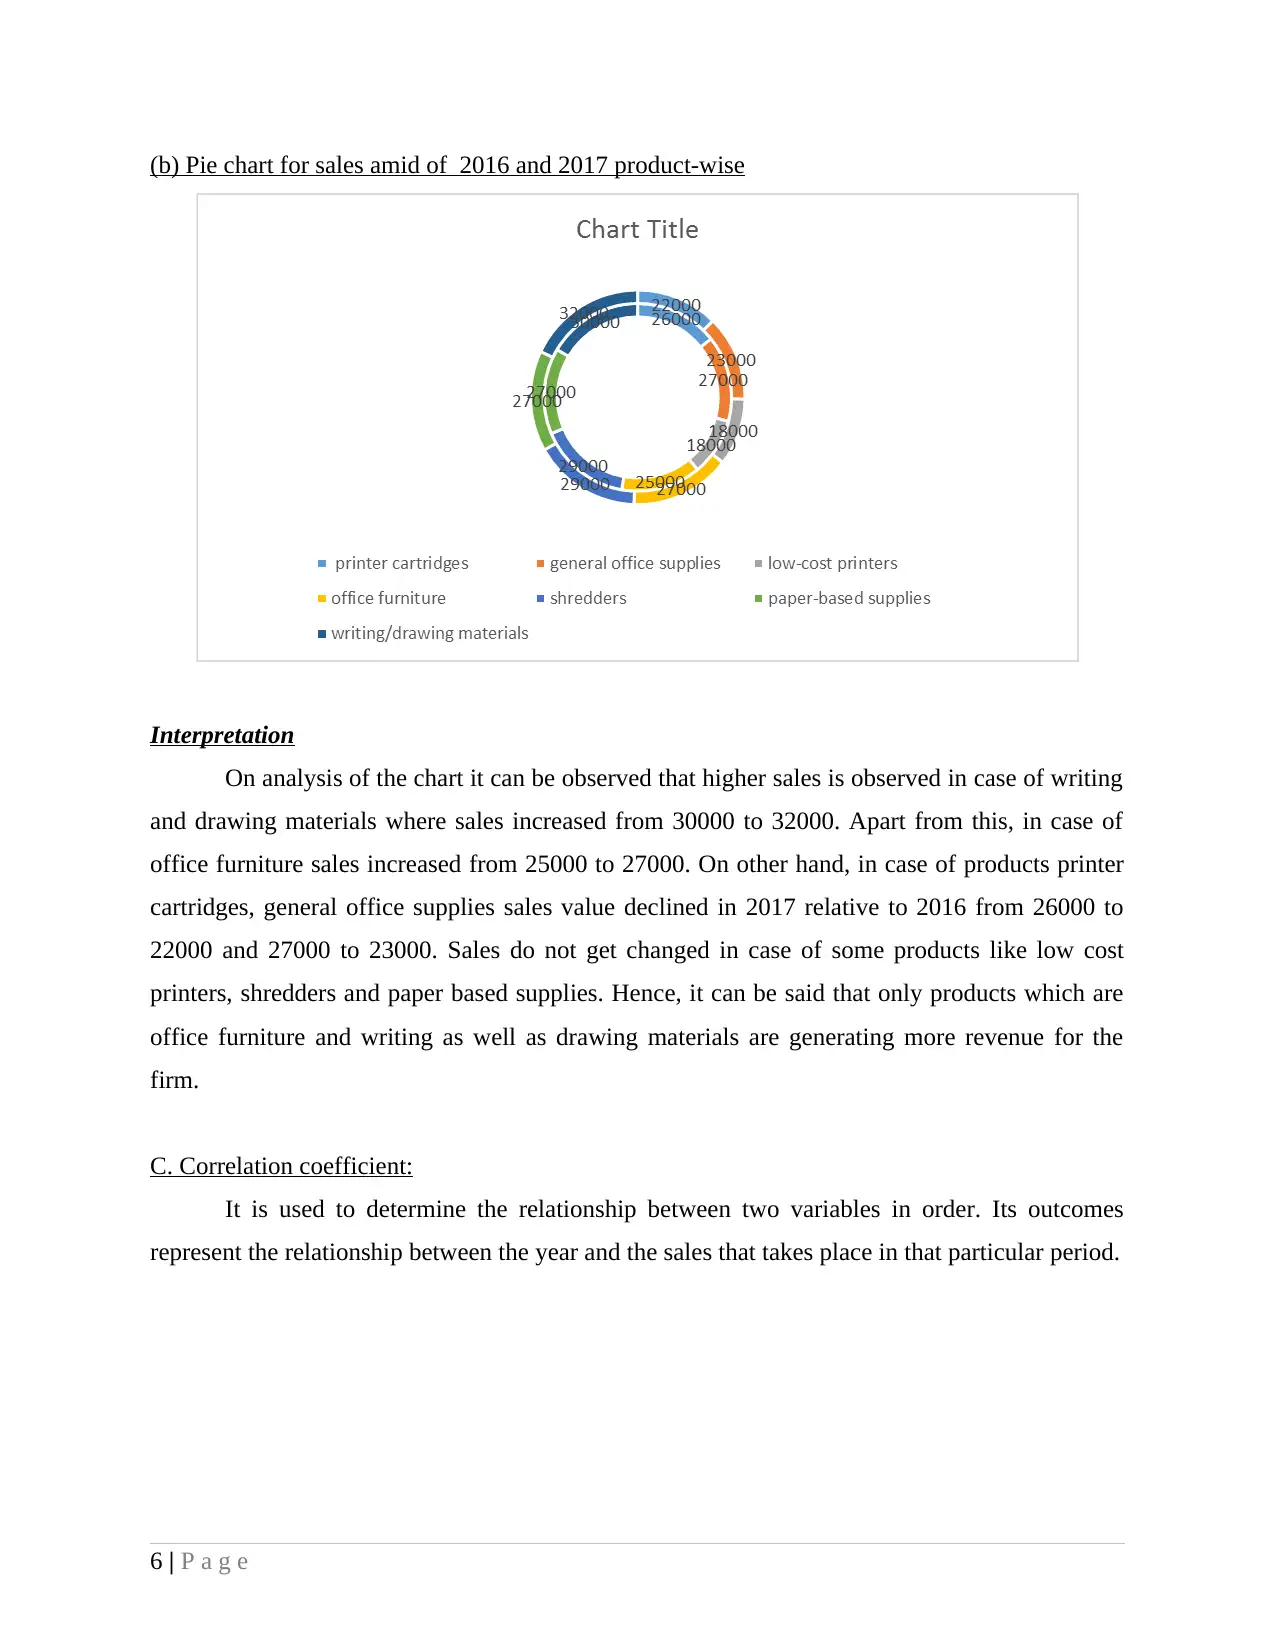
(b) Pie chart for sales amid of 2016 and 2017 product-wise
Interpretation
On analysis of the chart it can be observed that higher sales is observed in case of writing
and drawing materials where sales increased from 30000 to 32000. Apart from this, in case of
office furniture sales increased from 25000 to 27000. On other hand, in case of products printer
cartridges, general office supplies sales value declined in 2017 relative to 2016 from 26000 to
22000 and 27000 to 23000. Sales do not get changed in case of some products like low cost
printers, shredders and paper based supplies. Hence, it can be said that only products which are
office furniture and writing as well as drawing materials are generating more revenue for the
firm.
C. Correlation coefficient:
It is used to determine the relationship between two variables in order. Its outcomes
represent the relationship between the year and the sales that takes place in that particular period.
6 | P a g e
⊘ This is a preview!⊘
Do you want full access?
Subscribe today to unlock all pages.
Trusted by 1+ million students worldwide
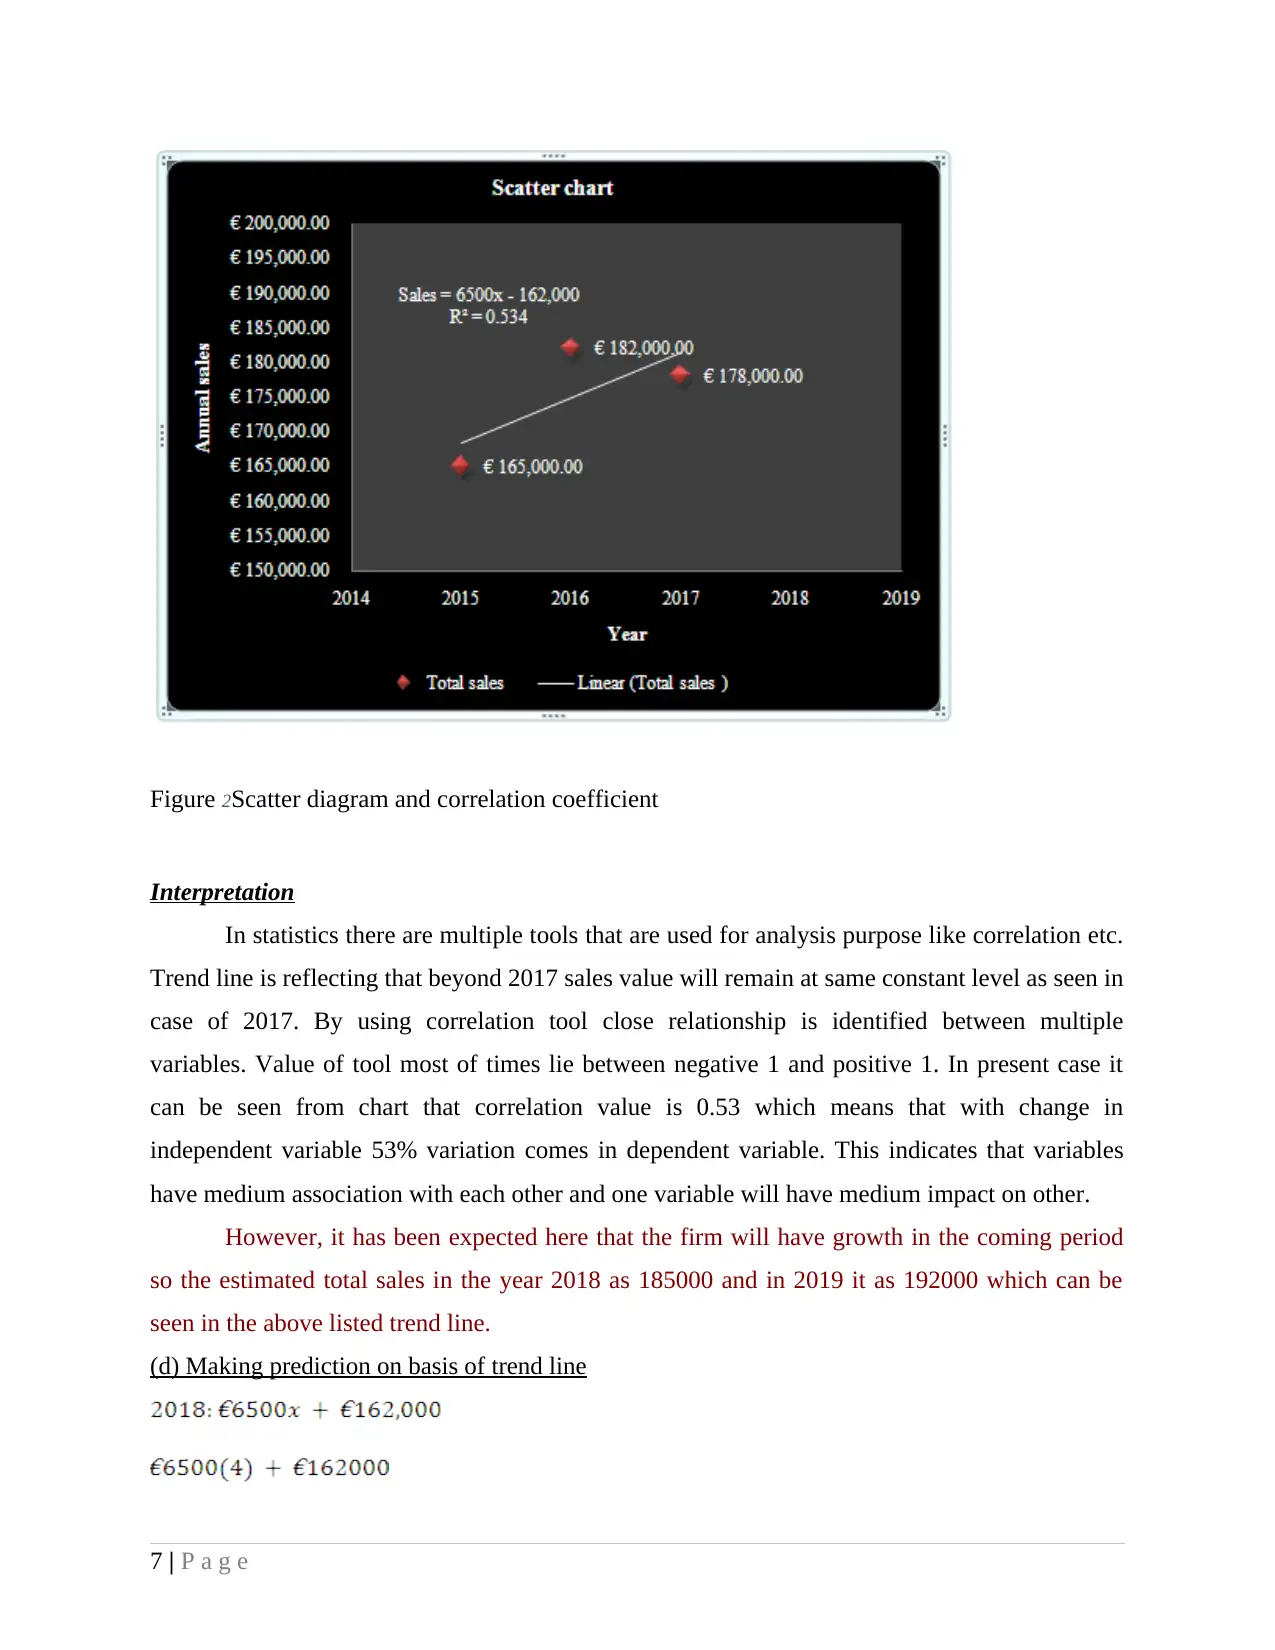
Figure 2Scatter diagram and correlation coefficient
Interpretation
In statistics there are multiple tools that are used for analysis purpose like correlation etc.
Trend line is reflecting that beyond 2017 sales value will remain at same constant level as seen in
case of 2017. By using correlation tool close relationship is identified between multiple
variables. Value of tool most of times lie between negative 1 and positive 1. In present case it
can be seen from chart that correlation value is 0.53 which means that with change in
independent variable 53% variation comes in dependent variable. This indicates that variables
have medium association with each other and one variable will have medium impact on other.
However, it has been expected here that the firm will have growth in the coming period
so the estimated total sales in the year 2018 as 185000 and in 2019 it as 192000 which can be
seen in the above listed trend line.
(d) Making prediction on basis of trend line
7 | P a g e
Paraphrase This Document
Need a fresh take? Get an instant paraphrase of this document with our AI Paraphraser
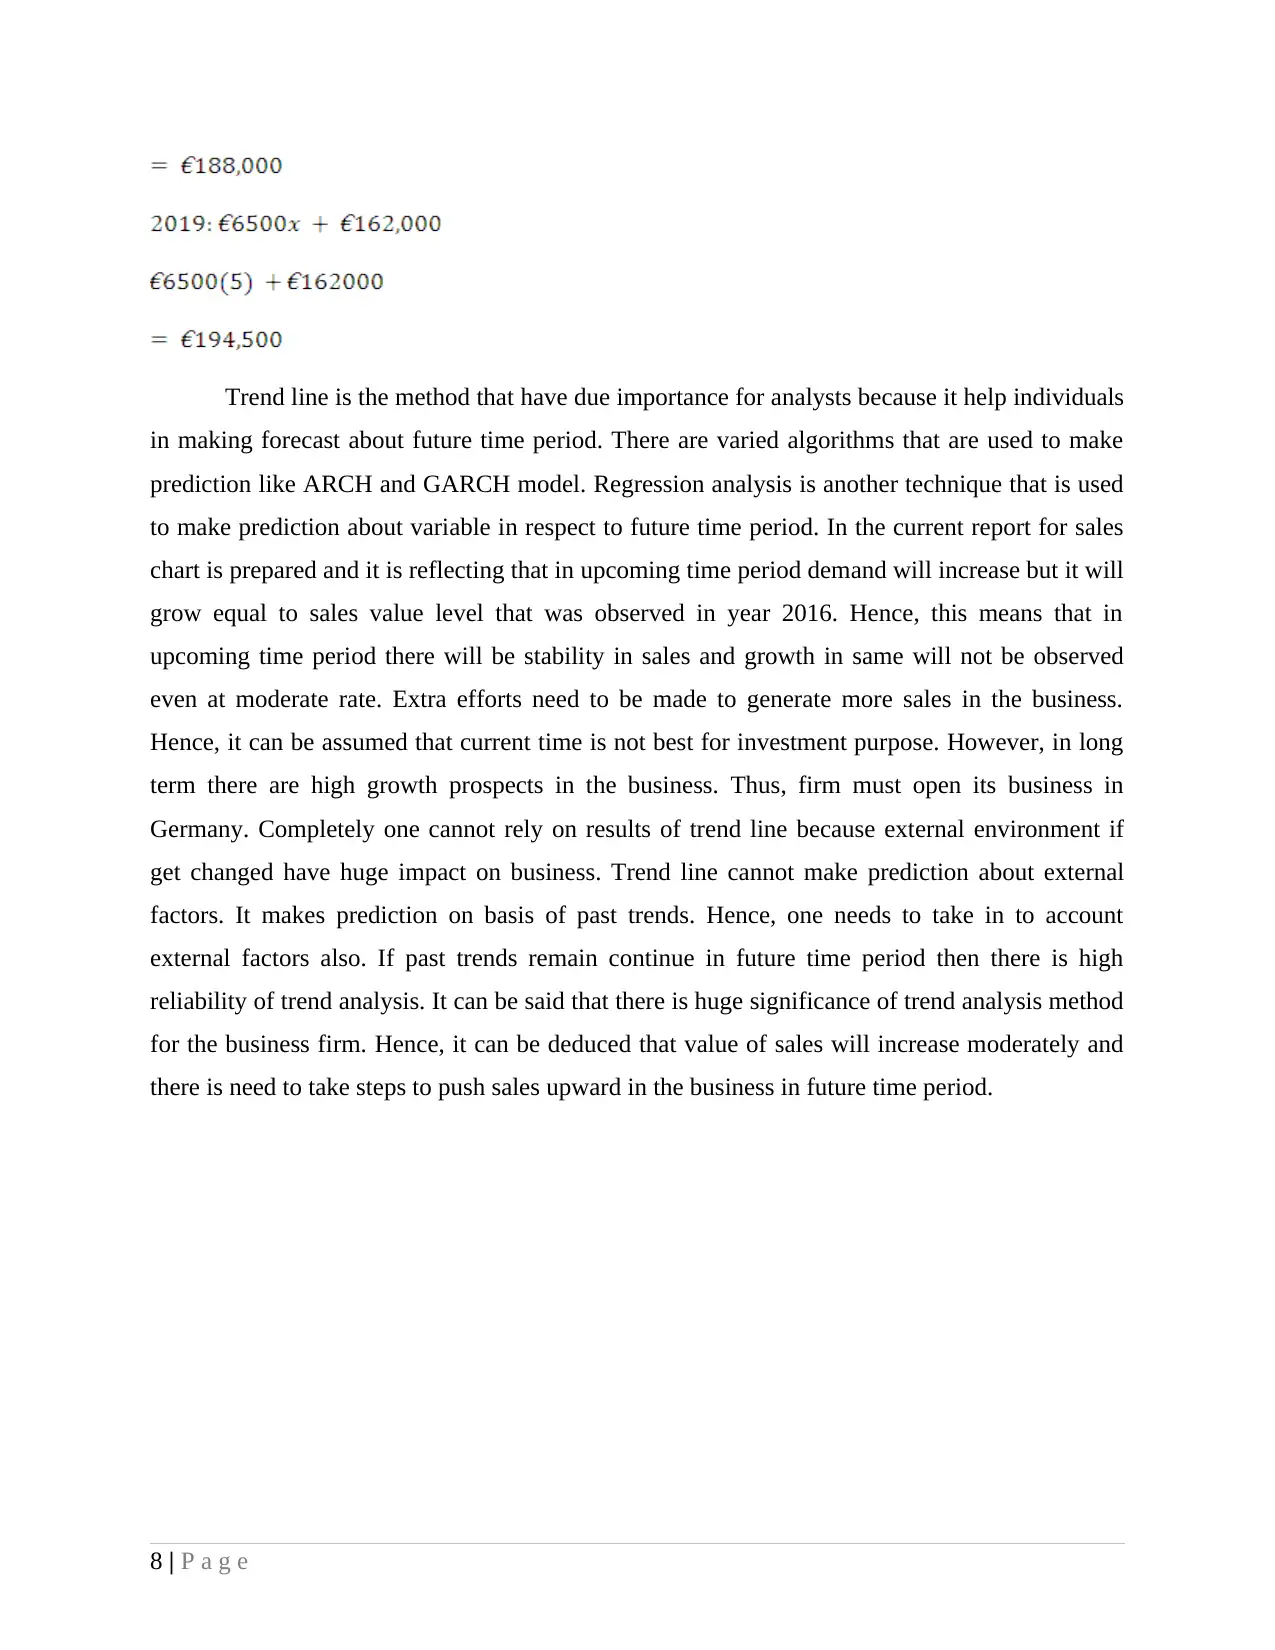
Trend line is the method that have due importance for analysts because it help individuals
in making forecast about future time period. There are varied algorithms that are used to make
prediction like ARCH and GARCH model. Regression analysis is another technique that is used
to make prediction about variable in respect to future time period. In the current report for sales
chart is prepared and it is reflecting that in upcoming time period demand will increase but it will
grow equal to sales value level that was observed in year 2016. Hence, this means that in
upcoming time period there will be stability in sales and growth in same will not be observed
even at moderate rate. Extra efforts need to be made to generate more sales in the business.
Hence, it can be assumed that current time is not best for investment purpose. However, in long
term there are high growth prospects in the business. Thus, firm must open its business in
Germany. Completely one cannot rely on results of trend line because external environment if
get changed have huge impact on business. Trend line cannot make prediction about external
factors. It makes prediction on basis of past trends. Hence, one needs to take in to account
external factors also. If past trends remain continue in future time period then there is high
reliability of trend analysis. It can be said that there is huge significance of trend analysis method
for the business firm. Hence, it can be deduced that value of sales will increase moderately and
there is need to take steps to push sales upward in the business in future time period.
8 | P a g e
TASK 4
(a)Completion of table
Pros Score/10 Cons Score/10
Facts are revealing that currently
economic growth rate in
increasing in Germany and due to
this reason assumption can be
made that in future time period
demand for stationary products
will enhance.
10 Numbers of companies in
stationary business are high.
Hence, it is hard to earn sufficient
amount of margin in the business.
6
With passage of time period total
numbers of firms that are in
stationary business are decreasing.
This reflects that competition to
some extent become soften
(Bendat and Piersol, 2011).
9 A product production cost is high
and due to this reason it is hard to
earn large amount of profit in
stationary business. Hence, major
challenging task is to increase
number of customers in the
business.
5
On other hand, population in
Germany is increasing and this is
the reason because of which it is
assumed that in upcoming time
period demand of stationary
products will enhance.
The organisation will expand its
function into international market
8 If the organisation wants to
expand their business functions
into international market, they will
require the whole information
regarding the working of the
market, highly skilled staff to
meet the requirements of the
global business.
5
Total pros 27 Total cons 17
Average pros 3 Average cons 3
(b)International standard applied to the firm business
In current time period ISO standards are commonly prepared for each and every aspect of
the product. Product quality is one of the factors to which people give due importance and in this
regard if certain conditions are satisfied ISO mark is assigned to product which reflect that item
is good for the customers (International Organization for Standardization, 2017). In present case
also ISO standard is applied on the company and it can be identified that in this regard there are
varied parameters related to quality that if satisfied ISO certificate is issued by relevant authority.
9 | P a g e
⊘ This is a preview!⊘
Do you want full access?
Subscribe today to unlock all pages.
Trusted by 1+ million students worldwide
ISO/TC 131/SC 8 is known as standard of product testing that apply on the company in respect
to testing of products. If company is following all relevant process that must be performed in
respect to testing of product then in that case ISO standard is issued by relevant authority to the
business firm. Data clearly tells that customers are becoming more quality conscious and firms
failed to make available that quality of product. Hence, failed to earn required amount of
revenue. Smaller firms need to upgrade their technology base and by doing so they can innovate
their products in proper manner
Environmental management: If the organisations want to practice business in the Europe they
must need to follow all the norms and regulations in order to practise their business functions in
a more effective manner.
Risk Management: It the measure that is used to regulate and handle all the possible factors that
can be harmful for the functions of the business organisation.
TASK 5
(a)Monthly cost by considering year
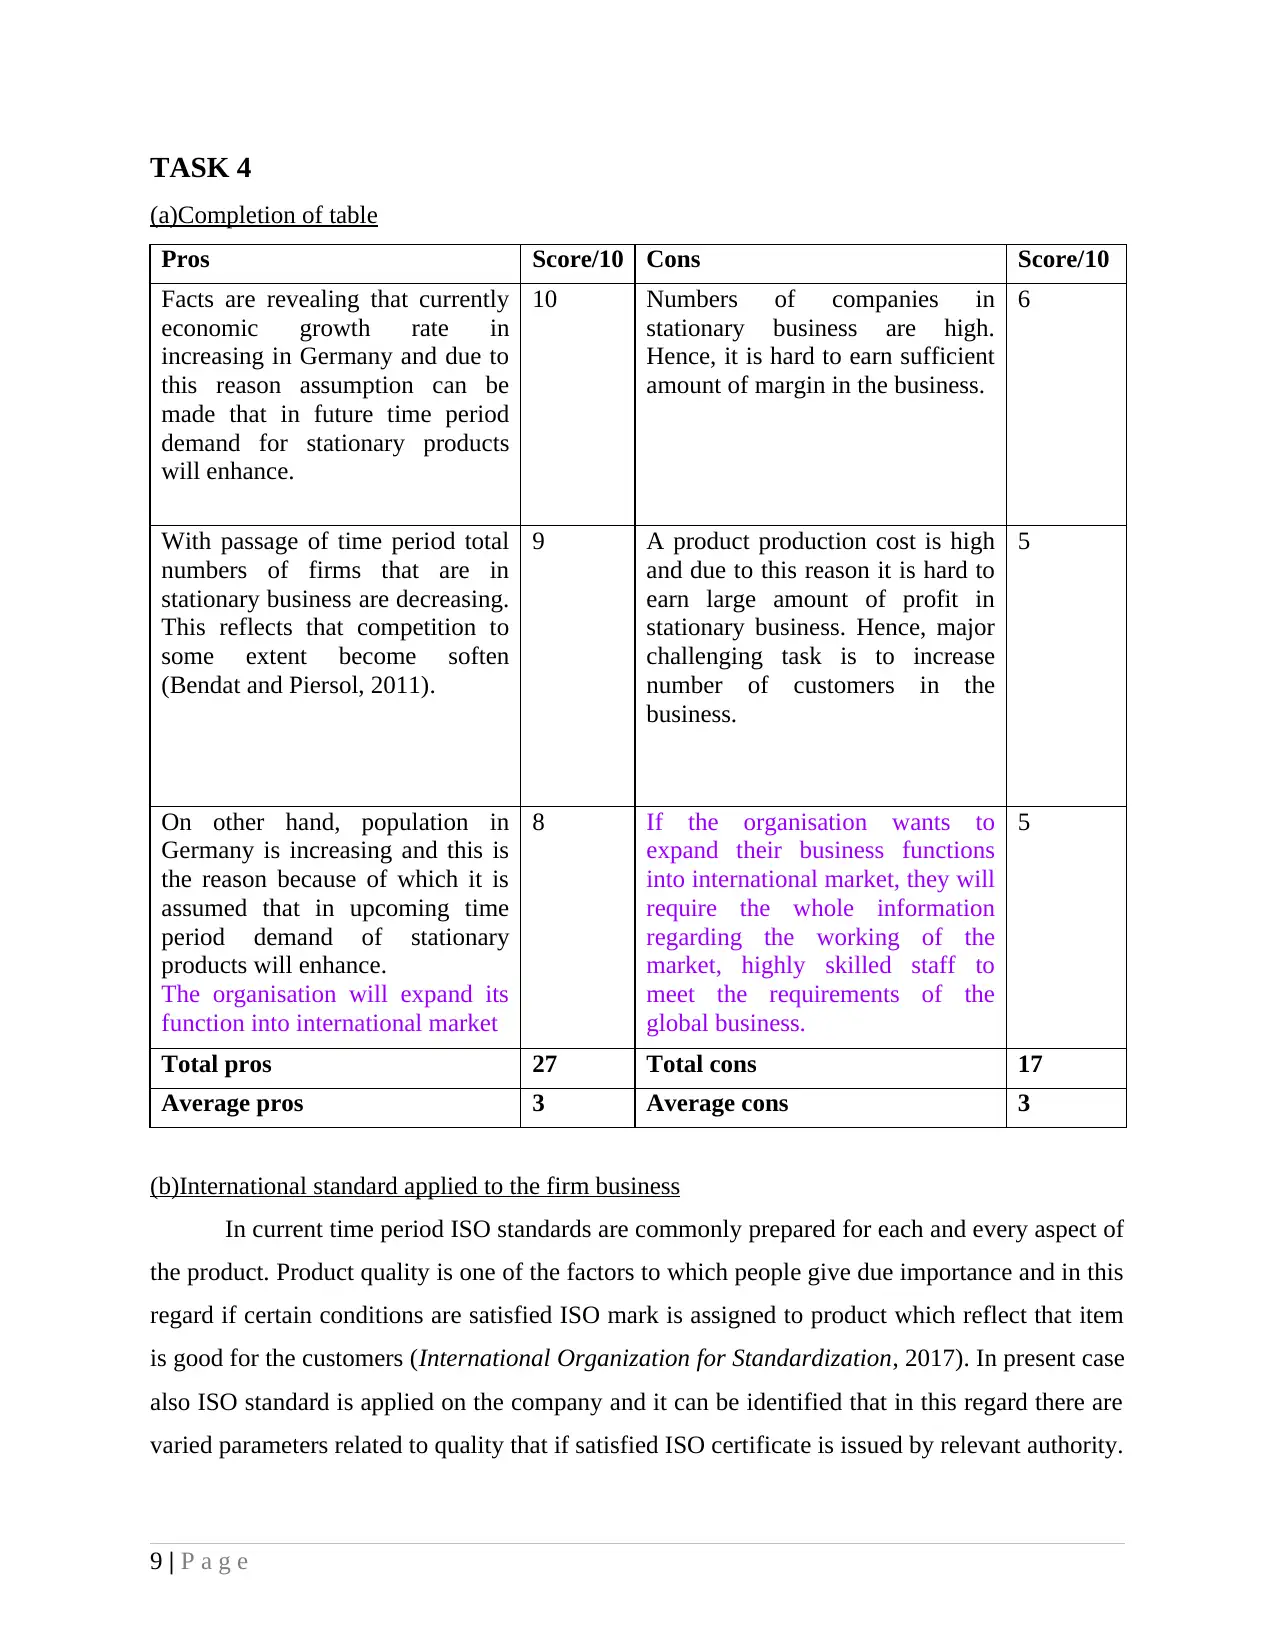
Figure Calculation of monthly cost
From table it can be observed that monthly cost is 611.11 and in this regard on yearly
amount interest amount is added and same is divided by 12. In this way monthly cost of 611.11
is computed.
10 | P a g e
to testing of products. If company is following all relevant process that must be performed in
respect to testing of product then in that case ISO standard is issued by relevant authority to the
business firm. Data clearly tells that customers are becoming more quality conscious and firms
failed to make available that quality of product. Hence, failed to earn required amount of
revenue. Smaller firms need to upgrade their technology base and by doing so they can innovate
their products in proper manner
Environmental management: If the organisations want to practice business in the Europe they
must need to follow all the norms and regulations in order to practise their business functions in
a more effective manner.
Risk Management: It the measure that is used to regulate and handle all the possible factors that
can be harmful for the functions of the business organisation.
TASK 5
(a)Monthly cost by considering year
Figure Calculation of monthly cost
From table it can be observed that monthly cost is 611.11 and in this regard on yearly
amount interest amount is added and same is divided by 12. In this way monthly cost of 611.11
is computed.
10 | P a g e
Paraphrase This Document
Need a fresh take? Get an instant paraphrase of this document with our AI Paraphraser
(b)Monthly cost by considering month
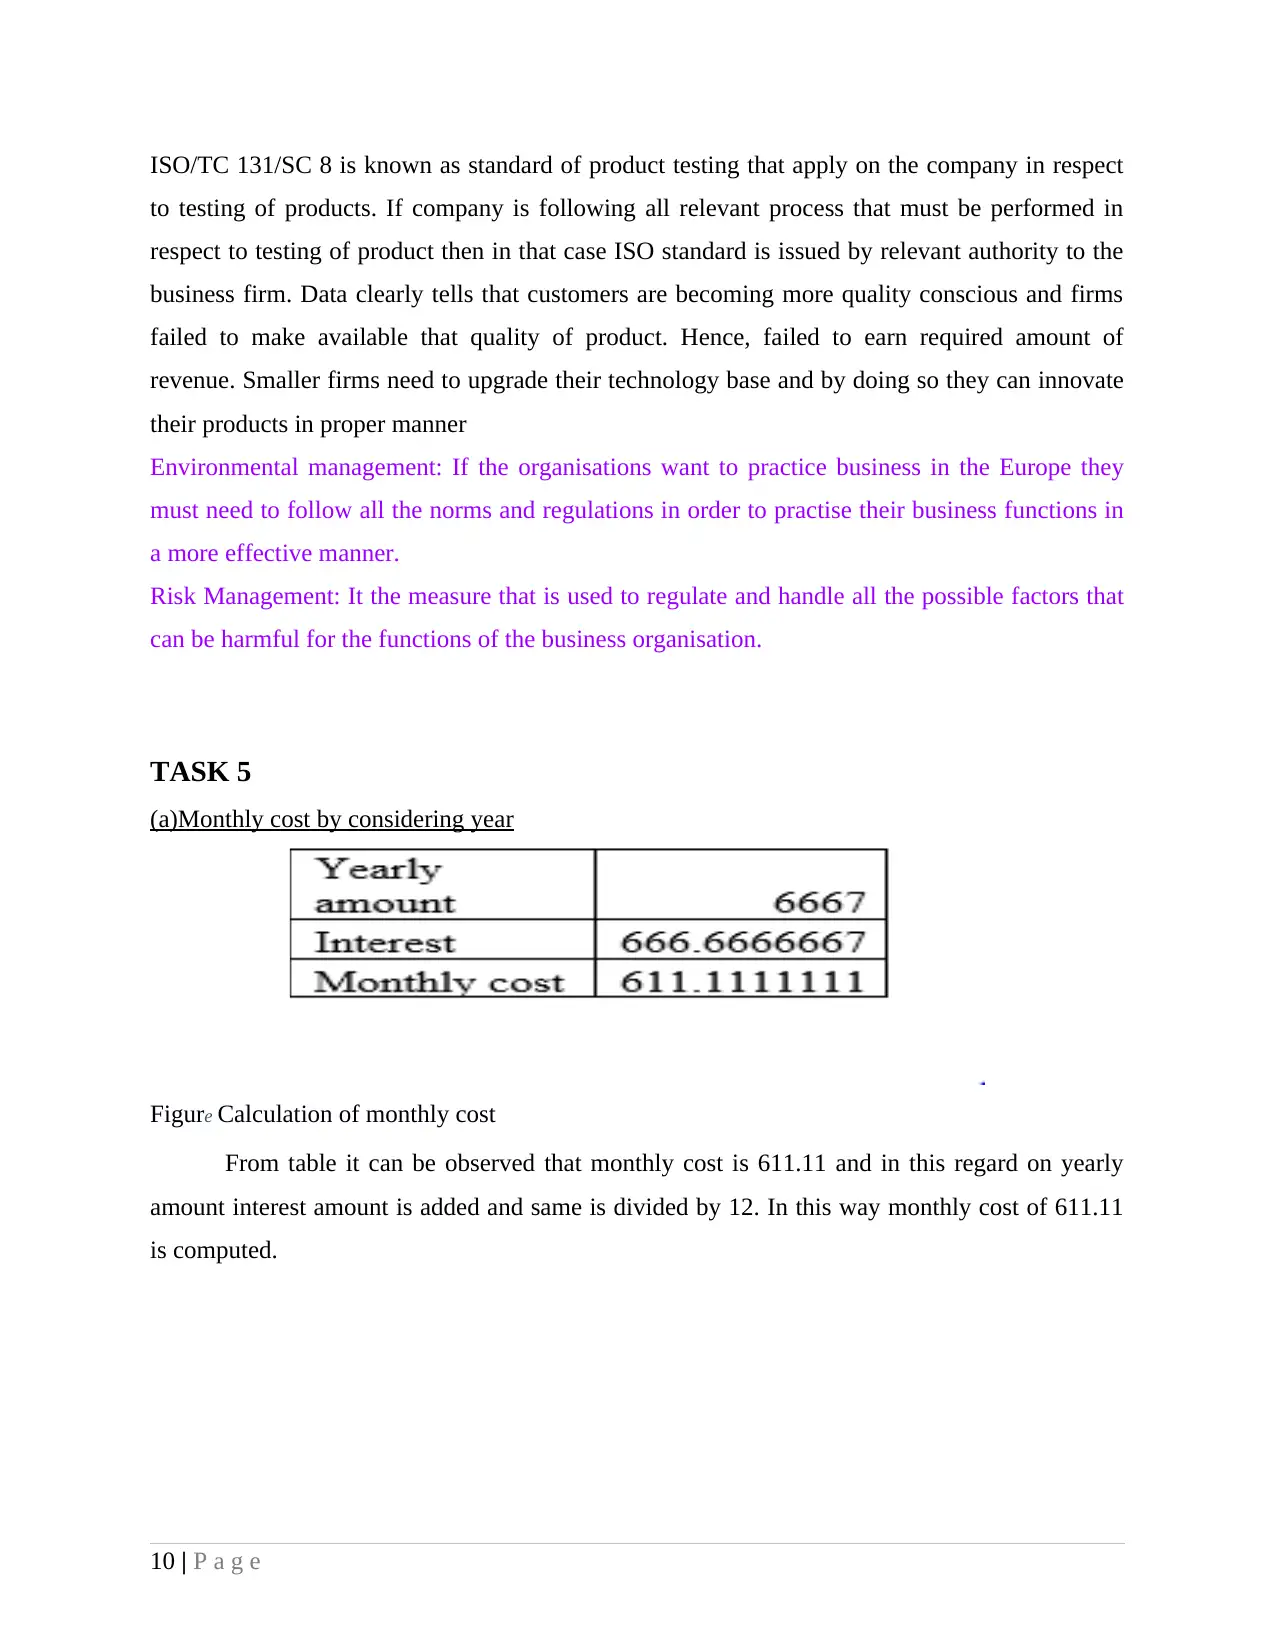
Figure 3Calculation of monthly cost by using 12 months’ time period
In the calculation performed it can be observed that first of all yearly amount is calculated and
then monthly amount is computed for which yearly amount division by 12 is done. Interest is
charged on monthly amount and added to monthly amount and in this way monthly cost is
computed.
TASK 6
Confidence interval
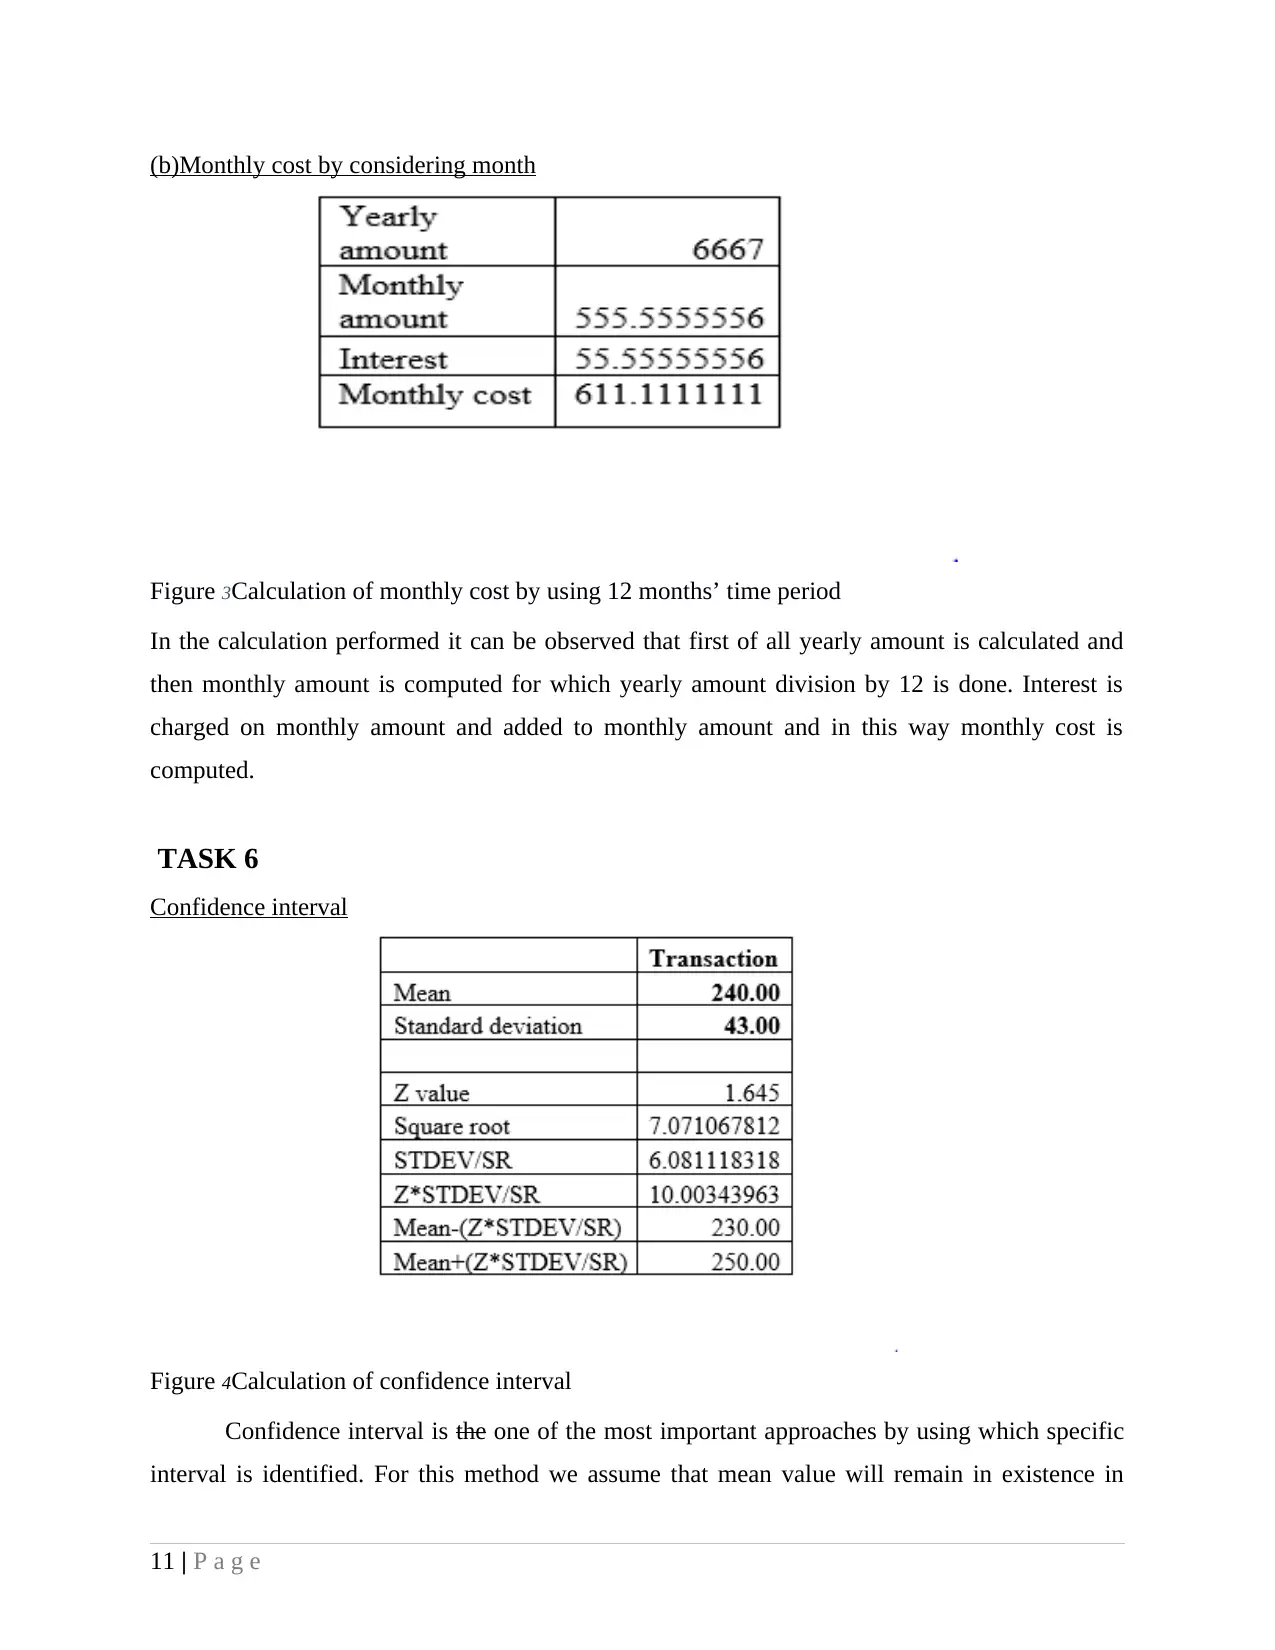
Figure 4Calculation of confidence interval
Confidence interval is the one of the most important approaches by using which specific
interval is identified. For this method we assume that mean value will remain in existence in
11 | P a g e
Figure 3Calculation of monthly cost by using 12 months’ time period
In the calculation performed it can be observed that first of all yearly amount is calculated and
then monthly amount is computed for which yearly amount division by 12 is done. Interest is
charged on monthly amount and added to monthly amount and in this way monthly cost is
computed.
TASK 6
Confidence interval
Figure 4Calculation of confidence interval
Confidence interval is the one of the most important approaches by using which specific
interval is identified. For this method we assume that mean value will remain in existence in
11 | P a g e
future up-to certain percentage confidence which may by 90%, 95% and 98% (Huber, 2011). In
the present case it is assumed that there are 95% chances that mean value will comes in
existence. If mean value 240 occur again in future time period then in that case value will lie in
range of confidence interval of 230 to 250. Means that it is assumed that average value of orders
received is 240. If it is assumed that same value will be observed most of times in future time
period then order value may be between 230 to 250 in the firm business. Means that firm overall
order value may be between 230 to 250. In the calculation process sample units in respect to
variable are taken in to account and square root of same is done. Value of confidence interval
percentage is taken in to account to compute upper and lower bound value.
TASK 7
(a)Recommendation to improve situation
A major problem is that most of respondents do not give back questionnaire by filling it.
In order to solve this problem researcher can send questionnaire only to those people to whom it
knows personally. If in any case one does not know individuals then in that case it can meet them
personally and can communicate them research topic importance. By doing so reliable answers
with filled questionnaire can be received from all respondents.
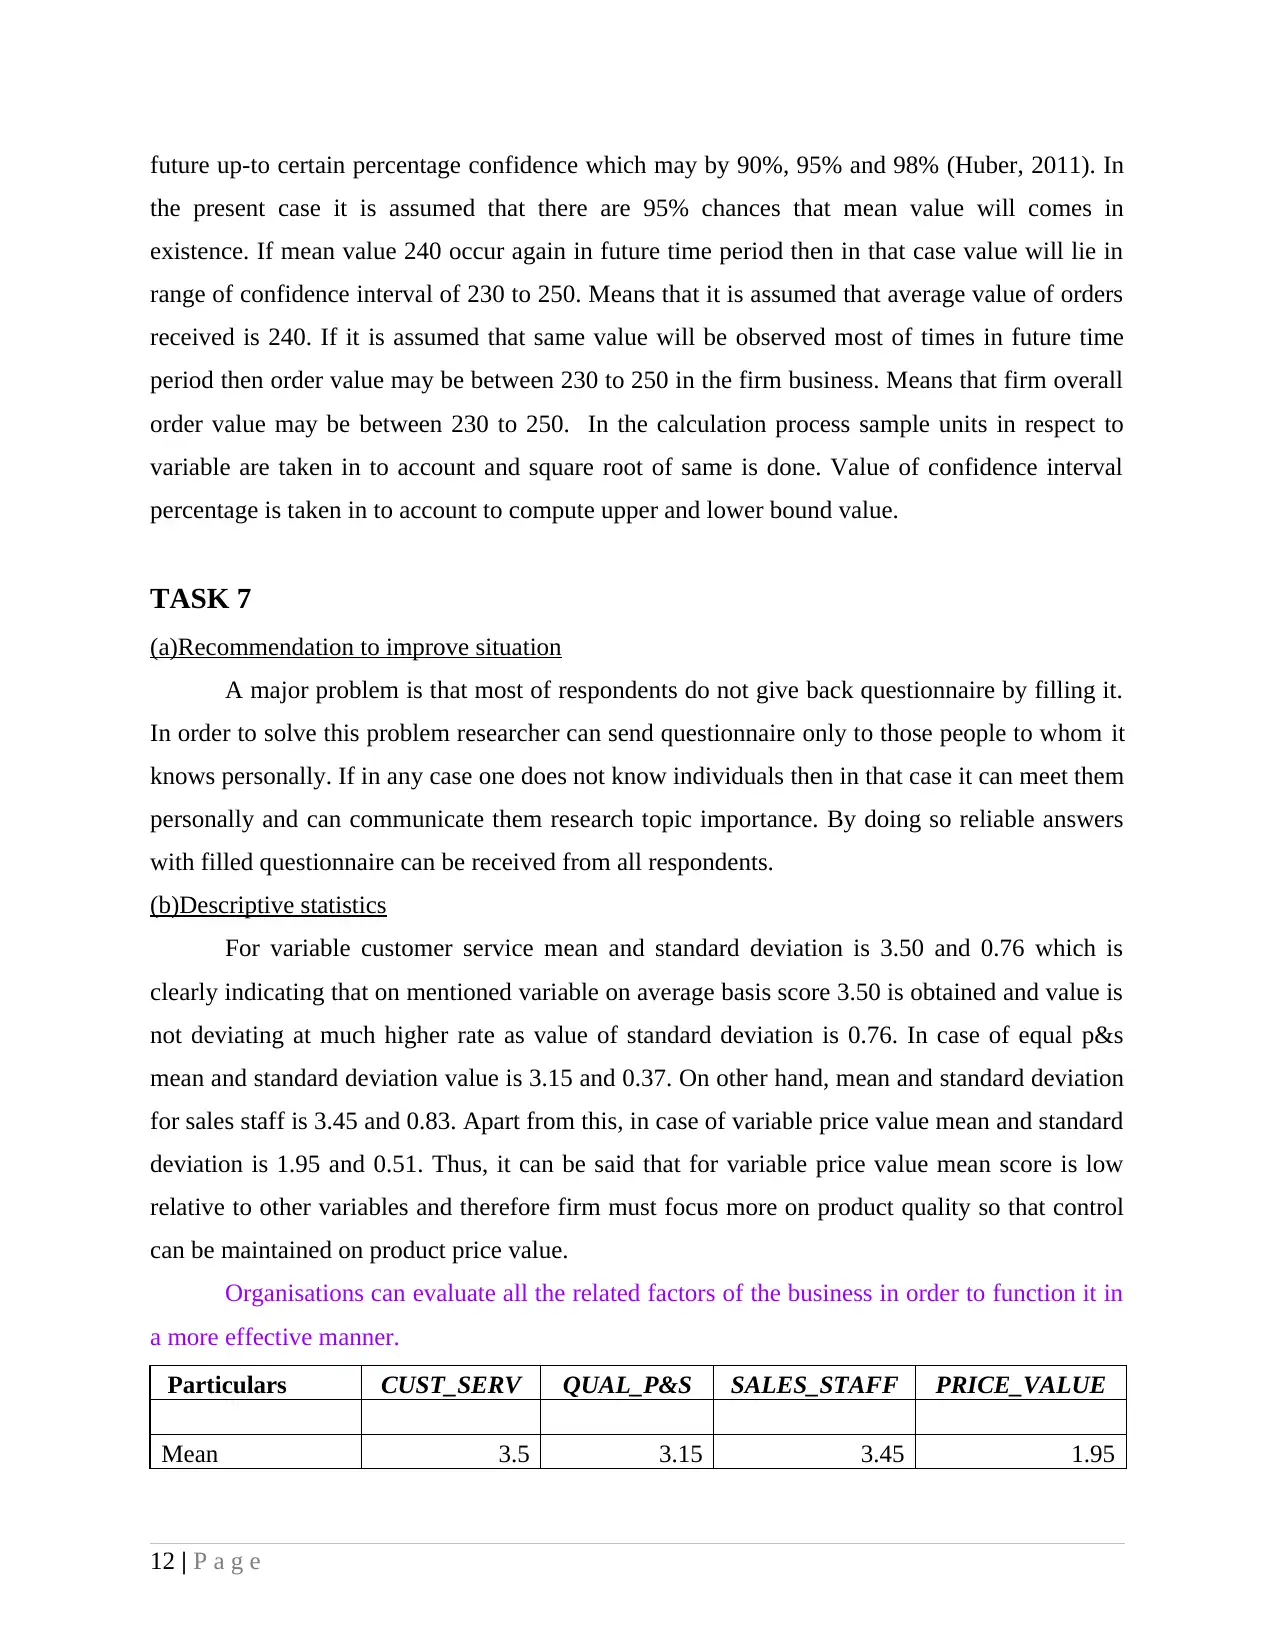
(b)Descriptive statistics
For variable customer service mean and standard deviation is 3.50 and 0.76 which is
clearly indicating that on mentioned variable on average basis score 3.50 is obtained and value is
not deviating at much higher rate as value of standard deviation is 0.76. In case of equal p&s
mean and standard deviation value is 3.15 and 0.37. On other hand, mean and standard deviation
for sales staff is 3.45 and 0.83. Apart from this, in case of variable price value mean and standard
deviation is 1.95 and 0.51. Thus, it can be said that for variable price value mean score is low
relative to other variables and therefore firm must focus more on product quality so that control
can be maintained on product price value.
Organisations can evaluate all the related factors of the business in order to function it in
a more effective manner.
Particulars CUST_SERV QUAL_P&S SALES_STAFF PRICE_VALUE
Mean 3.5 3.15 3.45 1.95
12 | P a g e
the present case it is assumed that there are 95% chances that mean value will comes in
existence. If mean value 240 occur again in future time period then in that case value will lie in
range of confidence interval of 230 to 250. Means that it is assumed that average value of orders
received is 240. If it is assumed that same value will be observed most of times in future time
period then order value may be between 230 to 250 in the firm business. Means that firm overall
order value may be between 230 to 250. In the calculation process sample units in respect to
variable are taken in to account and square root of same is done. Value of confidence interval
percentage is taken in to account to compute upper and lower bound value.
TASK 7
(a)Recommendation to improve situation
A major problem is that most of respondents do not give back questionnaire by filling it.
In order to solve this problem researcher can send questionnaire only to those people to whom it
knows personally. If in any case one does not know individuals then in that case it can meet them
personally and can communicate them research topic importance. By doing so reliable answers
with filled questionnaire can be received from all respondents.
(b)Descriptive statistics
For variable customer service mean and standard deviation is 3.50 and 0.76 which is
clearly indicating that on mentioned variable on average basis score 3.50 is obtained and value is
not deviating at much higher rate as value of standard deviation is 0.76. In case of equal p&s
mean and standard deviation value is 3.15 and 0.37. On other hand, mean and standard deviation
for sales staff is 3.45 and 0.83. Apart from this, in case of variable price value mean and standard
deviation is 1.95 and 0.51. Thus, it can be said that for variable price value mean score is low
relative to other variables and therefore firm must focus more on product quality so that control
can be maintained on product price value.
Organisations can evaluate all the related factors of the business in order to function it in
a more effective manner.
Particulars CUST_SERV QUAL_P&S SALES_STAFF PRICE_VALUE
Mean 3.5 3.15 3.45 1.95
12 | P a g e
⊘ This is a preview!⊘
Do you want full access?
Subscribe today to unlock all pages.
Trusted by 1+ million students worldwide
1 out of 14
Related Documents


Your All-in-One AI-Powered Toolkit for Academic Success.
+13062052269
info@desklib.com
Available 24*7 on WhatsApp / Email
![[object Object]](/_next/static/media/star-bottom.7253800d.svg)
Unlock your academic potential
Copyright © 2020–2026 A2Z Services. All Rights Reserved. Developed and managed by ZUCOL.