Ask a question from expert

Ask now

Statistical Influences Made by an Organisation

14 Pages2316 Words115 Views
   

Added on  2020-10-05

About This Document

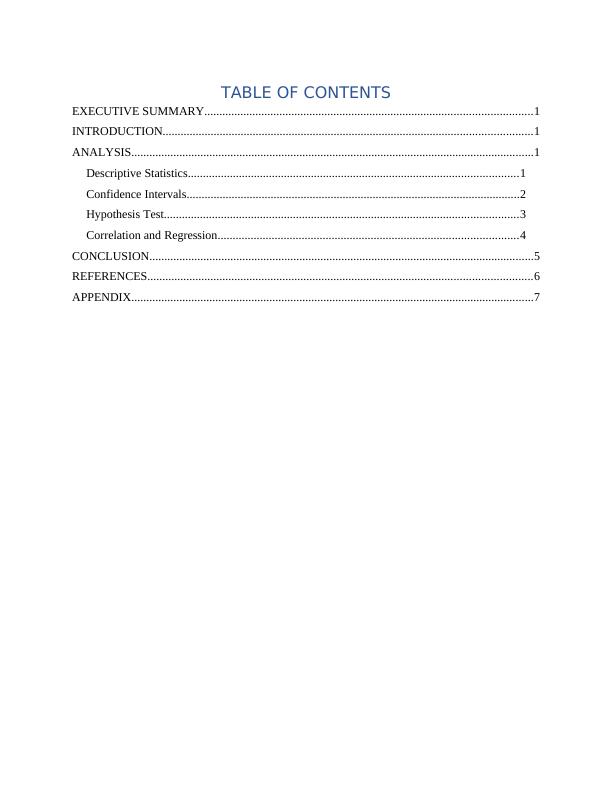
Report For A69209 TABLE OF CONTENTS EXECUTIVE SUMMARY1 INTRODUCTION 1 ANALYSIS 1 Confidence Intervals2 Hypothesis Test 3 Correlation and Regression Interval4 CONCLUSION Office 5 REFERENCES 6 APPENDIX 7 EXECUTIVE SUMMARY Statistical influences made by an organisation of governmental body is for analysing the large volume of data base. Moreover, there will be preparation of various data base based on calculations like Descriptive analysis, confidence intervals, hypothesis testing as well as correlation and regression measurements.

Statistical Influences Made by an Organisation

   Added on 2020-10-05

BookmarkShareRelated Documents
Report For A69209
Statistical Influences Made by an Organisation_1
TABLE OF CONTENTSEXECUTIVE SUMMARY.............................................................................................................1INTRODUCTION...........................................................................................................................1ANALYSIS......................................................................................................................................1Descriptive Statistics..............................................................................................................1Confidence Intervals...............................................................................................................2Hypothesis Test......................................................................................................................3Correlation and Regression....................................................................................................4CONCLUSION................................................................................................................................5REFERENCES................................................................................................................................6APPENDIX......................................................................................................................................7
Statistical Influences Made by an Organisation_2
EXECUTIVE SUMMARYStatistical influences made by an organisation of governmental body is for analysing thelarge volume of data base. Thus, to identify the main reasons behind variations in a variable.Thus, as analysis will be helpful in decision making and reaching to end outcomes. Moreover,there will be preparation of various data base based on calculations like Descriptive analysis,confidence intervals, hypothesis testing as well as correlation and regression measurements.INTRODUCTIONStatistical influences made by an organisation of governmental body is for analysing thelarge volume of data base. Thus, to identify the main reasons behind variations in a variable.Thus, as analysis will be helpful in decision making and reaching to end outcomes. However,there have been analysis of the statistic measurements considering the tools such as descriptivestatistics, confidence intervals, hypothesis testing and regression & correlation analysis. Thus,these are the analysis which will be helpful in making appropriate justification of the changes inthe outcomes. The theoretical analysis will help in better understanding and determination of thereasons behind such variation. Along with this, there will be creation of various hypothesiswhich in turn presents results for effective improvements.The present report is based on analysing qualitative information regrading changes in thecosts and sales volume of an organisation as per considering the sample size of 60. Therefore,there will be use of various statistical tools in determining the adequate outcomes and measuringall activities. Moreover, there will be preparation of various data base based on calculations likeDescriptive analysis, confidence intervals, hypothesis testing as well as correlation andregression measurements. Therefore, such analysis will help in making clear justificationregarding the factors which affects sales of the entity.ANALYSISDescriptive StatisticsImplication of this technique helps in making quantitative analysis of data base in amanageable form. There can be measurement on the large number of data set which will beanalysed and evaluated for better analysis of outcomes. Therefore, the large data set will besummarized in effective measures such as mean, mode median, standard deviation etc. whichbring accurate analysis of information that will be helpful in reaching to operational gains(Bethapudi and Desai, 2017).1
Statistical Influences Made by an Organisation_3
However, as per demonstrating the summary statistics of randomly selected 60 sampleswhere frequency analysis was made. Oder priority and variation in the outcomes of sales wasanalysed. Thus, mean of order priority had been addressed and analysed which have broughtmean value as 2.33. therefore, it is near to the medium and high quality of the products. Thus, inthis case it can be said that sales of various commodities on which medium quality of order hadbeen sold by entity. Mean value of sales has been analysed as $1,737.83 thus, there aremaximum volume of quantity had been sold by the entity is for $1737.83.On the other side, as per considering the median value of Order quantity which was 3 thatinsists that, in sample size of 60 there were high quality of orders were at higher rate ascompared with other quantities. In the same respect the median of sales had been analysed as$306.100. The mode of order priority which is 4and in sales the amount of sales as mode were$9.75. After analysing the Standard deviation in order priority had been analysed as 1.469 and insales the standard deviation of amount $3,107.69 respectively.Along aside, as per descriptive statistics of various elements which ascertains n as size of60 and range, mean, standard deviation, variance analysis, skewness and kurtosis were beingmeasured. There has been analysis of these measures on sales, region, order priority, quantity,ship mode, shipping cost, customer segmentation and days to shipment. However, in terms ofanalysing outcomes which represents that, the minimum amount of sales such as $9.75 was madeand the highest was $14,346.73. Moreover, in this case it can be said that there is an averageamount of sales such as $1,737.83 were made most often by business.Confidence IntervalsThis is a parameter of analysing the true value of data base as per ascertaining the observedstatistical data base. However, the confidence level determines with intervals that contain truevalue of unknown population parameters which can also being presented in the frequency of thedata base (Watson and English, 2017). Moreover, in analysing true value of the outcomes theseparameters do not necessary include true value. Thus, in relation with analysing the data basewith the influences of confidence level there will be consideration on two variables such as salesand Home Office Customers. In relation with analysing the validity of the data base there havebeen creation of two hypothesis such as:Null Hypothesis: There is no mean significant difference between sales and Home OfficeCustomers2
Statistical Influences Made by an Organisation_4

End of preview

Want to access all the pages? Upload your documents or become a member.

Related Documents
FIN60003 Business Modelling and Statistics
|29
|2946
|218

FIN10002 Financial Statistics
|16
|1975
|129

Analyzing Orders Data for Desklib Online Library
|24
|4294
|260

Assessment Report Taxation
|15
|2655
|86

FIN10002 Financial Statistics Assignment
|19
|2553
|358

Report on Statistics in Relation to Central Tendency and Dispersion of Data
|11
|533
|120