Household Data Analysis: A Statistical Exploration
VerifiedAdded on 2023/06/15
|11
|1509
|309
Homework Assignment
AI Summary
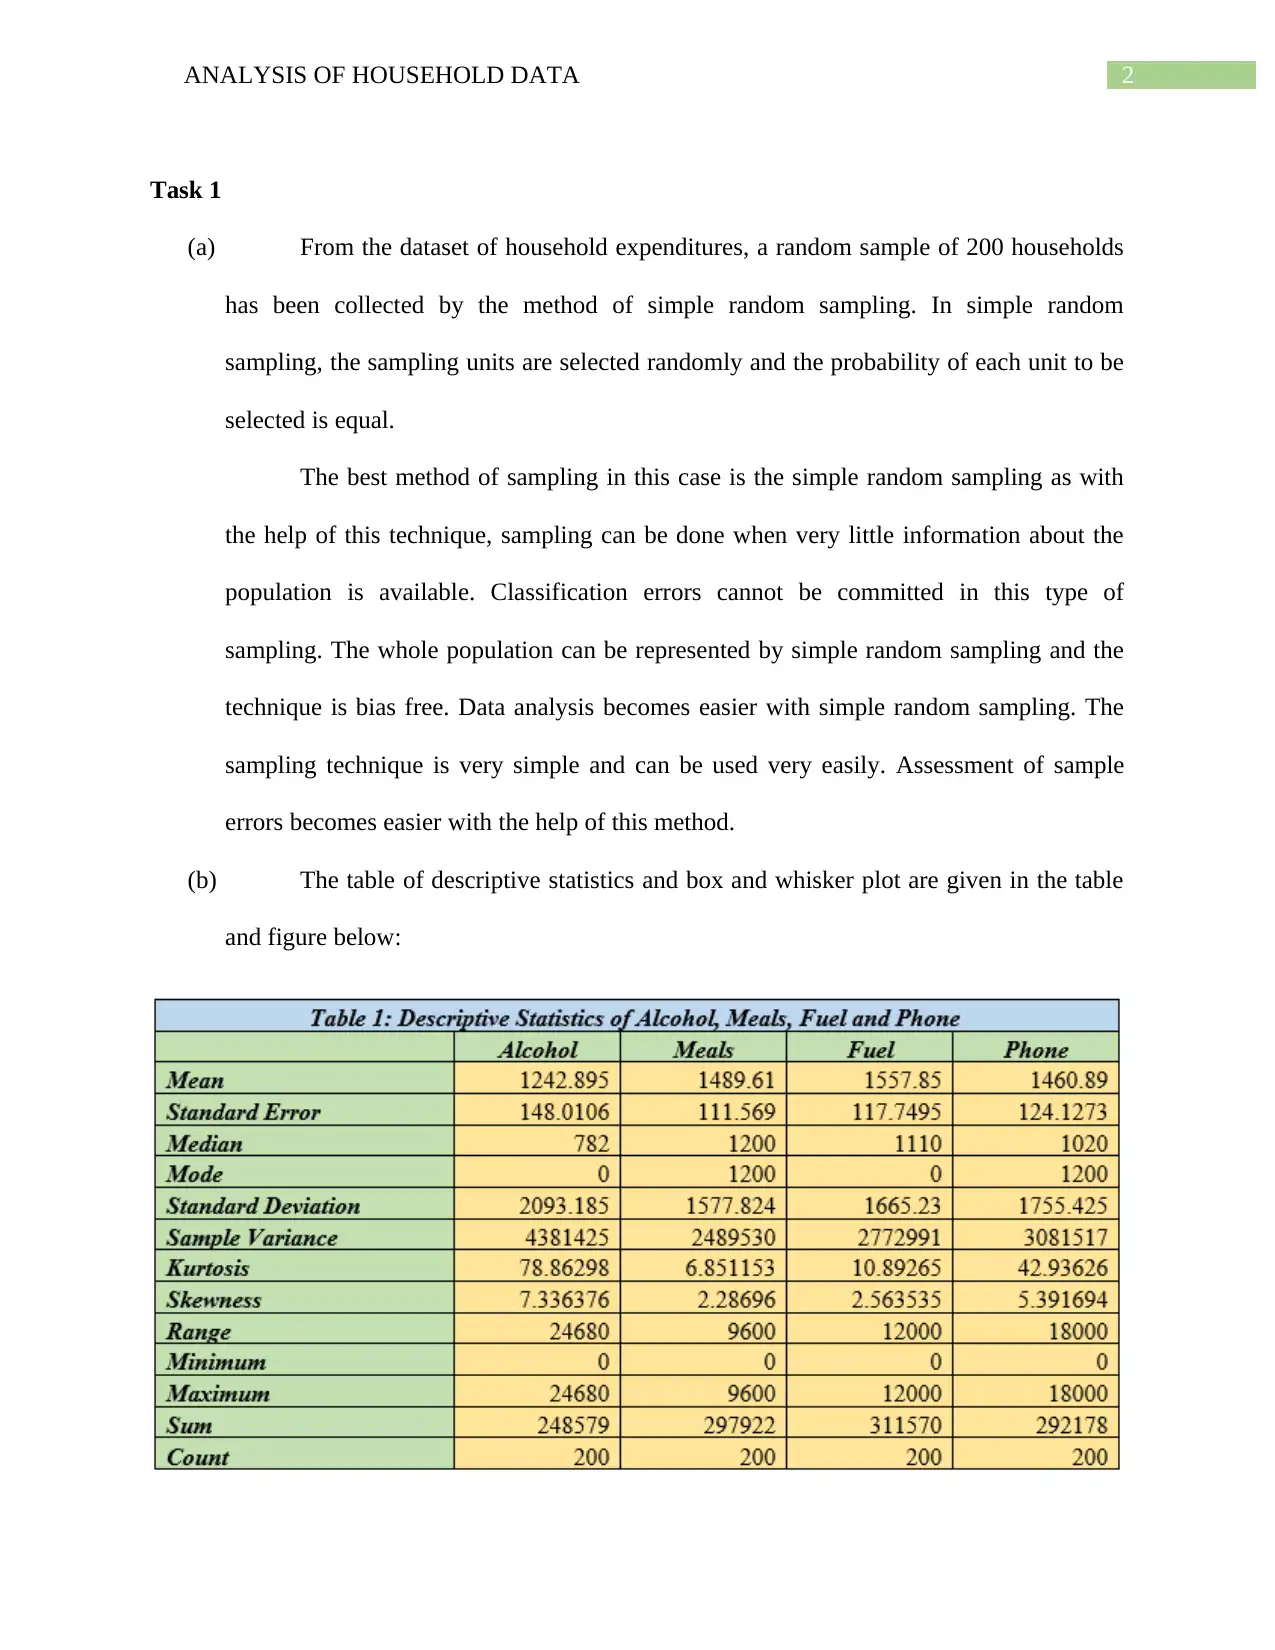
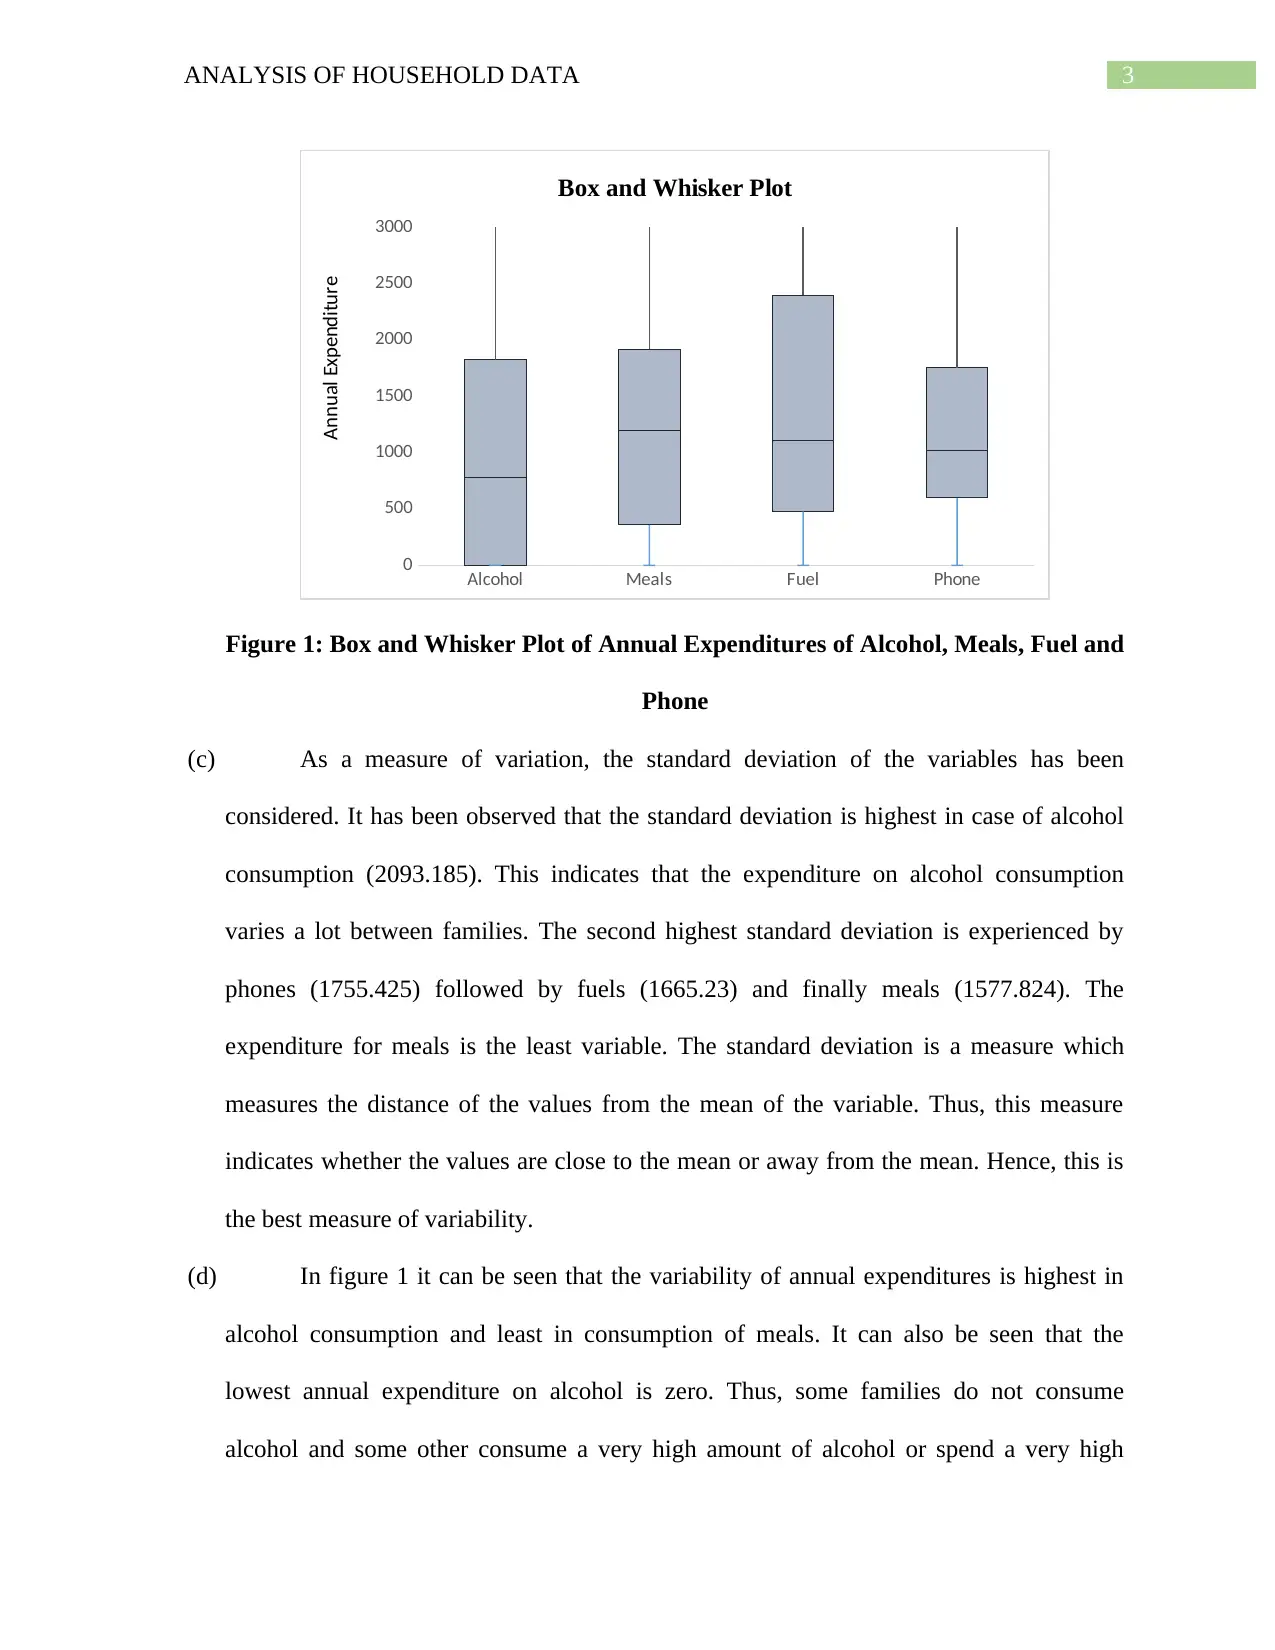
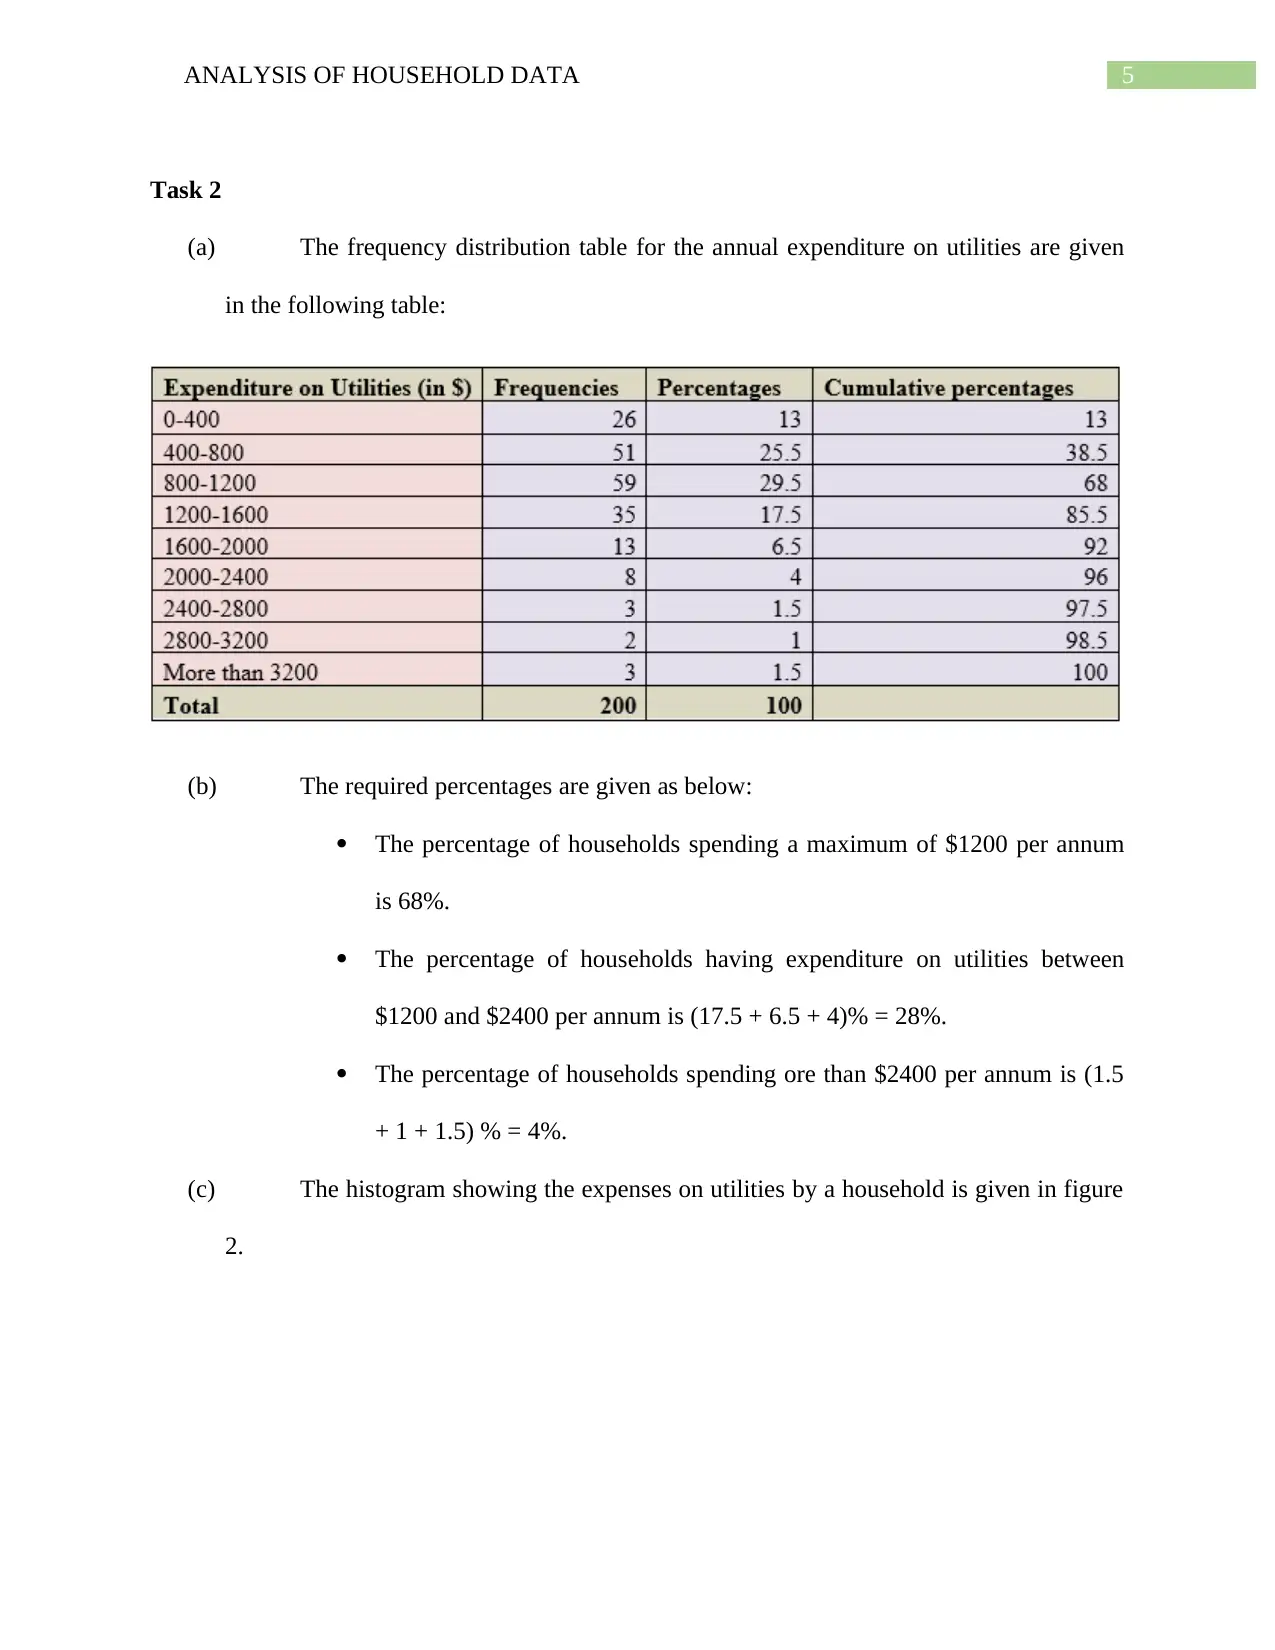
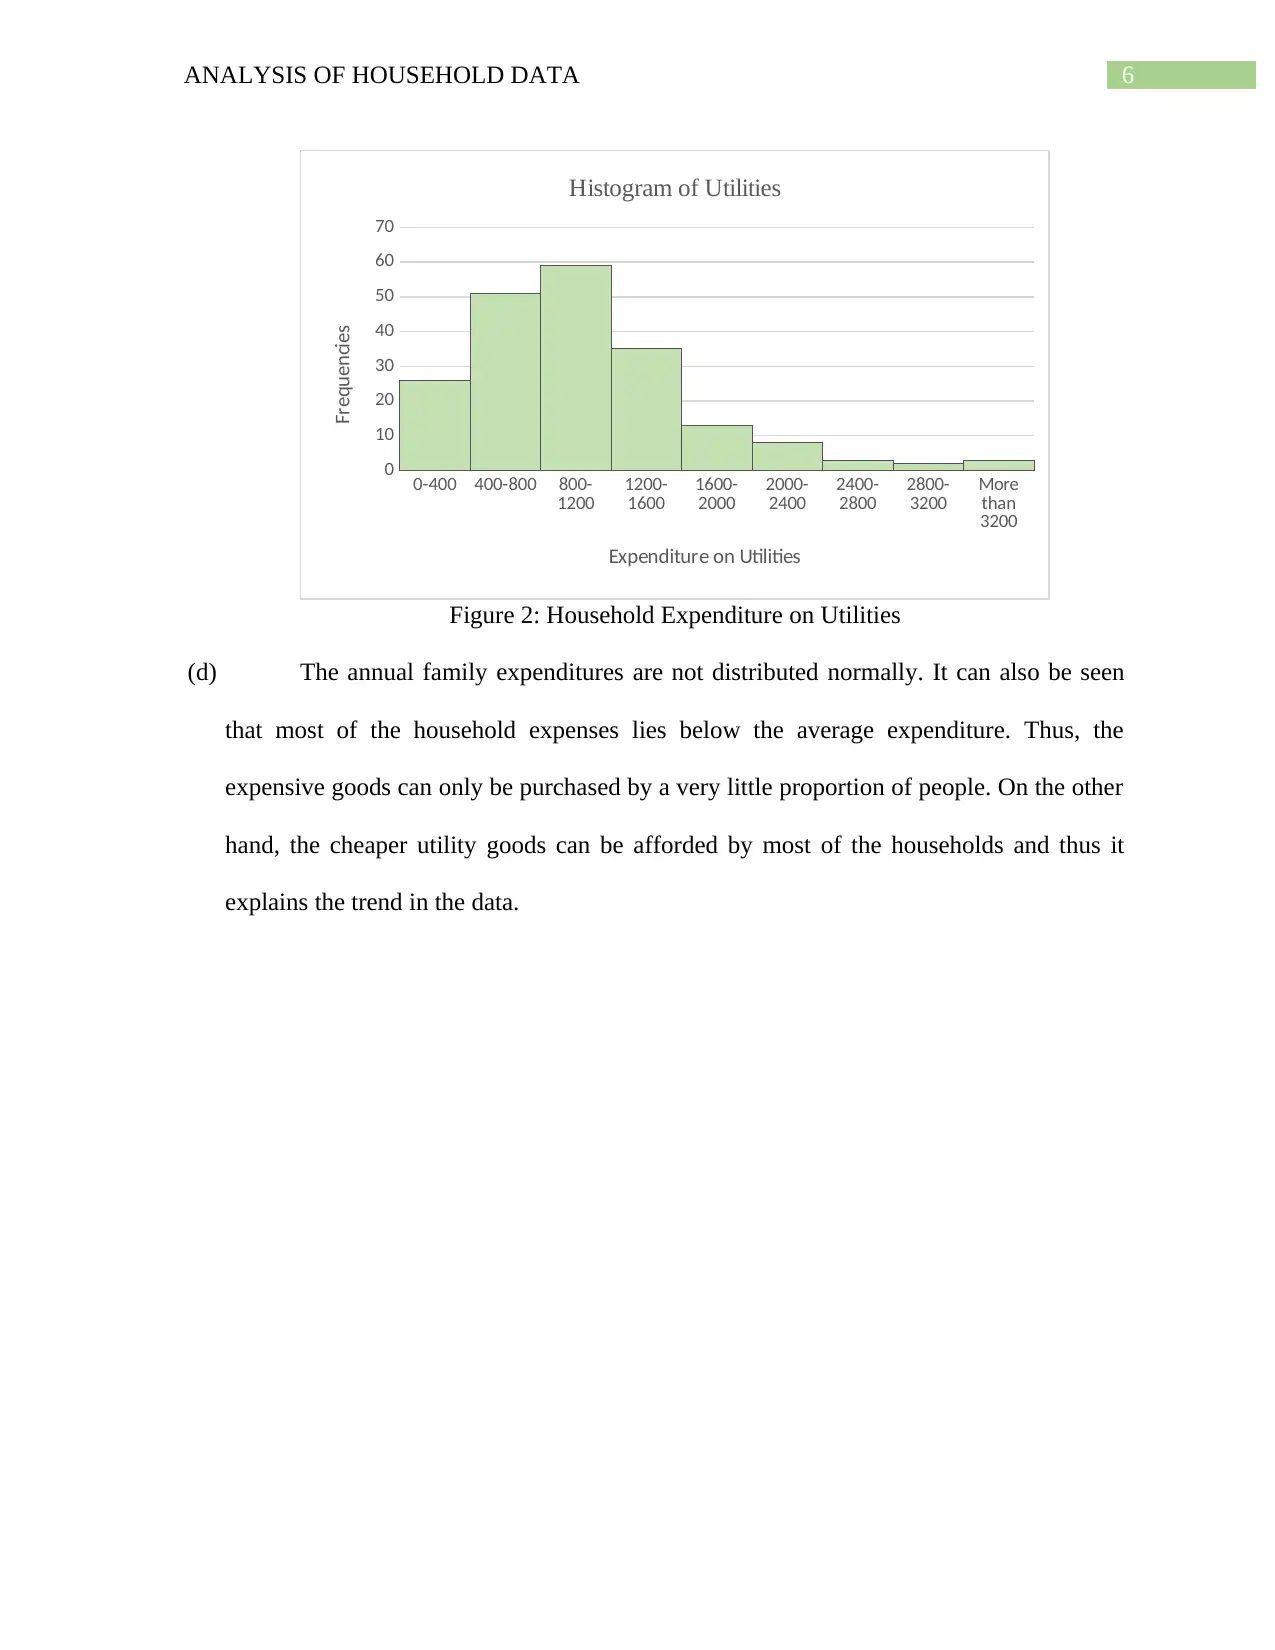
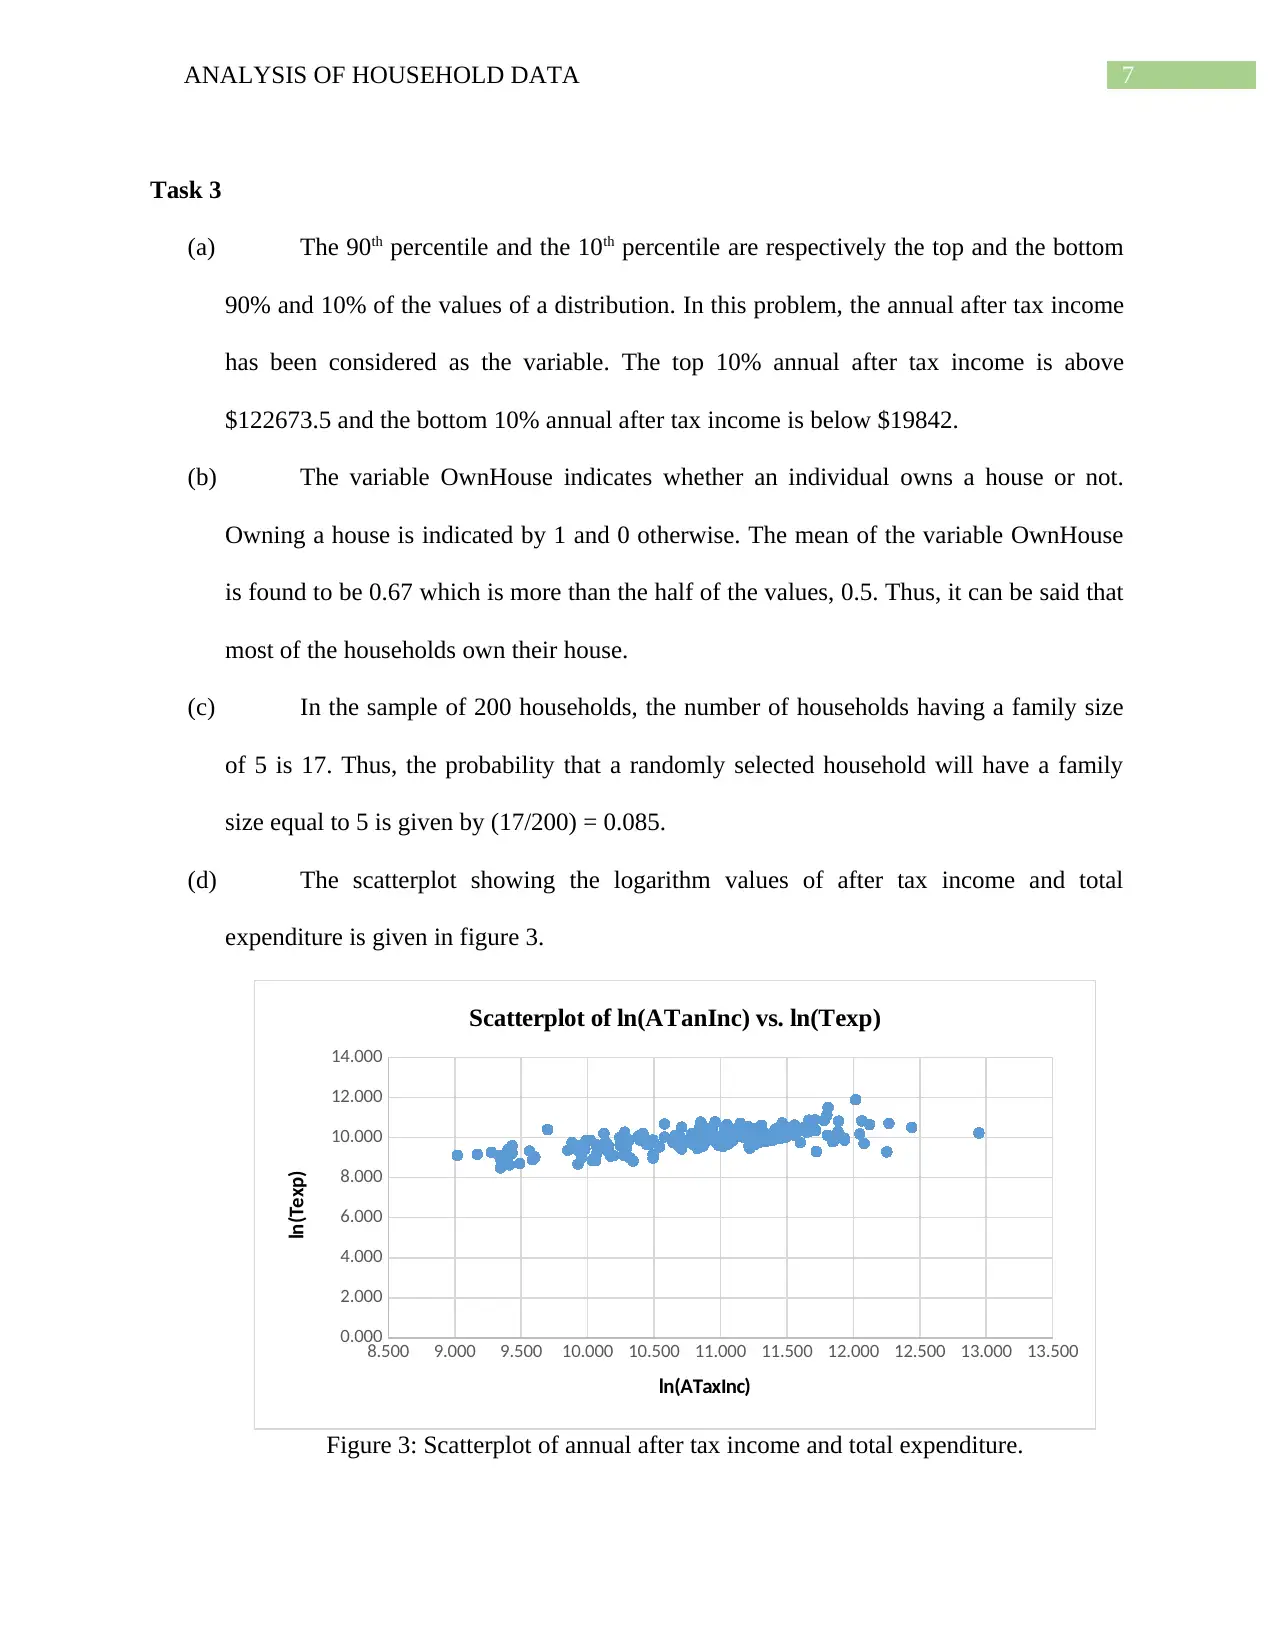
This assignment provides a comprehensive analysis of household data, employing various statistical techniques. It begins with a simple random sample of 200 households, justifying the use of this method for its bias-free nature and ease of data analysis. Descriptive statistics are presented, including a box and whisker plot visualizing annual expenditures on alcohol, meals, fuel, and phone services, with standard deviation used to measure variability. The analysis extends to frequency distribution of utility expenditures, calculating percentages within specified ranges and illustrating the distribution via a histogram. Percentile calculations for after-tax income are performed, alongside probability analysis related to household size and homeownership. A scatterplot examines the relationship between after-tax income and total expenditure, quantified by correlation. Finally, a contingency table explores the relationship between gender and education level within the households, calculating relevant probabilities and testing for independence between variables.
1 out of 11
Related Documents


Your All-in-One AI-Powered Toolkit for Academic Success.
+13062052269
info@desklib.com
Available 24*7 on WhatsApp / Email
![[object Object]](/_next/static/media/star-bottom.7253800d.svg)
Copyright © 2020–2026 A2Z Services. All Rights Reserved. Developed and managed by ZUCOL.