Comprehensive Analysis of Lewisham Health Profile: Coursework Report
VerifiedAdded on 2023/01/18
|23
|5003
|54
Report
AI Summary
This report presents a comprehensive analysis of the Lewisham Health Profile, focusing on key health indicators, demographic characteristics, and health determinants within the Lewisham area. It examines various aspects including health status, life expectancy, health inequalities, and vulnerable populations. The report utilizes data from the Public Health England profiles to assess community health needs, identify areas of deprivation, and analyze risk factors such as smoking, obesity, and alcohol-related harm. Furthermore, it explores child health indicators, including infant mortality and obesity rates, and discusses the priority public health needs of the community. The analysis also includes an overview of health monitoring and surveillance systems, theories of health need, population trends, and community asset-based approaches to address health challenges. The report aims to provide a detailed understanding of the health landscape in Lewisham, emphasizing the need for targeted interventions to reduce health inequalities and improve overall community health outcomes.

LEWISHAM HEALTH PROFILE 1
Lewisham Health Profile
Course name
Student Name
Date
Lewisham Health Profile
Course name
Student Name
Date
Paraphrase This Document
Need a fresh take? Get an instant paraphrase of this document with our AI Paraphraser
Lewisham Health Profile 2
Introduction.................................................................................................................................................3
Need assessment......................................................................................................................................3
Health profile...............................................................................................................................................4
Health Monitoring and surveillance systems...........................................................................................4
Lewisham health profile..............................................................................................................................5
Health summary......................................................................................................................................5
Demographic...............................................................................................................................................5
Deprivation..................................................................................................................................................6
Deprivation table.....................................................................................................................................6
Deprivation chat......................................................................................................................................7
Health status................................................................................................................................................7
Life expectancy table...............................................................................................................................8
Life expectancy chat................................................................................................................................8
Health indicators on injuries and ill health..............................................................................................9
Health indicators on injuries and ill health chat.......................................................................................9
Health indicators on child health.............................................................................................................9
Health indicators on child health chat....................................................................................................10
Demographic characteristics..............................................................................................................10
Behavior risk factors mortality chat.......................................................................................................11
Health status on health protection..........................................................................................................11
Health status on health protection chats.................................................................................................12
Indicators on demographic characteristics.............................................................................................12
Health determinants chats......................................................................................................................13
Priority public health needs of the community..........................................................................................13
Vulnerable and disadvantaged groups.......................................................................................................15
Theories of health need..............................................................................................................................15
Population trends and transitions...............................................................................................................16
Community asset-based.............................................................................................................................17
Conclusion.................................................................................................................................................17

Lewisham Health Profile 3
Introduction
In a population there major issues that are major concern for the ruling government and local
authorities’ need to solve and maintain effectiveness in the population. One of the key concerns
is on health issues; this concern of wellbeing of the population ensures that the population of a
given state or republic health is maintained to prevent consequences that may affect the economy
of the state. In this case I will focus on the health issue in Lewisham in England. I will focus on
the factors contributing to health issues for better understanding of the prevailing health issues in
the region.
To manage the national health in England, the local health provides health profile which I will
use to manage health of the England population. Through the provision of health profile, the
information provided in health profile will enhance the easy management of health issue in small
areas which affect the England population (Archer, & Colhoun2018, p.24). There are various
approaches I will use in the data collection which guide in the implementation and improvement
of health standards in England.
Need assessment
Need assessment is the approach to identify how much knowledge, ability or the interest a group
of people have about a given problem or topic of study (Sara 2018, p.1217). This is done to
identify the key issue affecting the society in order of implementing and improving the system
and standards of the prevailing needs in the society. Need assessment also enables will enable me
to understand what has been done and what has not been done in order to formulate a plan on
how to fill the gaps.
⊘ This is a preview!⊘
Do you want full access?
Subscribe today to unlock all pages.
Trusted by 1+ million students worldwide
Lewisham Health Profile 4
Health profile
Community health profile on the other hand, is an important tool that I will use to provide the
information data about a given community (Yüksel 2018, p.300). The profile entails the
community characteristics, health status, quality of life, health risk factors and resources relevant
for most communities in a given areas of study. The health profile provides descriptive
information that I will use to set priorities and interpretation of health issues in given community
(Boden & Rees, 2010). The health profile and need assessment are both tools to identify health
issues affecting the society. I will use the health profile to address health issues affecting the
community in Lewisham. I will use the data provided to set priority on major health issue
affecting the community.
Health Monitoring and surveillance systems
To facilitate effective health systems in a given society health monitoring and surveillance is
done to ensure that there is continuity improvement of health standards (Terroba, Frövel, &
Atienza 2019, p.25). Health monitoring ensures that health problems in a society are identified
and solved. This includes diagnosis of health status, identification of health threats, and
assessment of health service’s needs. I will use Health monitoring to manage risks and risks
mitigations (Hui, Charlebois, & Sun 2018, p.55). To meet the expected health and accurate
results health surveillance is done on daily basis in community health care. This involves
collection of health data, data analysis and interpretation of findings. I will use The interpreted
for health planning and implementation and evaluation of health services in the society (
Michael, et al. 2018, p.1358).
Paraphrase This Document
Need a fresh take? Get an instant paraphrase of this document with our AI Paraphraser
Lewisham Health Profile 5
Lewisham health profile
According to Unitary authority health profile, the population of Lewisham has almost 300,000
total populations. Out of these, the number of old people aged 65 and above ranges between 8%
– 9 %, majority of the population are young people with the highest percentage of 52% while
children under 18 years range between 23%. The population has a sharp decrease with age which
is a strong indicator of deprivation of life expectancy in Lewisham (PHE 2019).
Health summary
The health of people in Lewisham varies with the average health the England population at 20%.
The total number of children living in deprived condition is 23% of the England children
population. These rates make it one of the most deprived districts in England. Life expectancy
for men is almost 6 years lower and 4 years lower for women. The rate of children health is
worse than the average of England. The rate of child obesity is at 23% compared to the England
children population. The rate of child mortality is high for as compared to the average child
population in England. The adult health accounts the highest number of count in the hospital as
compared to the average in England population. The health related to alcohol, self-harm and
sexual related problem are among the highest problem reported by the local authority (PHE
2019). There major health indicators in the Lwisham population as indicated by the health
profile.
Demographic
Lewishing has a total population of 292,000 people which is expected to rise with318000 in year
2021. A quarter of this population is under 19. The region has the highest number of mortality
Lewisham Health Profile 6
rate with over 27% above average of the total population in London. 46% of the population is
black and minority ethnic groups (John & Chinouya 2018, p.13).
The determinant of demographic is independent of the population practices which include
religion, language and economical practices. The majority of the populations are Christian with
the highest percentage of 52%. Followed by non-religious group with 26%, Muslims forms 6%
while other religions have less than 2%. The common language spoken by the majority is
English
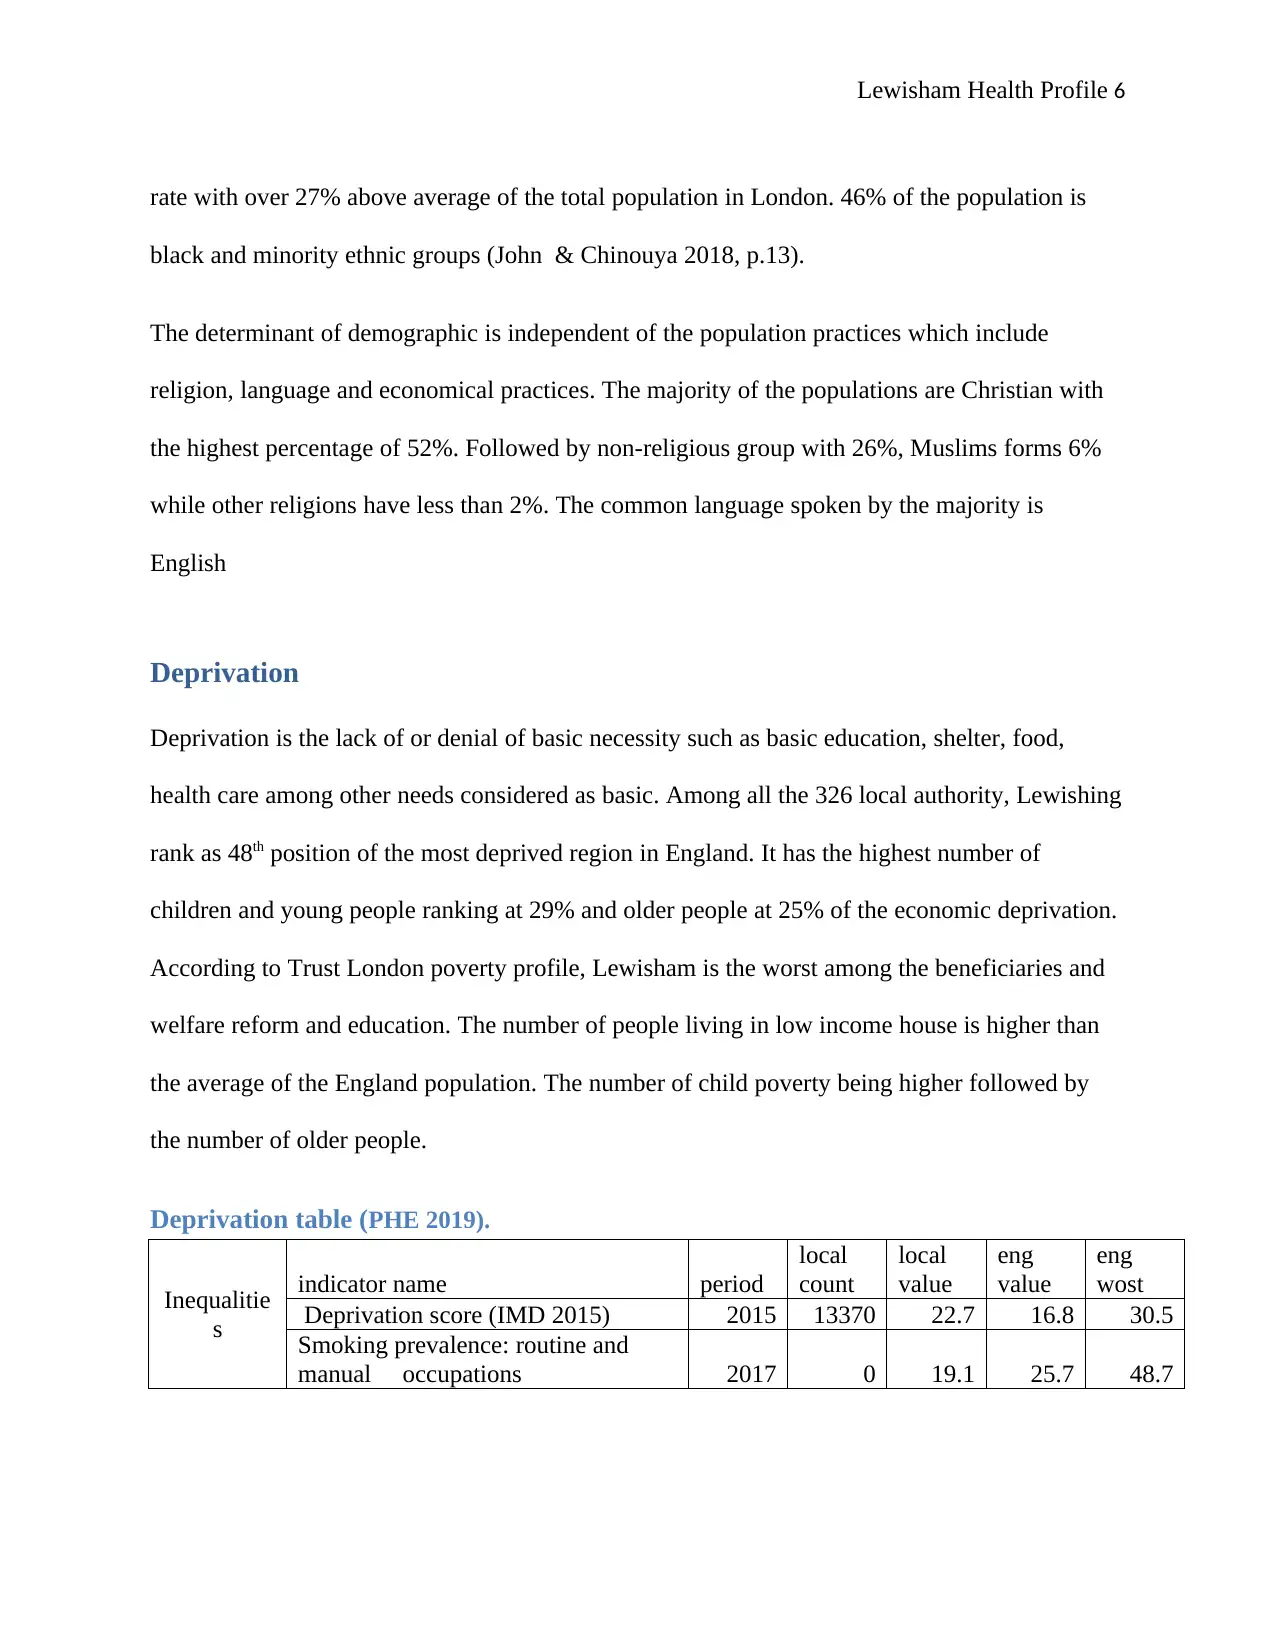
Deprivation
Deprivation is the lack of or denial of basic necessity such as basic education, shelter, food,
health care among other needs considered as basic. Among all the 326 local authority, Lewishing
rank as 48th position of the most deprived region in England. It has the highest number of
children and young people ranking at 29% and older people at 25% of the economic deprivation.
According to Trust London poverty profile, Lewisham is the worst among the beneficiaries and
welfare reform and education. The number of people living in low income house is higher than
the average of the England population. The number of child poverty being higher followed by
the number of older people.
Deprivation table (PHE 2019).
Inequalitie
s
indicator name period
local
count
local
value
eng
value
eng
wost
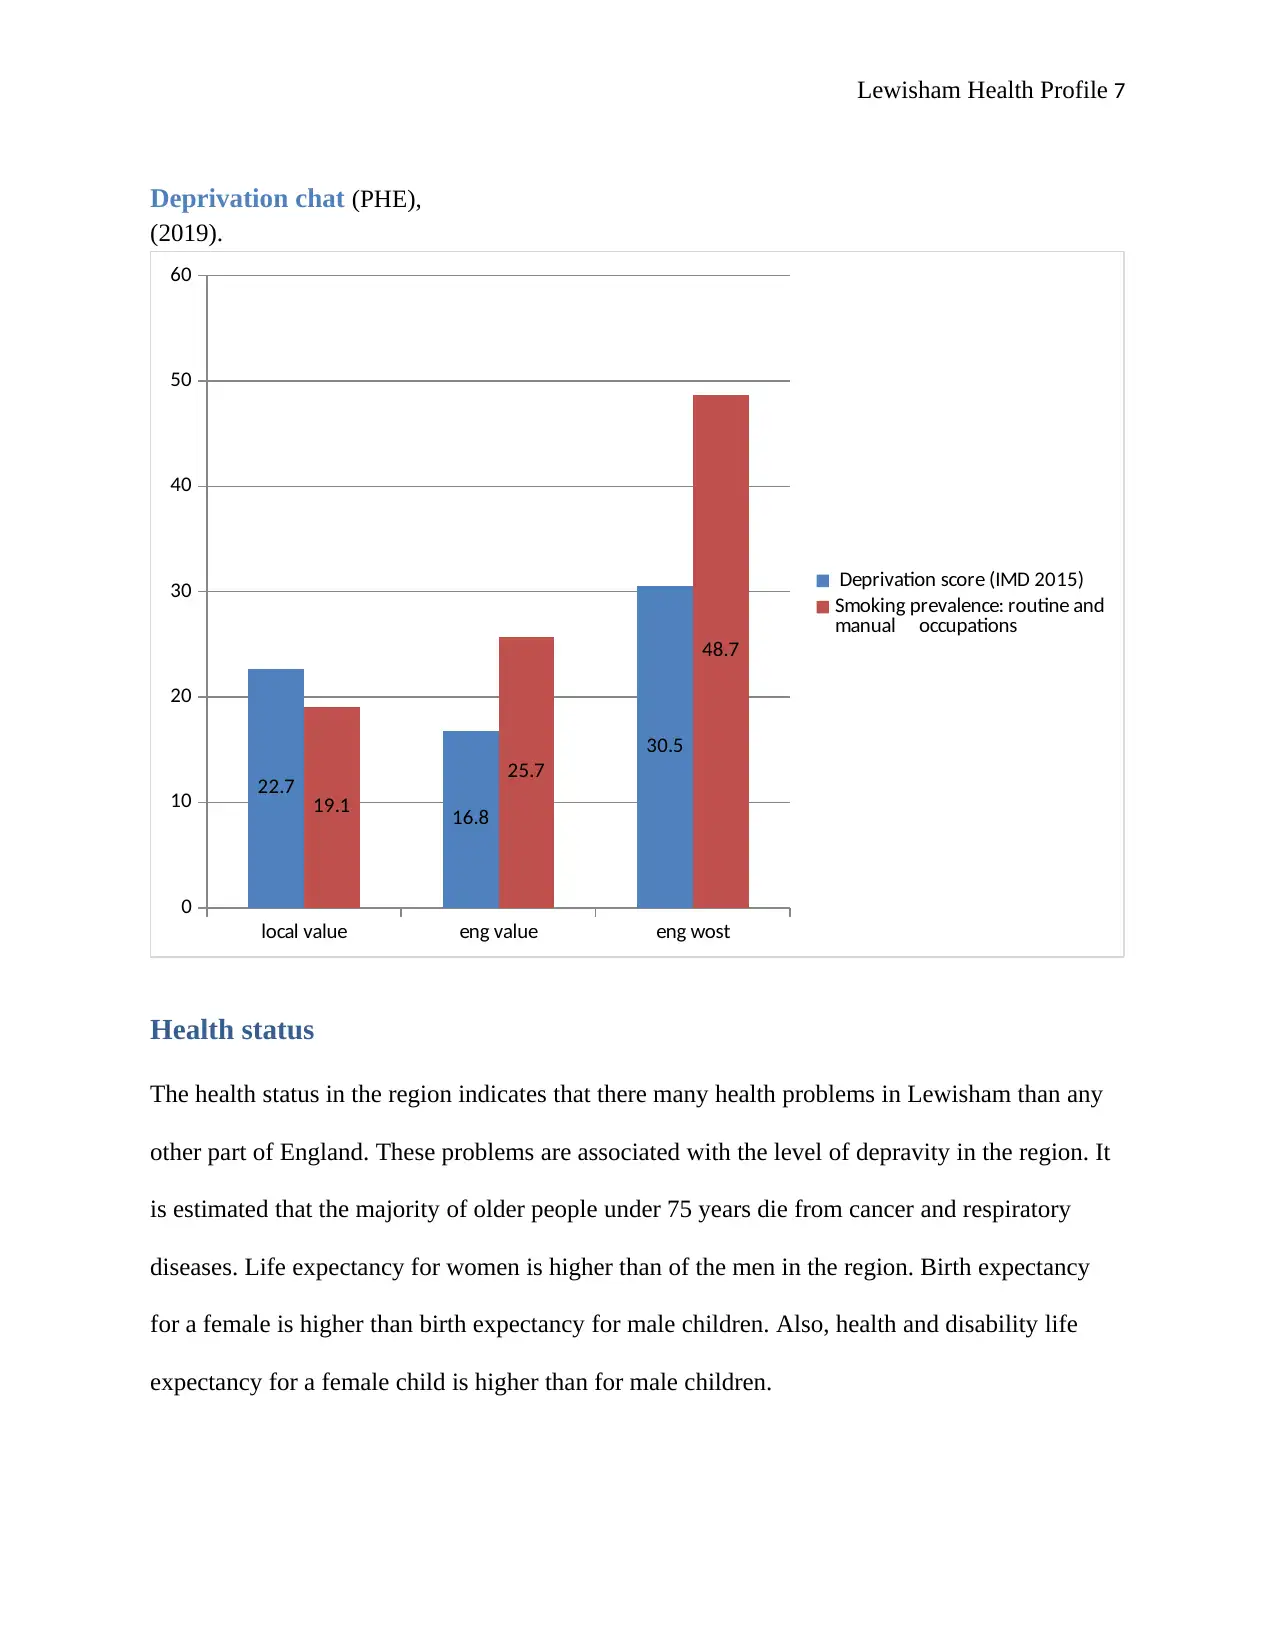
Deprivation score (IMD 2015) 2015 13370 22.7 16.8 30.5
Smoking prevalence: routine and
manual occupations 2017 0 19.1 25.7 48.7
rate with over 27% above average of the total population in London. 46% of the population is
black and minority ethnic groups (John & Chinouya 2018, p.13).
The determinant of demographic is independent of the population practices which include
religion, language and economical practices. The majority of the populations are Christian with
the highest percentage of 52%. Followed by non-religious group with 26%, Muslims forms 6%
while other religions have less than 2%. The common language spoken by the majority is
English
Deprivation
Deprivation is the lack of or denial of basic necessity such as basic education, shelter, food,
health care among other needs considered as basic. Among all the 326 local authority, Lewishing
rank as 48th position of the most deprived region in England. It has the highest number of
children and young people ranking at 29% and older people at 25% of the economic deprivation.
According to Trust London poverty profile, Lewisham is the worst among the beneficiaries and
welfare reform and education. The number of people living in low income house is higher than
the average of the England population. The number of child poverty being higher followed by
the number of older people.
Deprivation table (PHE 2019).
Inequalitie
s
indicator name period
local
count
local
value
eng
value
eng
wost
Deprivation score (IMD 2015) 2015 13370 22.7 16.8 30.5
Smoking prevalence: routine and
manual occupations 2017 0 19.1 25.7 48.7
⊘ This is a preview!⊘
Do you want full access?
Subscribe today to unlock all pages.
Trusted by 1+ million students worldwide
Lewisham Health Profile 7
Deprivation chat (PHE),
(2019).
local value eng value eng wost
0
10
20
30
40
50
60
22.7
16.8
30.5
19.1
25.7
48.7
Deprivation score (IMD 2015)
Smoking prevalence: routine and
manual occupations
Health status
The health status in the region indicates that there many health problems in Lewisham than any
other part of England. These problems are associated with the level of depravity in the region. It
is estimated that the majority of older people under 75 years die from cancer and respiratory
diseases. Life expectancy for women is higher than of the men in the region. Birth expectancy
for a female is higher than birth expectancy for male children. Also, health and disability life
expectancy for a female child is higher than for male children.
Paraphrase This Document
Need a fresh take? Get an instant paraphrase of this document with our AI Paraphraser
Lewisham Health Profile 8
The health status of the service provision in general health care is worst and below the expected
standards. The living standards are lowered by the rate of increased poverty whereby the poor
health is fueled by overcrowded homes and the while pensioners are living alone. The status of
children with obesity is very high as compared to the England average. The children hospital
attendance and admission in the hospital is high or almost equal to the England average. Health
indicators life expectancy
Life expectancy table ((PHE), 2019)
life
expectanc
y and
cause of
death
indicator name period
local
count
local
value
eng
value
eng
wost
Life expectancy at birth (Male
2014-
2016 0 79.1 79.5 74.2
Life expectancy at birth (Female)
2014 -
16 0 83.3 83.1 79.4
Under 75 mortality rate: all causes
2014-
16 1887 371.1 371.1 333.8
Under 75 mortality rate:
cardiovascular
2014-
16 395 81.8 73.5 141.3
Under 75 mortality rate: cancer
2014-
16 701 148.8 136.8 195.3
Suicide rate
2014-
16 60 7.2 9.9 18.3
Lewisham Health Profile 9
Life expectancy chat
0
50
100
150
200
250
300
350
400
local value
eng value
eng wost
Health indicators on injuries and ill health ((PHE), 2019)
injuries
and ill
health
indicator name period
local
count
local
value
eng
value
eng
wost
Killed and seriously injured on
roads
2014 -
16 183 20.5 39.7 110.4
Hospital stays for self−harm 260 84.2 185.3 578.9
Hip fractures in older people (aged
65+ 121 427.1 575 854.2
Cancer diagnosed at early stage 378 52.4 52.6 39.3
Diabetes diagnoses (aged 17+) 0 65.3 77.1 54.3
Dementia diagnoses (aged 65+ 1351 70.9 67.9 45.1
⊘ This is a preview!⊘
Do you want full access?
Subscribe today to unlock all pages.
Trusted by 1+ million students worldwide
Lewisham Health Profile 10
Health indicators on injuries and ill health chat
Killed and seriously injured on roads
Hospital stays for self−harm
Hip fractures in older people (aged 65+
Cancer diagnosed at early stage
Diabetes diagnoses (aged 17+)
Dementia diagnoses (aged 65+
0
200
400
600
800
local value
eng value
eng wost
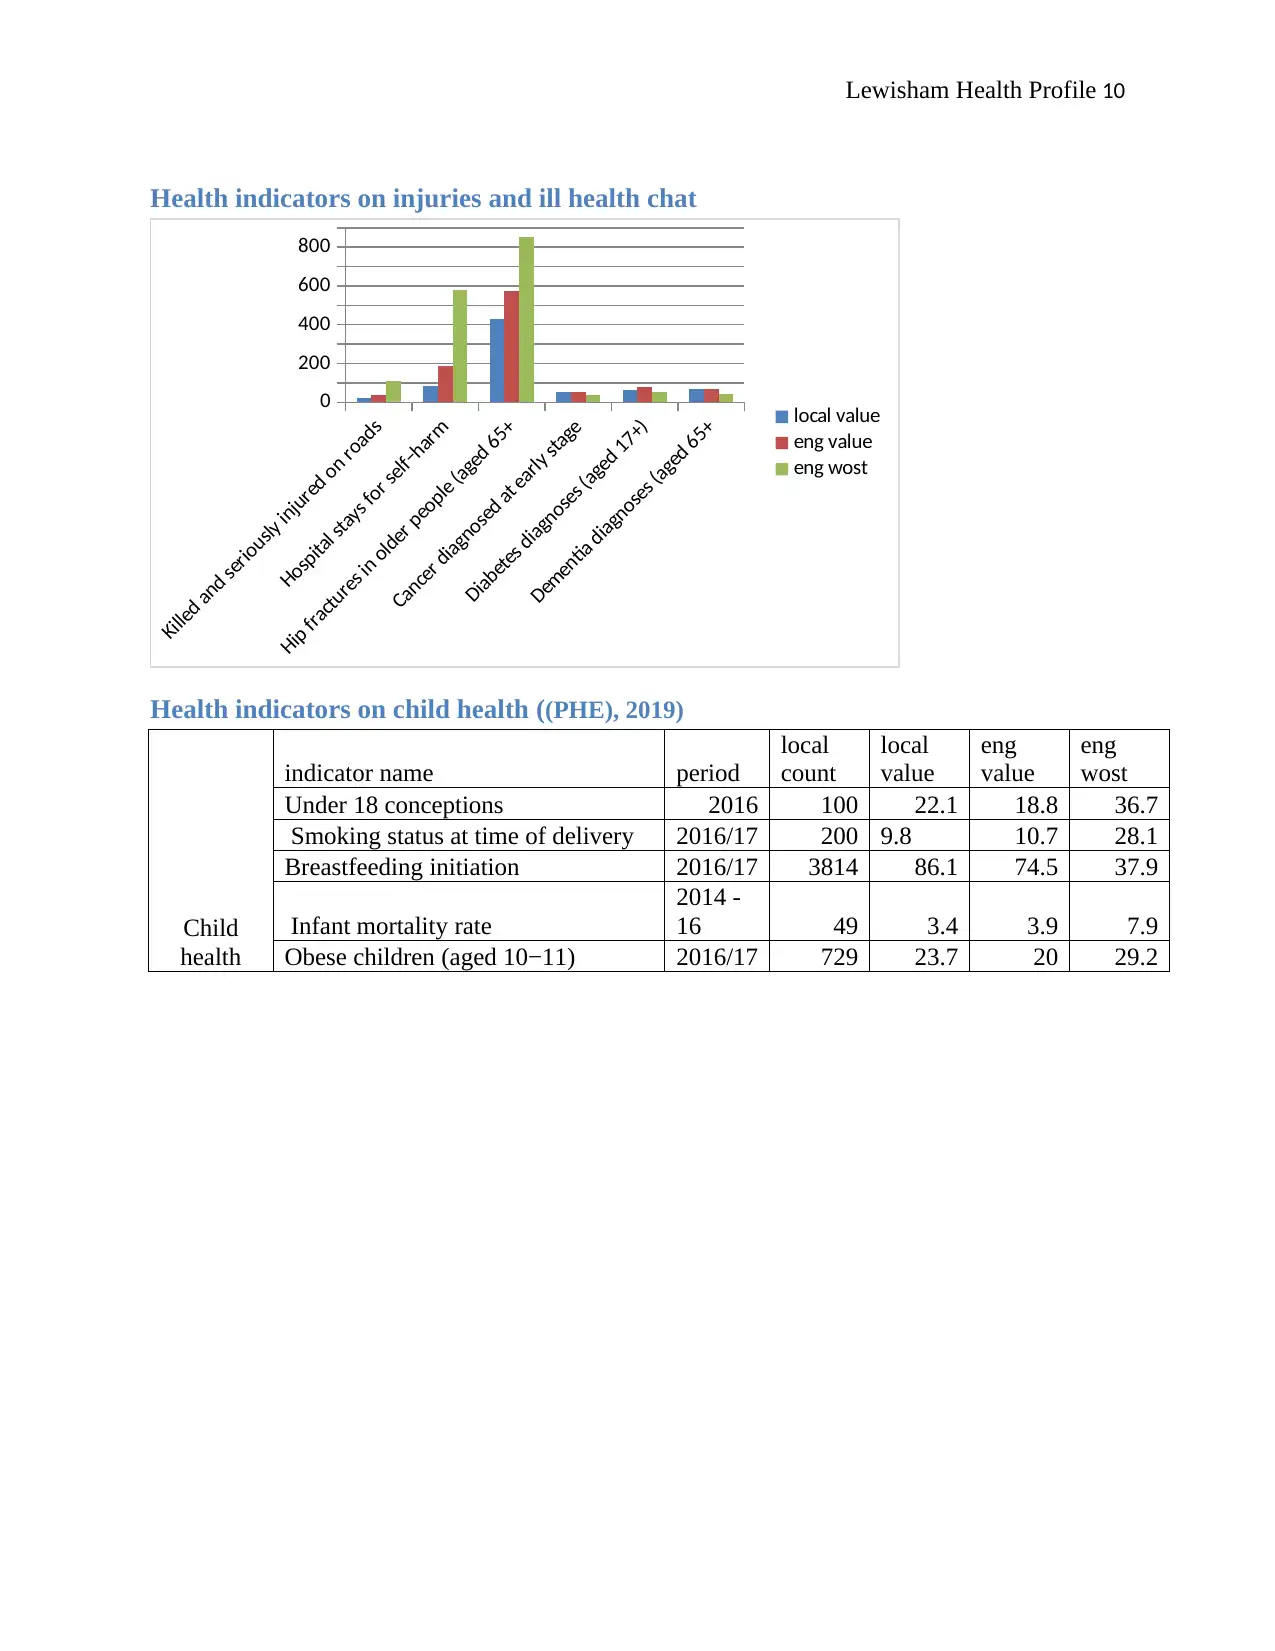
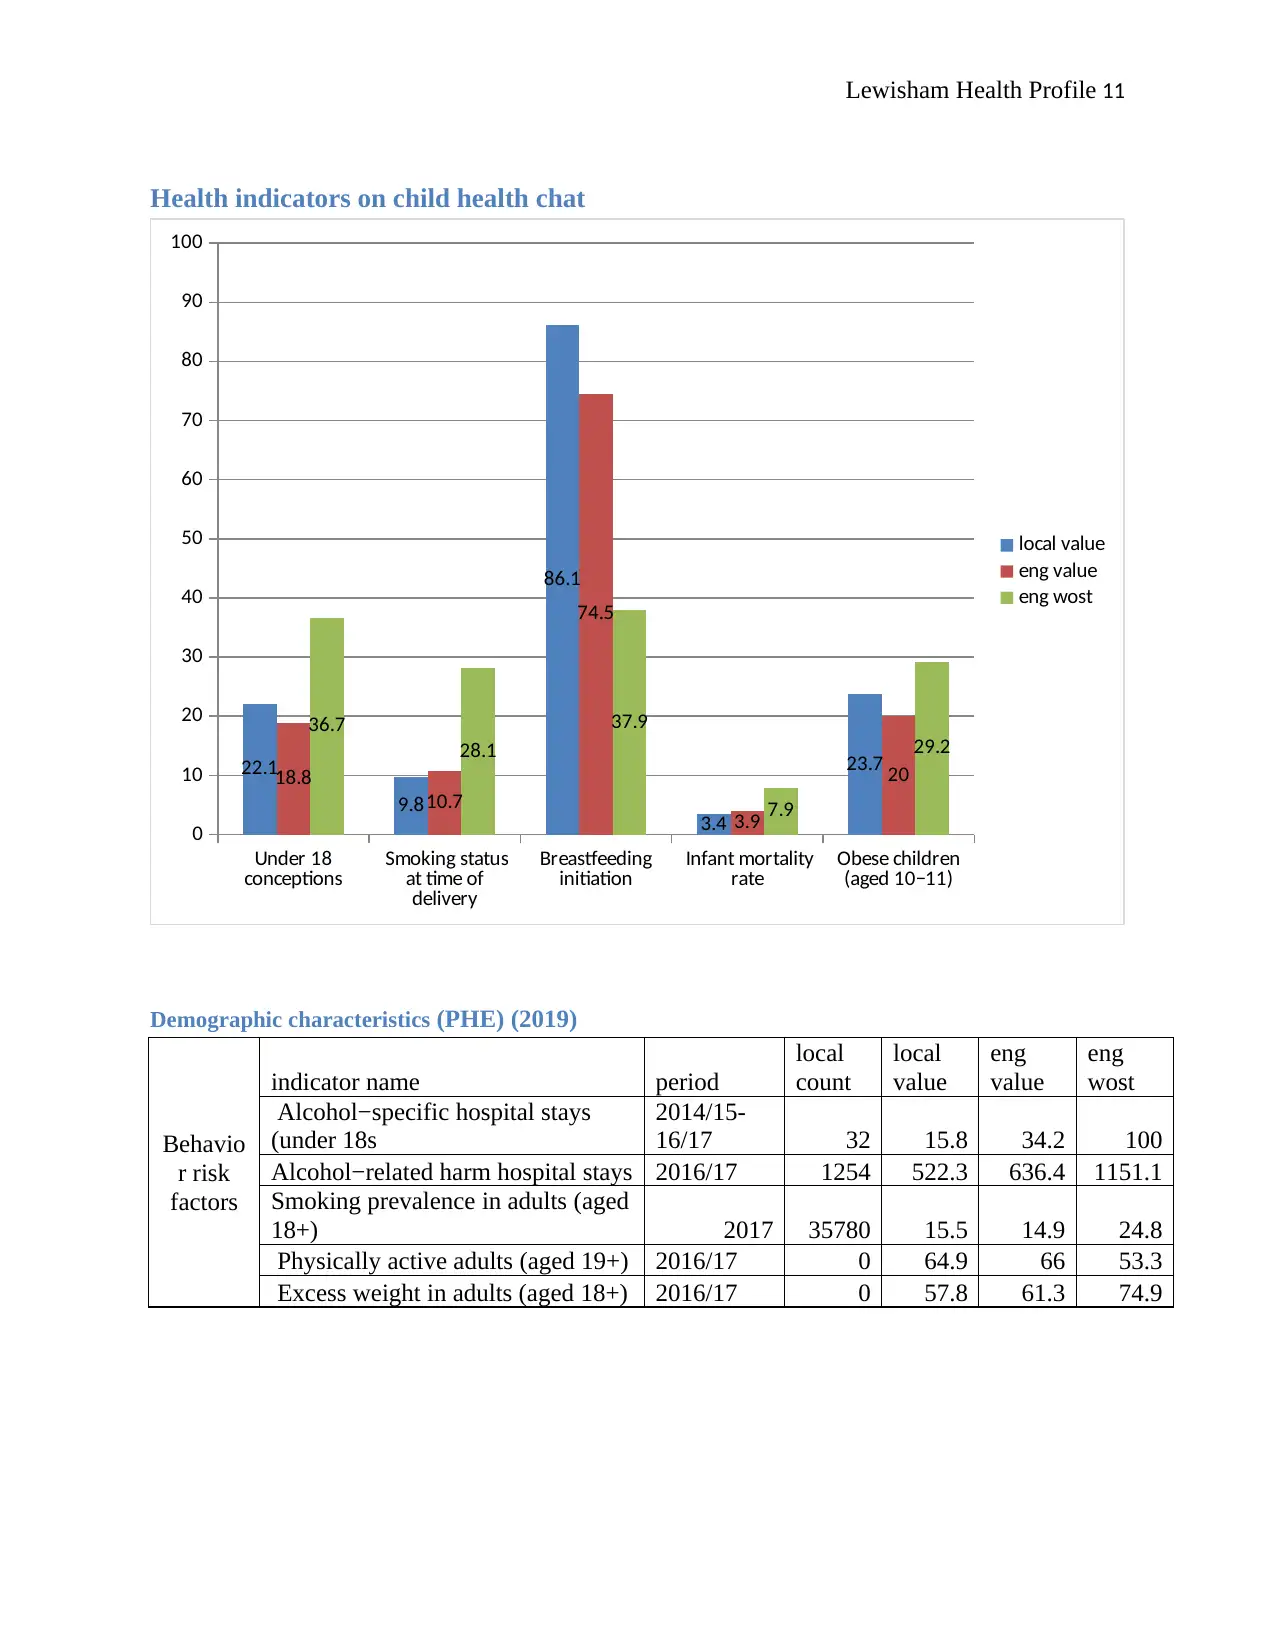
Health indicators on child health ((PHE), 2019)
Child
health
indicator name period
local
count
local
value
eng
value
eng
wost
Under 18 conceptions 2016 100 22.1 18.8 36.7
Smoking status at time of delivery 2016/17 200 9.8 10.7 28.1
Breastfeeding initiation 2016/17 3814 86.1 74.5 37.9
Infant mortality rate
2014 -
16 49 3.4 3.9 7.9
Obese children (aged 10−11) 2016/17 729 23.7 20 29.2
Health indicators on injuries and ill health chat
Killed and seriously injured on roads
Hospital stays for self−harm
Hip fractures in older people (aged 65+
Cancer diagnosed at early stage
Diabetes diagnoses (aged 17+)
Dementia diagnoses (aged 65+
0
200
400
600
800
local value
eng value
eng wost
Health indicators on child health ((PHE), 2019)
Child
health
indicator name period
local
count
local
value
eng
value
eng
wost
Under 18 conceptions 2016 100 22.1 18.8 36.7
Smoking status at time of delivery 2016/17 200 9.8 10.7 28.1
Breastfeeding initiation 2016/17 3814 86.1 74.5 37.9
Infant mortality rate
2014 -
16 49 3.4 3.9 7.9
Obese children (aged 10−11) 2016/17 729 23.7 20 29.2
Paraphrase This Document
Need a fresh take? Get an instant paraphrase of this document with our AI Paraphraser
Lewisham Health Profile 11
Health indicators on child health chat
Under 18
conceptions Smoking status
at time of
delivery
Breastfeeding
initiation Infant mortality
rate Obese children
(aged 10−11)
0
10
20
30
40
50
60
70
80
90
100
22.1
9.8
86.1
3.4
23.7
18.8
10.7
74.5
3.9
20
36.7
28.1
37.9
7.9
29.2
local value
eng value
eng wost
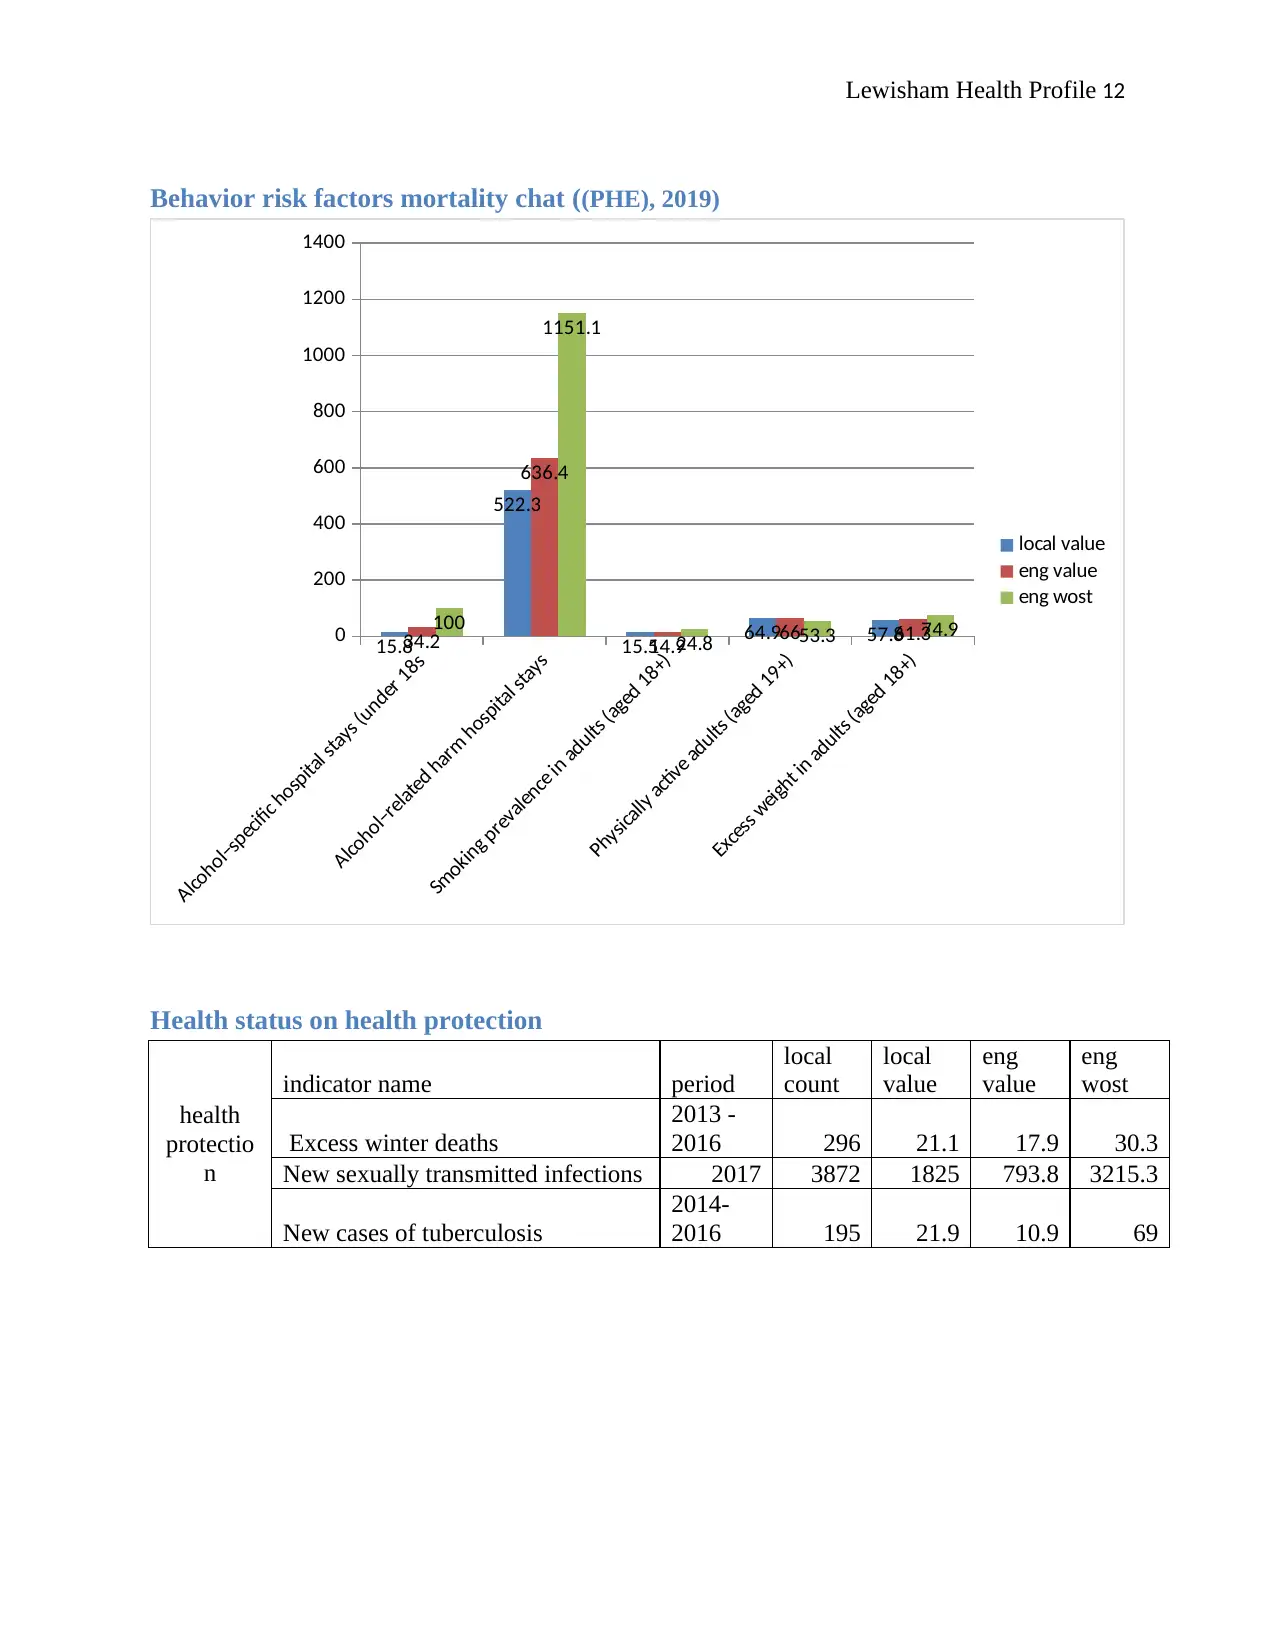
Demographic characteristics (PHE) (2019)
Behavio
r risk
factors
indicator name period
local
count
local
value
eng
value
eng
wost
Alcohol−specific hospital stays
(under 18s
2014/15-
16/17 32 15.8 34.2 100
Alcohol−related harm hospital stays 2016/17 1254 522.3 636.4 1151.1
Smoking prevalence in adults (aged
18+) 2017 35780 15.5 14.9 24.8
Physically active adults (aged 19+) 2016/17 0 64.9 66 53.3
Excess weight in adults (aged 18+) 2016/17 0 57.8 61.3 74.9
Health indicators on child health chat
Under 18
conceptions Smoking status
at time of
delivery
Breastfeeding
initiation Infant mortality
rate Obese children
(aged 10−11)
0
10
20
30
40
50
60
70
80
90
100
22.1
9.8
86.1
3.4
23.7
18.8
10.7
74.5
3.9
20
36.7
28.1
37.9
7.9
29.2
local value
eng value
eng wost
Demographic characteristics (PHE) (2019)
Behavio
r risk
factors
indicator name period
local
count
local
value
eng
value
eng
wost
Alcohol−specific hospital stays
(under 18s
2014/15-
16/17 32 15.8 34.2 100
Alcohol−related harm hospital stays 2016/17 1254 522.3 636.4 1151.1
Smoking prevalence in adults (aged
18+) 2017 35780 15.5 14.9 24.8
Physically active adults (aged 19+) 2016/17 0 64.9 66 53.3
Excess weight in adults (aged 18+) 2016/17 0 57.8 61.3 74.9
Lewisham Health Profile 12
Behavior risk factors mortality chat ((PHE), 2019)
Alcohol−specific hospital stays (under 18s
Alcohol−related harm hospital stays
Smoking prevalence in adults (aged 18+)
Physically active adults (aged 19+)
Excess weight in adults (aged 18+)
0
200
400
600
800
1000
1200
1400
15.8
522.3
15.5 64.9 57.834.2
636.4
14.9 66 61.3
100
1151.1
24.8 53.3 74.9
local value
eng value
eng wost
Health status on health protection
health
protectio
n
indicator name period
local
count
local
value
eng
value
eng
wost
Excess winter deaths
2013 -
2016 296 21.1 17.9 30.3
New sexually transmitted infections 2017 3872 1825 793.8 3215.3
New cases of tuberculosis
2014-
2016 195 21.9 10.9 69
⊘ This is a preview!⊘
Do you want full access?
Subscribe today to unlock all pages.
Trusted by 1+ million students worldwide
1 out of 23
Related Documents


Your All-in-One AI-Powered Toolkit for Academic Success.
+13062052269
info@desklib.com
Available 24*7 on WhatsApp / Email
![[object Object]](/_next/static/media/star-bottom.7253800d.svg)
Unlock your academic potential
Copyright © 2020–2025 A2Z Services. All Rights Reserved. Developed and managed by ZUCOL.