Analysis of Company: TUI AG
VerifiedAdded on 2022/11/28
|20
|4980
|230
AI Summary
This document provides a comprehensive analysis of TUI AG, including financial analysis, ratio analysis, and balance scorecard. It covers the company's current position, liquidity, efficiency, and strategic formulation. The document also discusses the limitations of ratio analysis and the benefits of using a balance scorecard.
Contribute Materials
Your contribution can guide someone’s learning journey. Share your
documents today.
ANALYSIS OF COMPANY
Secure Best Marks with AI Grader
Need help grading? Try our AI Grader for instant feedback on your assignments.
EXECUTIVE SUMMARY
It can be inferred from the above project that a company can be analysed using the various tools
and techniques of the management accounting like the ratio analysis, balance scorecards, cost
and the decision-making accounting. Based on this analysis that is conducted for a company the
various strategic formulation are done to observe the achievement of the financial and the non-
financial objectives of the company. The analysis of the external and internal environment of the
company shall also create the competencies for assuming competitive advantage in the industry.
TABLE OF CONTENTS
INTRODUCTION...........................................................................................................................1
ABOUT THE COMPANY..............................................................................................................1
RATIO ANALYSIS.........................................................................................................................1
Calculation of the ratios...............................................................................................................1
Interpretation of the ratios............................................................................................................1
BALANCE SCORECARD..............................................................................................................4
Four perspectives analysis of the balance score cards.................................................................4
External and internal legal environment......................................................................................6
Strategic performance of the company........................................................................................6
CONCLUSION................................................................................................................................6
REFERENCES................................................................................................................................8
APPENDICES.................................................................................................................................8
INTRODUCTION
The financial analysis of the company can be done through using the various techniques of the management accounting that
can ascertain the current position of the business which is affected by the various financial and the non-financial indicators of the
company. The current project shall be disclosing the financial analysis of the company through undertaking the ratio analysis of the
last five-year's data showing the financial, liquidity and the efficiency position of the company. Apart from that it shall be highlighting
the four perspectives analysis of the balance scorecard. Further the other areas like the strategic management and the external and
internal legal environment of the company shall be reflected in the report.
ABOUT THE COMPANY
TUI AG is the German multinational travel and tourism company that was founded in the year 1923 and is headquartered in
Hanover, Germany. It is one of the world's largest travel and tourism companies which has it own travel agencies, cruise ships,
airlines, hotels and the other retail outlets to carry out the operations of the company (TUI Group, 2021). The leisure company has
over the years established successful partnerships, mergers which has spread the market of the company in multiple countries round
the world. It is also gained the competitive advantage through the horizontal and the vertical integration wherein they generated
ownership in maximum properties further boosting the profitability and growth of the company.
RATIO ANALYSIS
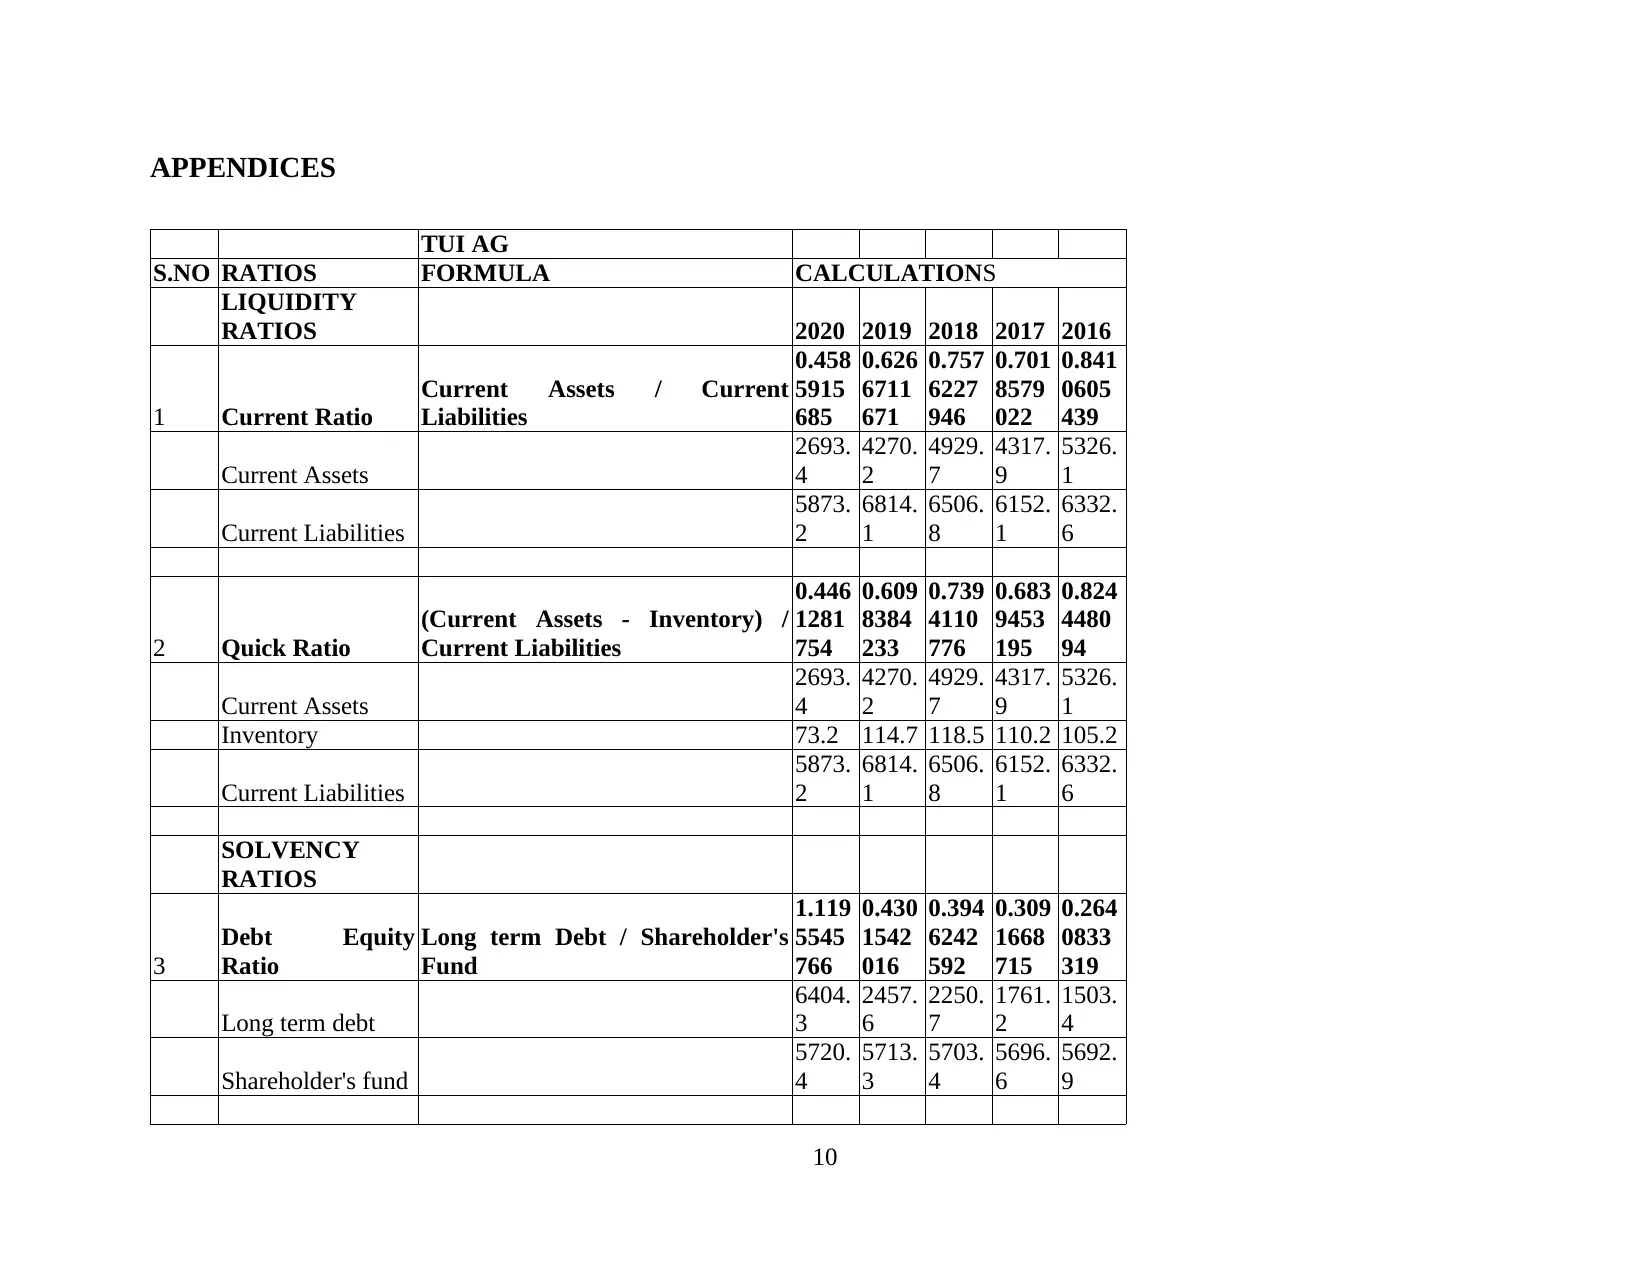
Calculation of the ratios
Interpretation of the ratios Current ratio- The current ratio of the company shows the liquidity position of the business through the ability of it to make
the short term liabilities and obligations through the current assets that re possessed by the business. From the above table it
can be observed that the current ratio of the company in the last five years has never been 1 or above 1 and this is the reason it
can be ascertained that the company TUI AG has been facing tight liquidity spot all over these years. It can also evidently be
noticed that the current ratio has significantly lowered down from 2016 where it was 0.84 to 2020 where it is 0.45. the ratio has
1
The financial analysis of the company can be done through using the various techniques of the management accounting that
can ascertain the current position of the business which is affected by the various financial and the non-financial indicators of the
company. The current project shall be disclosing the financial analysis of the company through undertaking the ratio analysis of the
last five-year's data showing the financial, liquidity and the efficiency position of the company. Apart from that it shall be highlighting
the four perspectives analysis of the balance scorecard. Further the other areas like the strategic management and the external and
internal legal environment of the company shall be reflected in the report.
ABOUT THE COMPANY
TUI AG is the German multinational travel and tourism company that was founded in the year 1923 and is headquartered in
Hanover, Germany. It is one of the world's largest travel and tourism companies which has it own travel agencies, cruise ships,
airlines, hotels and the other retail outlets to carry out the operations of the company (TUI Group, 2021). The leisure company has
over the years established successful partnerships, mergers which has spread the market of the company in multiple countries round
the world. It is also gained the competitive advantage through the horizontal and the vertical integration wherein they generated
ownership in maximum properties further boosting the profitability and growth of the company.
RATIO ANALYSIS
Calculation of the ratios
Interpretation of the ratios Current ratio- The current ratio of the company shows the liquidity position of the business through the ability of it to make
the short term liabilities and obligations through the current assets that re possessed by the business. From the above table it
can be observed that the current ratio of the company in the last five years has never been 1 or above 1 and this is the reason it
can be ascertained that the company TUI AG has been facing tight liquidity spot all over these years. It can also evidently be
noticed that the current ratio has significantly lowered down from 2016 where it was 0.84 to 2020 where it is 0.45. the ratio has
1
Secure Best Marks with AI Grader
Need help grading? Try our AI Grader for instant feedback on your assignments.
almost became half and so it can be assessed that the company is in vulnerable condition whereby the credibility of it is
decreasing. Quick ratio- The quick ratio of he company depicts the availability of highly liquid assets that are easily convertible to cash for
meeting the current liabilities that is the short term obligations that are to be arisen within a period of one year. This also shows
the liquidity position of the business in the very short term. From the above ratio analysis it can be inferred that the quick ratio
of the company has decreased over the period of last five years making it difficult foe the company to maintains its credibility
in the lending market. Debt-equity ratio – The debt equity ratio of the company shows the capital structure and the proportion of owned and
borrowed funds that are used by the company. The equity funds that are acquired by the business shall be diluting the
ownership and power of decision-making (Martin, Yadiati and Pratama, 2018). On the contrary the debt funds shall be
imposing fixed financial charges on the business. In the current scenario it can be evaluated that the debt equity ratio in 2016
was 0.26 which has rose to 1.12 in 2020. This shows that over the years the company TUI has included larger debt funds in
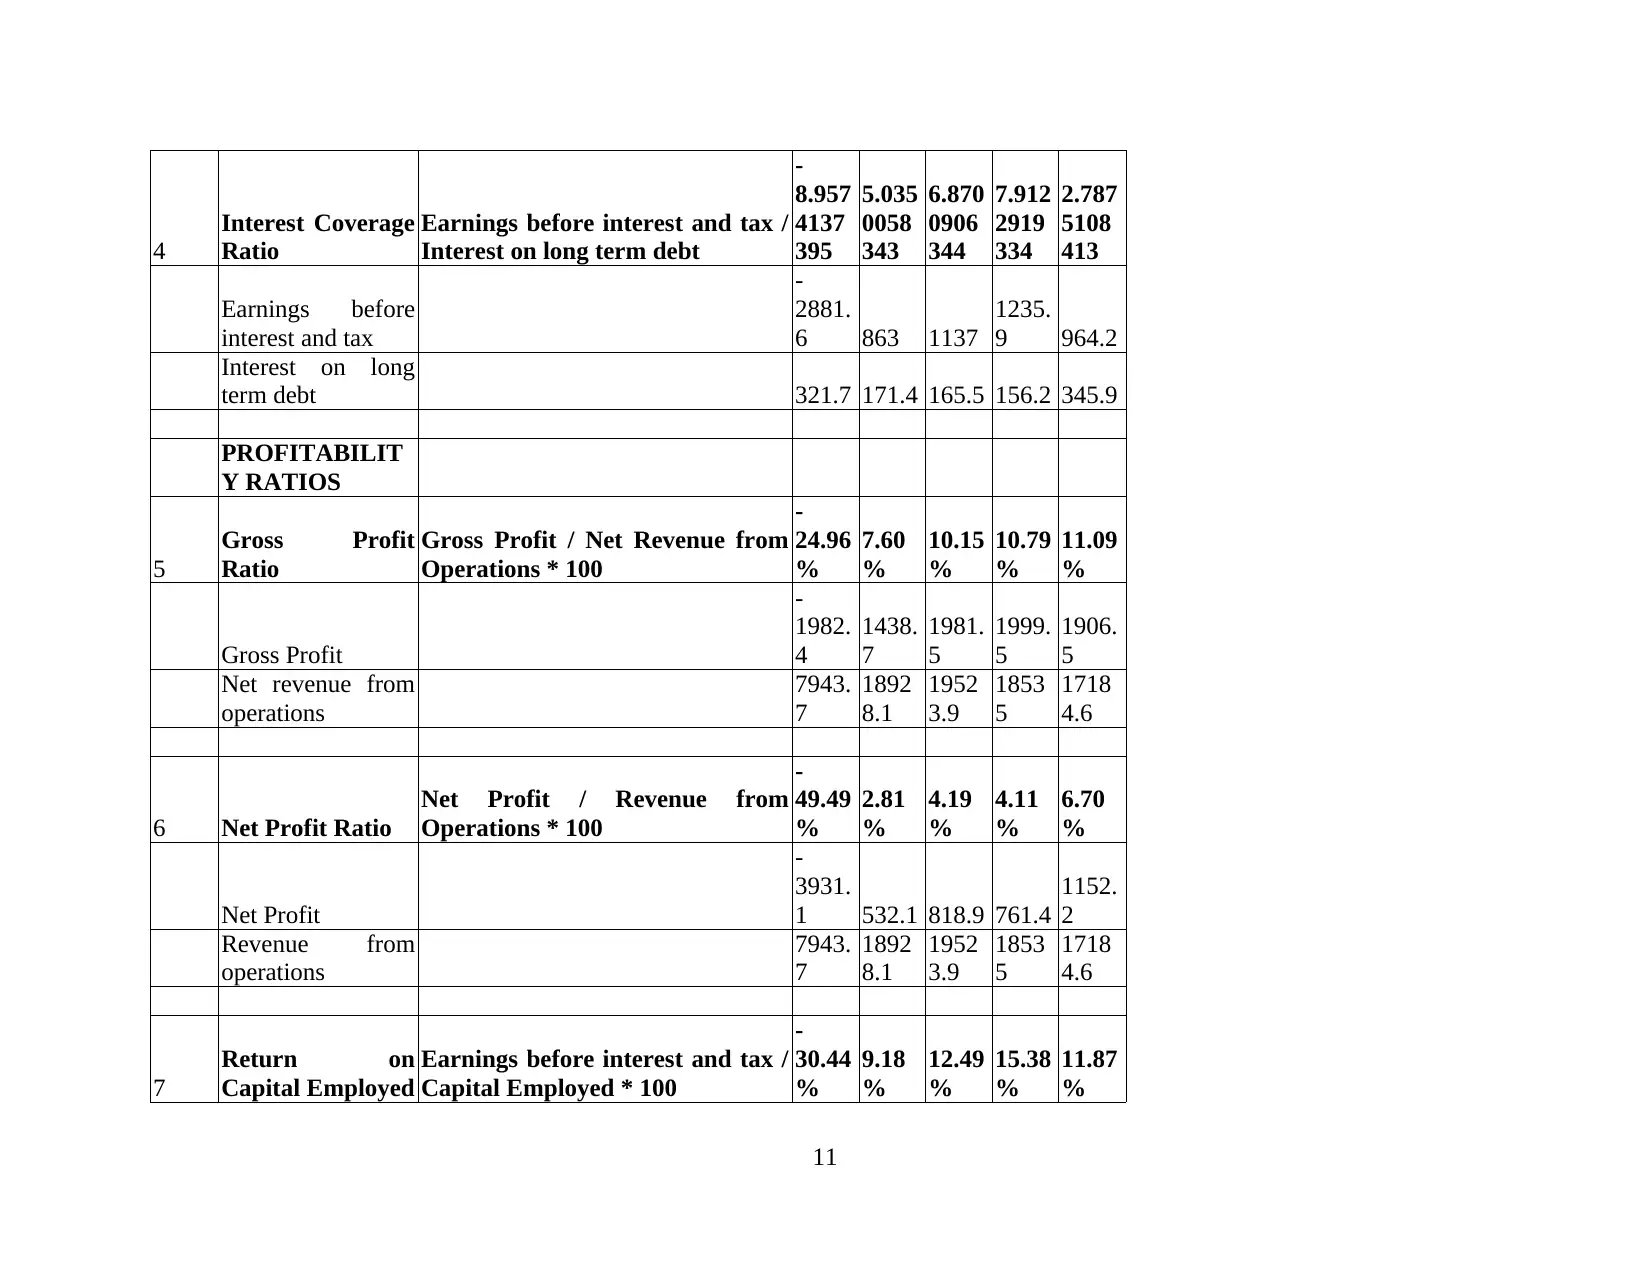
order to include leverage the business and since interest is tax-deductible expense. Interest coverage ratio – The interest coverage ratio shows the availability of earnings with the company to meet the interest
expense of the business. This shows the number of times the earning capacity as to the amount of interest so that the debts and
obligations of the business can be timely and efficiently be met. The above financial analysis of the company shows that in
2016 such ratio was 2.7 which increased to 5.03 in the year 2019. this was due to significantly improving profitability position
and simultaneously decreasing cost of the business. It can further be evaluated that such ratio in 2020 fell to -8.9 and this was
pertaining to the outbreak of corona pandemic in which the travel and got hit badly. Gross profit ratio – The gross profit ratio of the company shows the efficiency with which the operations of the business are
conducted. The gross profit margin of the company can be enhanced through decreasing the cost of operations undertaken to
process the routine operations in the company. The above table demonstrates that the gross profit ratio of TUI AG has
2
decreasing. Quick ratio- The quick ratio of he company depicts the availability of highly liquid assets that are easily convertible to cash for
meeting the current liabilities that is the short term obligations that are to be arisen within a period of one year. This also shows
the liquidity position of the business in the very short term. From the above ratio analysis it can be inferred that the quick ratio
of the company has decreased over the period of last five years making it difficult foe the company to maintains its credibility
in the lending market. Debt-equity ratio – The debt equity ratio of the company shows the capital structure and the proportion of owned and
borrowed funds that are used by the company. The equity funds that are acquired by the business shall be diluting the
ownership and power of decision-making (Martin, Yadiati and Pratama, 2018). On the contrary the debt funds shall be
imposing fixed financial charges on the business. In the current scenario it can be evaluated that the debt equity ratio in 2016
was 0.26 which has rose to 1.12 in 2020. This shows that over the years the company TUI has included larger debt funds in
order to include leverage the business and since interest is tax-deductible expense. Interest coverage ratio – The interest coverage ratio shows the availability of earnings with the company to meet the interest
expense of the business. This shows the number of times the earning capacity as to the amount of interest so that the debts and
obligations of the business can be timely and efficiently be met. The above financial analysis of the company shows that in
2016 such ratio was 2.7 which increased to 5.03 in the year 2019. this was due to significantly improving profitability position
and simultaneously decreasing cost of the business. It can further be evaluated that such ratio in 2020 fell to -8.9 and this was
pertaining to the outbreak of corona pandemic in which the travel and got hit badly. Gross profit ratio – The gross profit ratio of the company shows the efficiency with which the operations of the business are
conducted. The gross profit margin of the company can be enhanced through decreasing the cost of operations undertaken to
process the routine operations in the company. The above table demonstrates that the gross profit ratio of TUI AG has
2
constantly faced a downfall since 2016 when it was 11.09 to -24.96 in 2020. It can be assessed that this is due to the increasing
cost per unit due to non-attainment of economies of scale. This has contributed to increase in the cost and decrease in the
profitability. Net profit ratio- The net profit ratio of the company shows the net earnings of the business that are available for the
shareholder's as a percentage of the sales that are done by the company. The main objective of the company is to maximize the
net profit ratio of the company so that the both the objectives of the profitability and the wealth maximization of the
shareholder's can be achieved by the company. In the current scenario it can be analysed that for the TUI group the net profit
margin of the company is constantly decreasing from the year 2016 which was 6.70% to -49.49% in 2020. It can be analysed
that this shows the poorest profitability position of the business which can be because of the increased expenditures and the
indirect costs of the business. Return on capital employed- The return on capital employed ratio of the company shows the efficiency with which the capital
of the company is employed in the business to maximize the earning capacity of the business. It can be observed that from the
year 2016 to 2018 this ratio of the company increased from 11.87% to 12.49%. But it can be seen in the last two consecutive
years the ratio for the company has decreased and the reason can be the stagnation pertaining to the Covid-19 situation that is
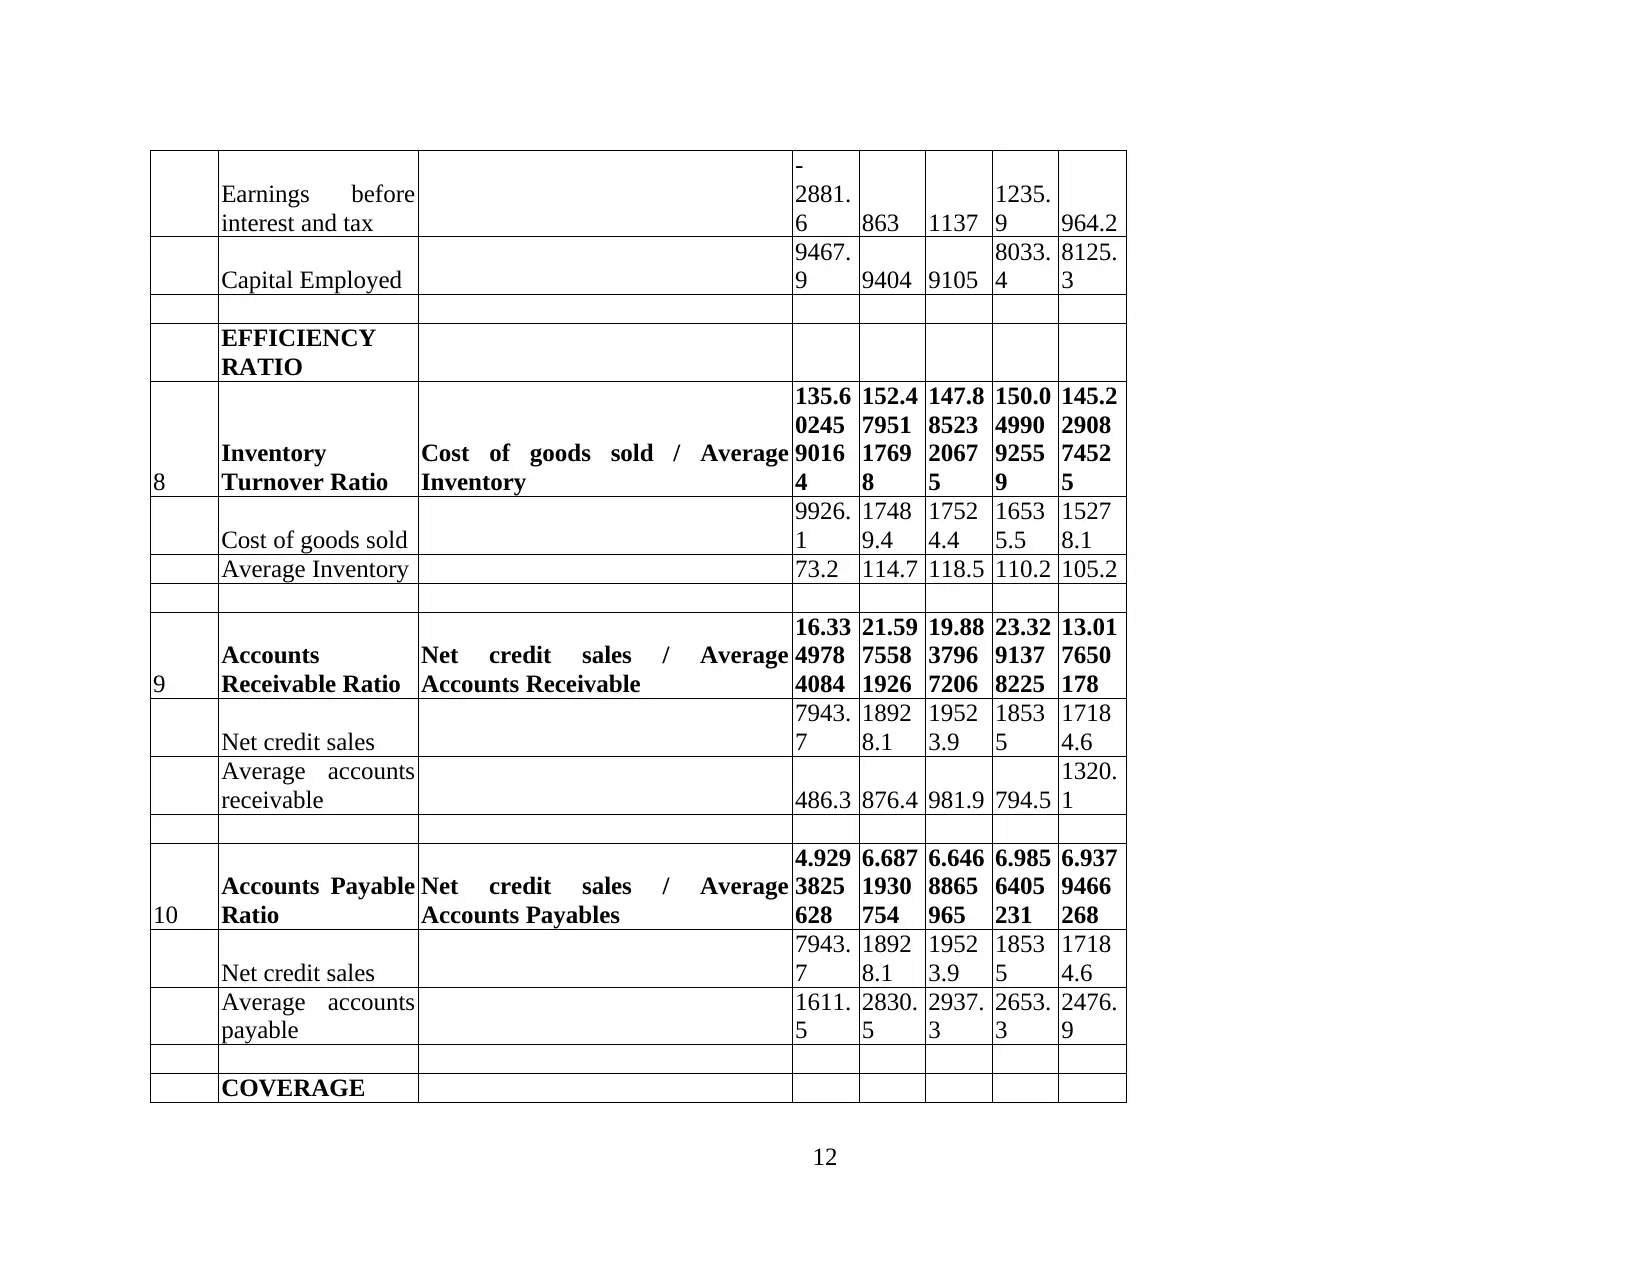
not working in the favour of the company as the leisure activities have completely been postponed. Inventory turnover ratio- This ratio shall be measuring the number of times the inventory is used in the year showing the
efficiency with which the inventory is used in the business. This ratio in the company is not following a particular trend but is
constantly moving up and down but with not a significant margin. But in the current year comparatively the inventory turnover
ratio is the lowest at 135.6 times due to the significantly lowering down of the operations of the business. Accounts receivable ratio- The accounts receivable ratio shows the amount of the credit sales as the percentage of the total
sales in the business. This ratio of the company is also of major significance for the affairs of the company. It can be assessed
3
cost per unit due to non-attainment of economies of scale. This has contributed to increase in the cost and decrease in the
profitability. Net profit ratio- The net profit ratio of the company shows the net earnings of the business that are available for the
shareholder's as a percentage of the sales that are done by the company. The main objective of the company is to maximize the
net profit ratio of the company so that the both the objectives of the profitability and the wealth maximization of the
shareholder's can be achieved by the company. In the current scenario it can be analysed that for the TUI group the net profit
margin of the company is constantly decreasing from the year 2016 which was 6.70% to -49.49% in 2020. It can be analysed
that this shows the poorest profitability position of the business which can be because of the increased expenditures and the
indirect costs of the business. Return on capital employed- The return on capital employed ratio of the company shows the efficiency with which the capital
of the company is employed in the business to maximize the earning capacity of the business. It can be observed that from the
year 2016 to 2018 this ratio of the company increased from 11.87% to 12.49%. But it can be seen in the last two consecutive
years the ratio for the company has decreased and the reason can be the stagnation pertaining to the Covid-19 situation that is
not working in the favour of the company as the leisure activities have completely been postponed. Inventory turnover ratio- This ratio shall be measuring the number of times the inventory is used in the year showing the
efficiency with which the inventory is used in the business. This ratio in the company is not following a particular trend but is
constantly moving up and down but with not a significant margin. But in the current year comparatively the inventory turnover
ratio is the lowest at 135.6 times due to the significantly lowering down of the operations of the business. Accounts receivable ratio- The accounts receivable ratio shows the amount of the credit sales as the percentage of the total
sales in the business. This ratio of the company is also of major significance for the affairs of the company. It can be assessed
3
that for the TUI group the ratio has increased over the last few years but has lowered down in the previous years as the average
accounts receivable this year is high since the liquidity is very limited. Accounts payable ratio- This ratio shall be showing the amount that is due at the end of the year as the proportion of the net
credit purchases that are undertaken by the company during the operations of the company. This ratio shall be balanced as if its
more than its shows the less creditworthiness of the business. From the above table of ratio analysis it can be observed that the
company's accounts payable ratio for the year has decreased over the years which is a positive sign for the performance of the
company.
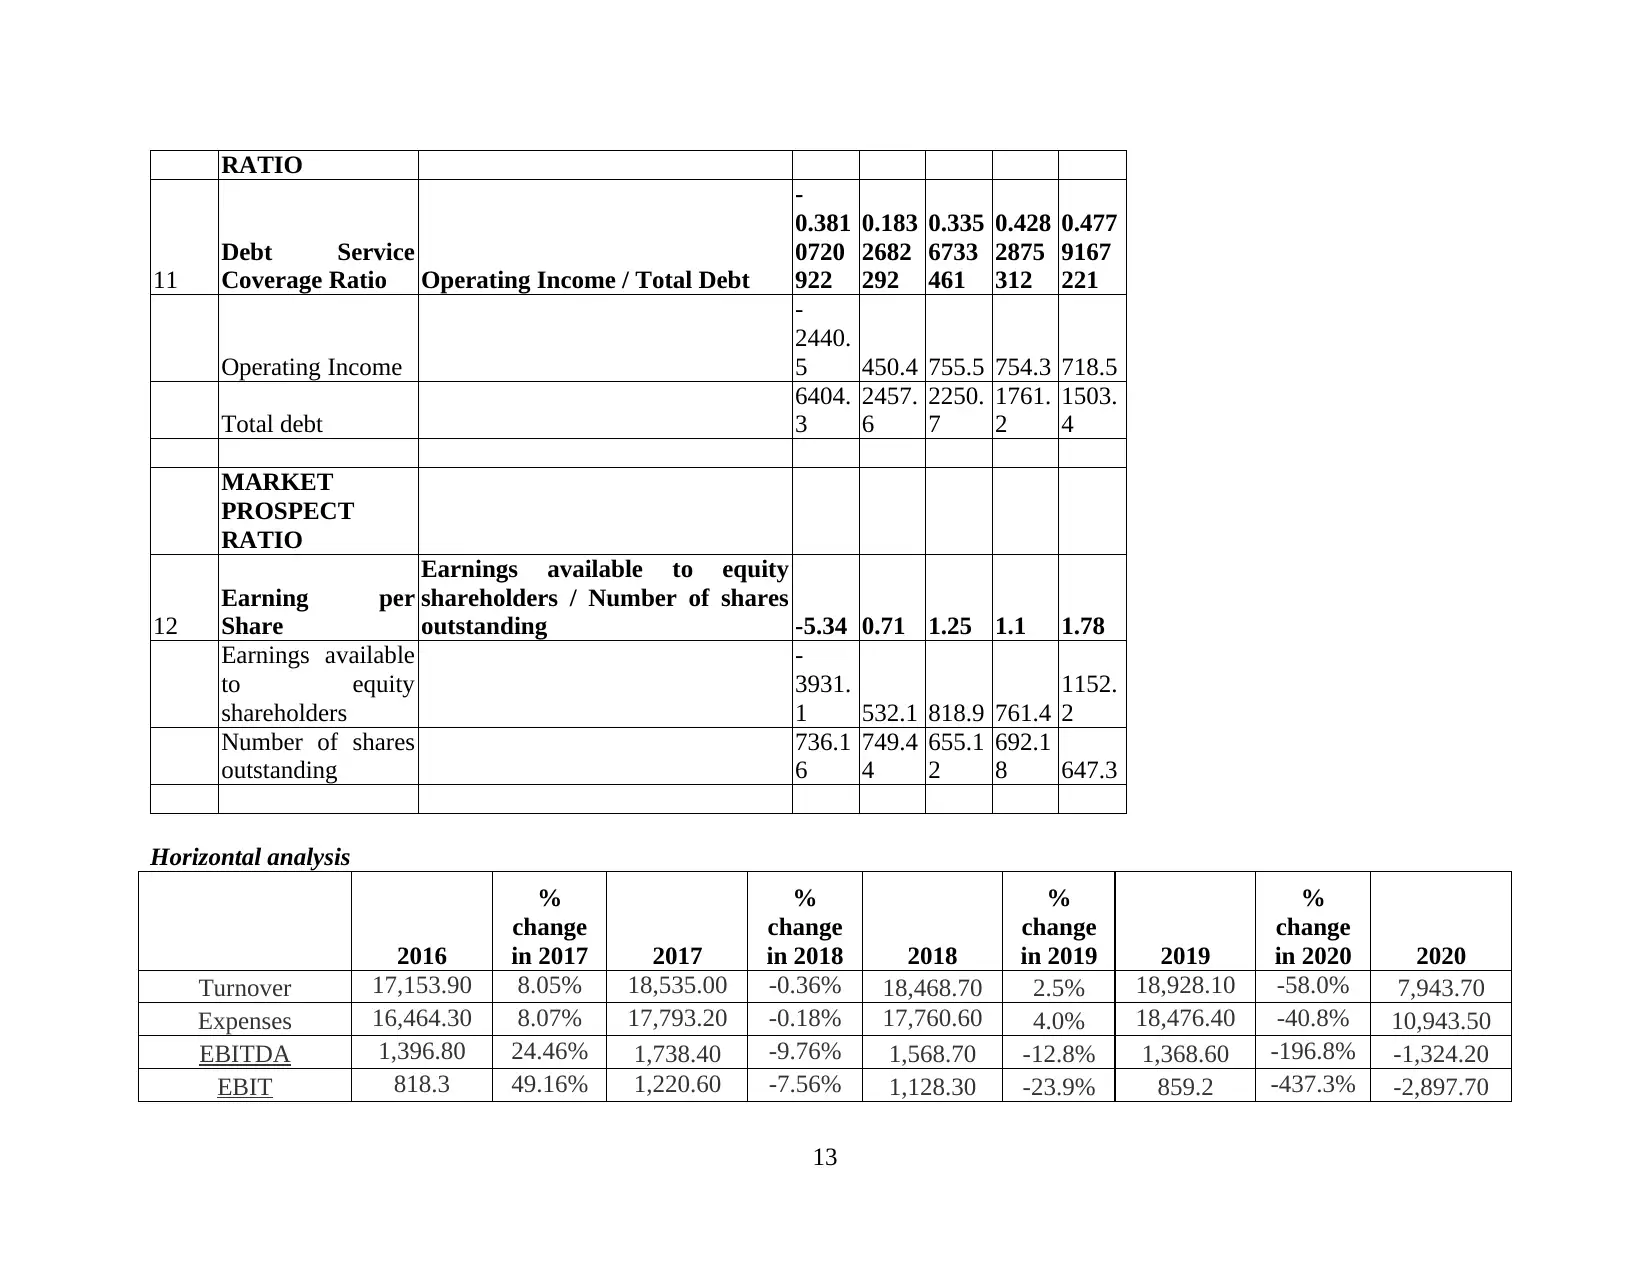
Earnings per share- The earnings per share of the company shows that the amount that is available for the payment to the
shareholders of the company. This amount is available for the payment as dividends to the shareholders of the company and if
it is not paid then this amount shall be retained in the company as retained earnings which shall be used in the future affairs of
the business. This ratio of the company has significantly lowered down and the reason is that the net earnings generated from
the operations of the company is also lowered down.
Limitations of Ratio analysis
One of the major limitations is that it takes into account the past figures and shows the historic data evaluation and gives no
idea pertaining to the future.
It takes into account the quantitative aspects of the organization and avoids the human element or the other qualitative factors.
It does not consider the external factors of the company like the recession in the economy, natural disasters or the pandemic.
BALANCE SCORECARD
Four perspectives analysis of the balance score cards Learning and growth- The learning and growth perspective of the balance scorecard shows the internal abilities of the
business in terms of the human capital, technology, innovative strategies, information etc. These resources of the business can
4
accounts receivable this year is high since the liquidity is very limited. Accounts payable ratio- This ratio shall be showing the amount that is due at the end of the year as the proportion of the net
credit purchases that are undertaken by the company during the operations of the company. This ratio shall be balanced as if its
more than its shows the less creditworthiness of the business. From the above table of ratio analysis it can be observed that the
company's accounts payable ratio for the year has decreased over the years which is a positive sign for the performance of the
company.
Earnings per share- The earnings per share of the company shows that the amount that is available for the payment to the
shareholders of the company. This amount is available for the payment as dividends to the shareholders of the company and if
it is not paid then this amount shall be retained in the company as retained earnings which shall be used in the future affairs of
the business. This ratio of the company has significantly lowered down and the reason is that the net earnings generated from
the operations of the company is also lowered down.
Limitations of Ratio analysis
One of the major limitations is that it takes into account the past figures and shows the historic data evaluation and gives no
idea pertaining to the future.
It takes into account the quantitative aspects of the organization and avoids the human element or the other qualitative factors.
It does not consider the external factors of the company like the recession in the economy, natural disasters or the pandemic.
BALANCE SCORECARD
Four perspectives analysis of the balance score cards Learning and growth- The learning and growth perspective of the balance scorecard shows the internal abilities of the
business in terms of the human capital, technology, innovative strategies, information etc. These resources of the business can
4
Paraphrase This Document
Need a fresh take? Get an instant paraphrase of this document with our AI Paraphraser
be used to capitalize on the opportunities that are provided in the market. TUI has the best lot of these resources as it has one of
the most efficient human capitals, high tech equipments, strong research and development department etc. Internal business processes- This describes the efficiency of the operations that are undertaken by the company (Restianti and
Agustina, 2018). The optimization of the processes, modification in the techniques and advancement of the technology shall be
leading to the attainment of the economies of scale and thereby are supposed to reduce the price per unit of the operations
causing their efficiency in the business. Customer- This perspective of the business shall be identifying the needs and wants of the customers that are retained with the
company. For any company it is important to focus on the existing and the potential level of customers that are there with the
company. TUI focuses on providing the best possible services to enhance the customer experience and satisfaction so that they
retain for long with the company. It provides them with the customized services, offers and deals, discounts, loyalty cards,
surprises and the various after sale services.
Financial- The financial position of the company and the availability of these funds is one of the crucial requirements of the
businesses. This can only decide upon the future activities of the business and also that they can invest in the various future
investment plans of the company. The finances are the life blood of the business and so it helps the company in featuring in the
various long term growth plans (What is a Balanced Scorecard? 2021). Using these financial resources TUI AG have owned
all the major properties in terms of hotels, cruises, airlines etc.
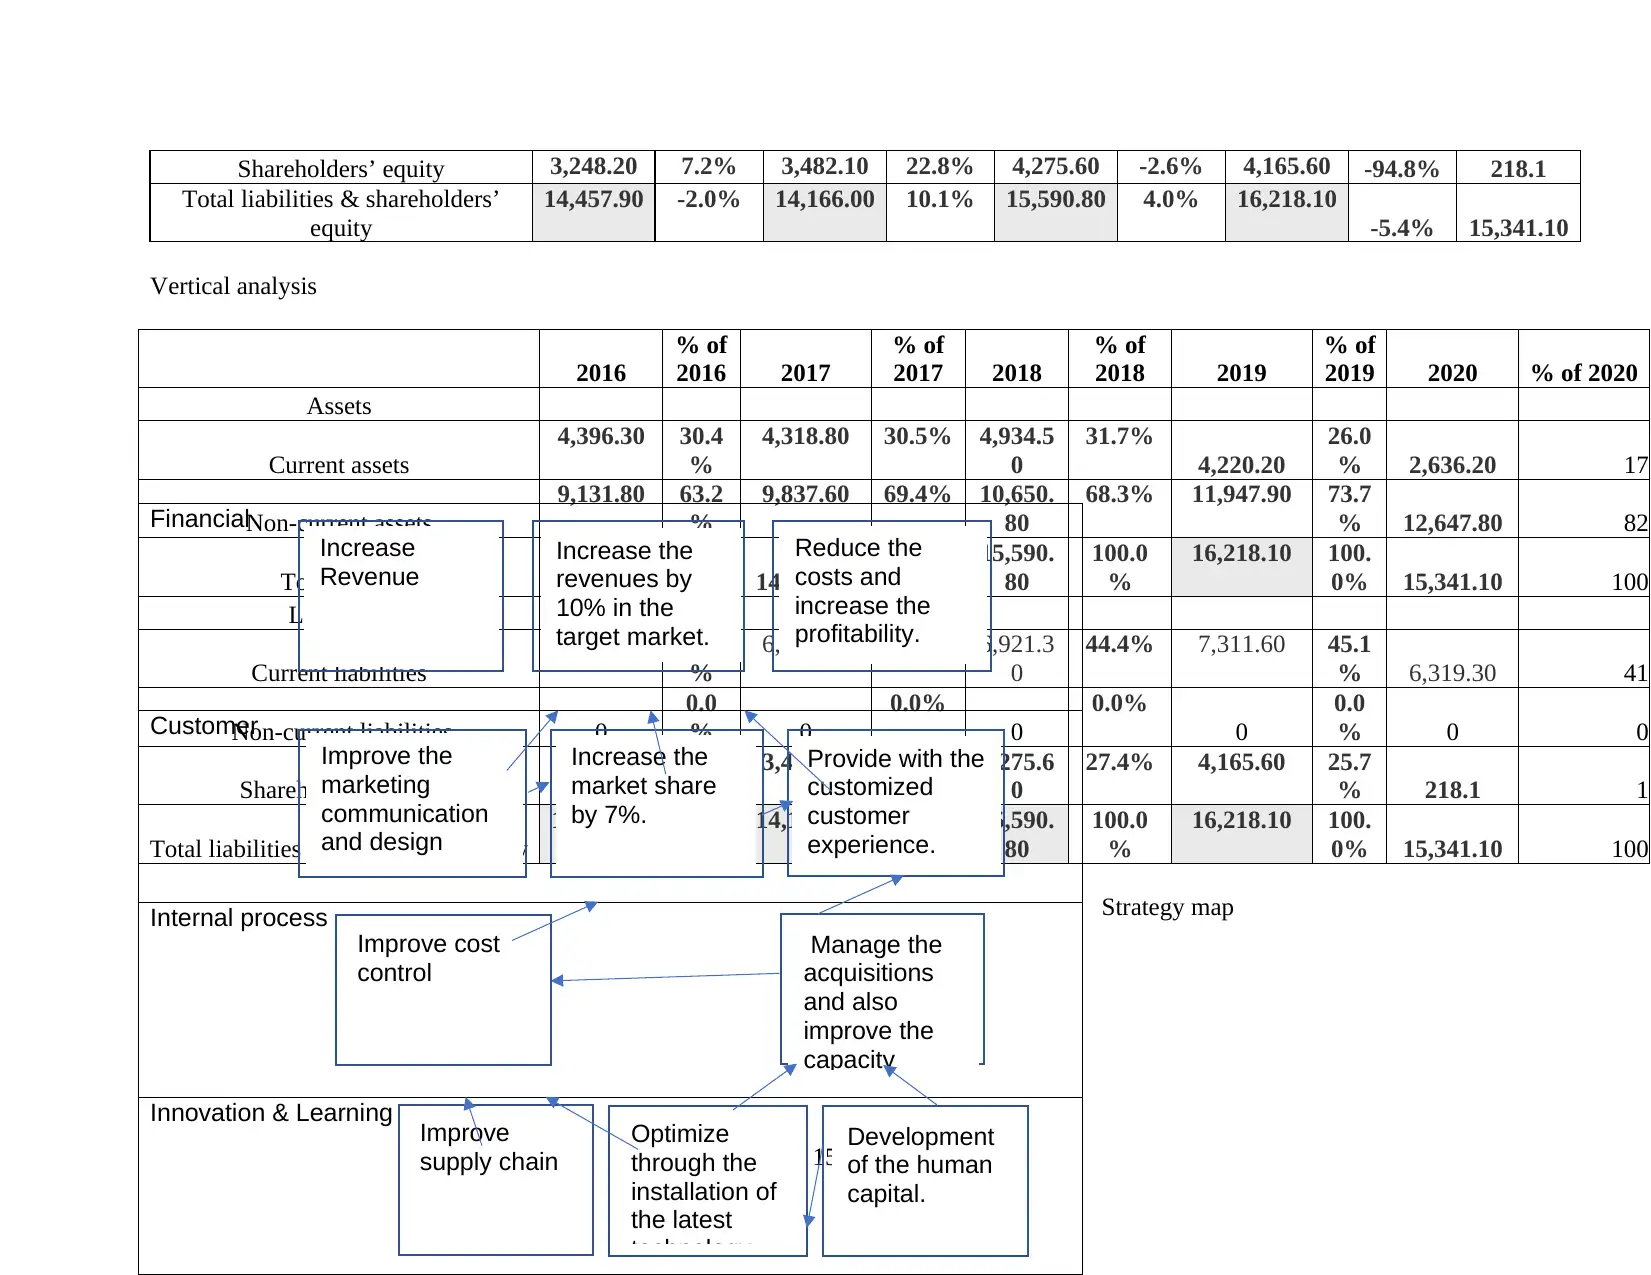
These four perspectives are kept in mind and the goals and objectives of the business are reviewed to frame the successful
strategic map that helps in the successful affairs of the business and the competitive advantage is generated in the industry and this is
the reason it is able to build the value of its brand (Pramono and et.al., 2020). Then based on all of these four perspectives the
management shall be evaluating the objectives, measures, initiatives and the targets and this shall help the business in successfully
formulating the strategies for the business.
5
the most efficient human capitals, high tech equipments, strong research and development department etc. Internal business processes- This describes the efficiency of the operations that are undertaken by the company (Restianti and
Agustina, 2018). The optimization of the processes, modification in the techniques and advancement of the technology shall be
leading to the attainment of the economies of scale and thereby are supposed to reduce the price per unit of the operations
causing their efficiency in the business. Customer- This perspective of the business shall be identifying the needs and wants of the customers that are retained with the
company. For any company it is important to focus on the existing and the potential level of customers that are there with the
company. TUI focuses on providing the best possible services to enhance the customer experience and satisfaction so that they
retain for long with the company. It provides them with the customized services, offers and deals, discounts, loyalty cards,
surprises and the various after sale services.
Financial- The financial position of the company and the availability of these funds is one of the crucial requirements of the
businesses. This can only decide upon the future activities of the business and also that they can invest in the various future
investment plans of the company. The finances are the life blood of the business and so it helps the company in featuring in the
various long term growth plans (What is a Balanced Scorecard? 2021). Using these financial resources TUI AG have owned
all the major properties in terms of hotels, cruises, airlines etc.
These four perspectives are kept in mind and the goals and objectives of the business are reviewed to frame the successful
strategic map that helps in the successful affairs of the business and the competitive advantage is generated in the industry and this is
the reason it is able to build the value of its brand (Pramono and et.al., 2020). Then based on all of these four perspectives the
management shall be evaluating the objectives, measures, initiatives and the targets and this shall help the business in successfully
formulating the strategies for the business.
5
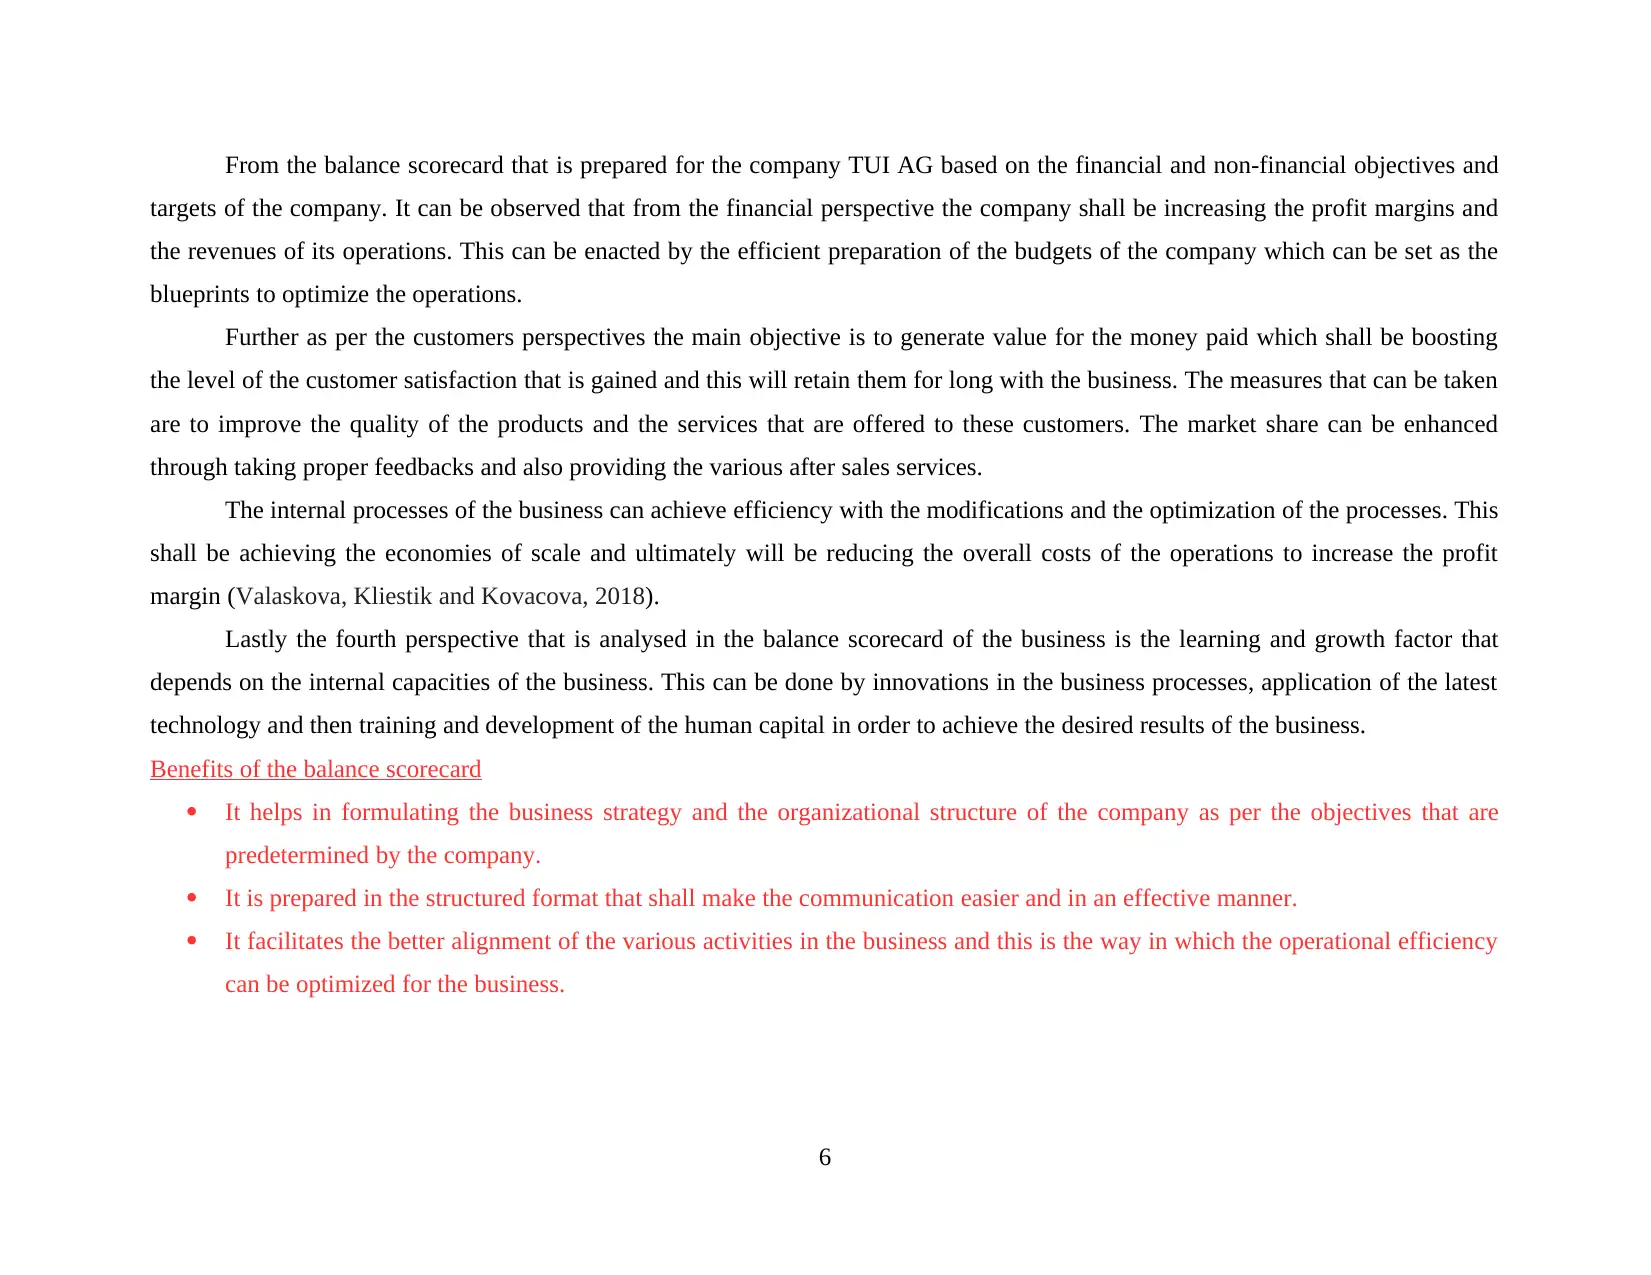
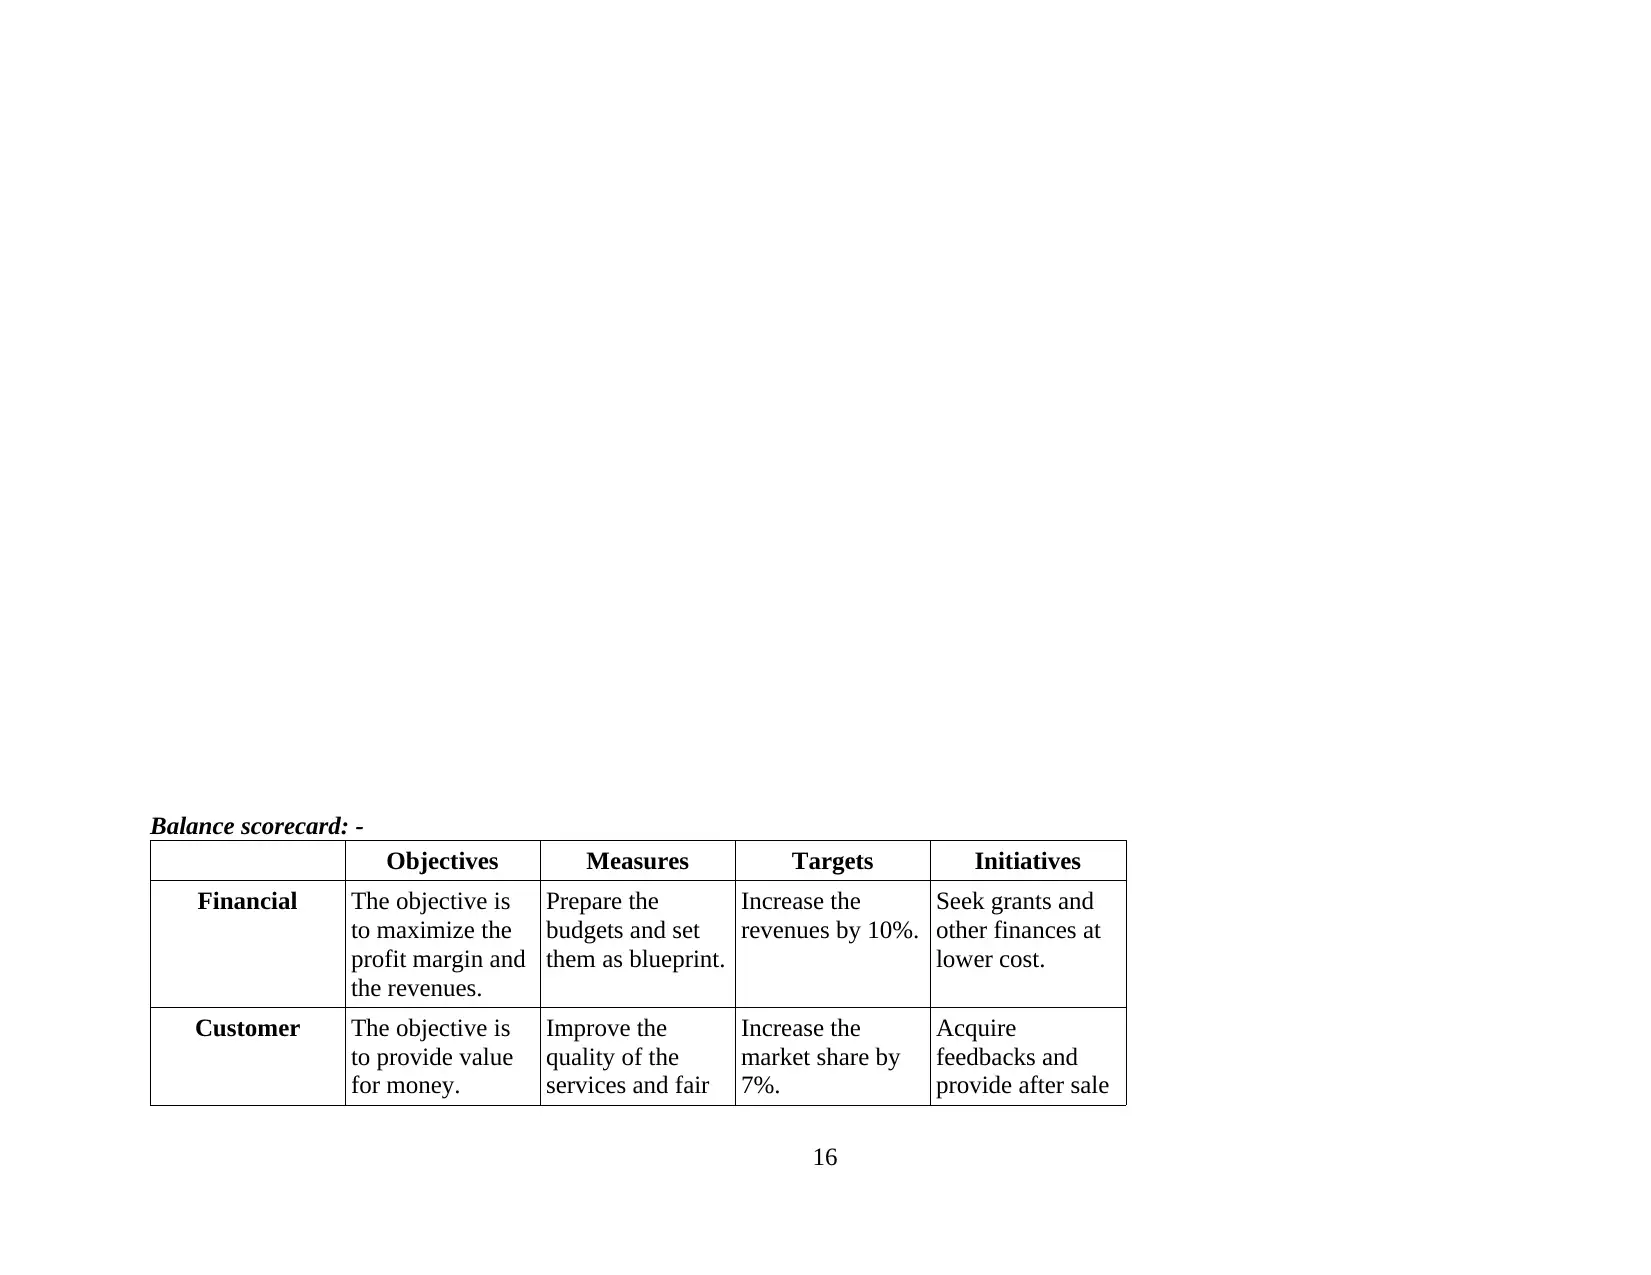
From the balance scorecard that is prepared for the company TUI AG based on the financial and non-financial objectives and
targets of the company. It can be observed that from the financial perspective the company shall be increasing the profit margins and
the revenues of its operations. This can be enacted by the efficient preparation of the budgets of the company which can be set as the
blueprints to optimize the operations.
Further as per the customers perspectives the main objective is to generate value for the money paid which shall be boosting
the level of the customer satisfaction that is gained and this will retain them for long with the business. The measures that can be taken
are to improve the quality of the products and the services that are offered to these customers. The market share can be enhanced
through taking proper feedbacks and also providing the various after sales services.
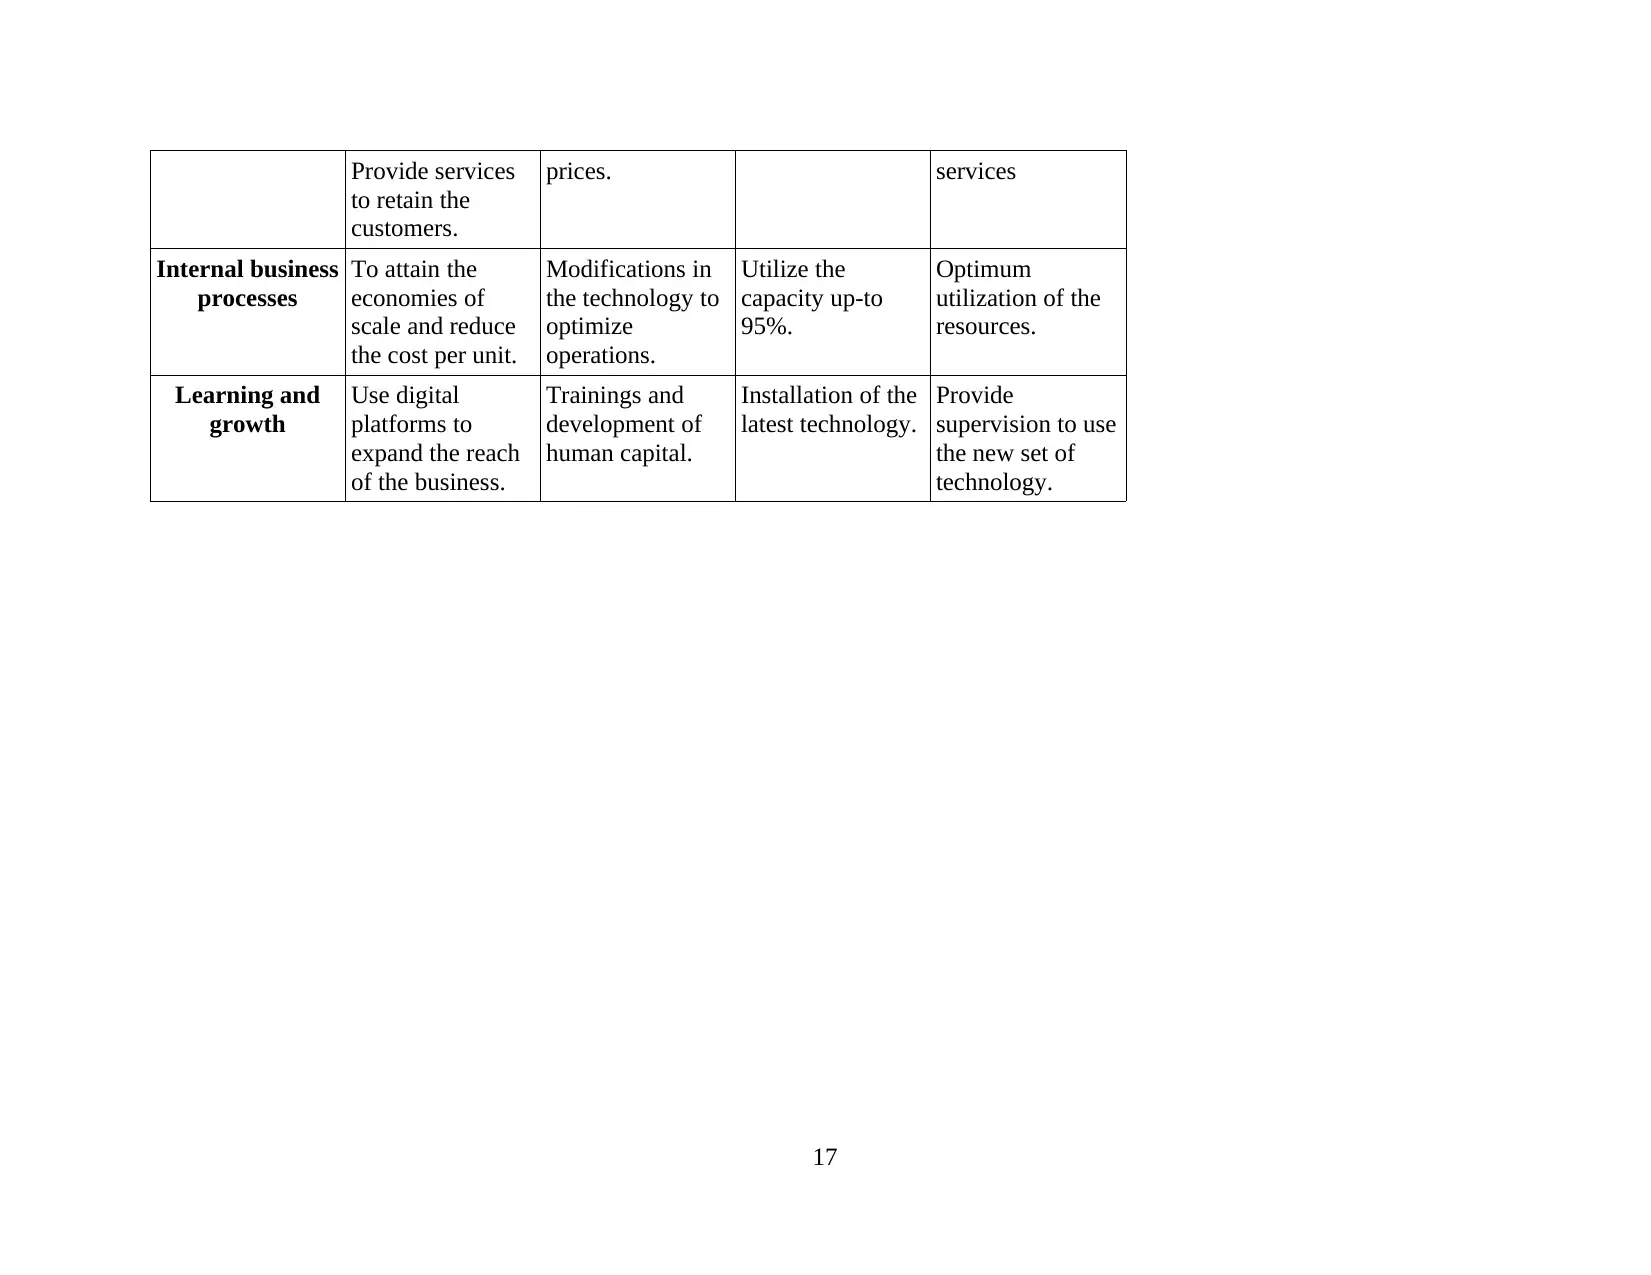
The internal processes of the business can achieve efficiency with the modifications and the optimization of the processes. This
shall be achieving the economies of scale and ultimately will be reducing the overall costs of the operations to increase the profit
margin (Valaskova, Kliestik and Kovacova, 2018).
Lastly the fourth perspective that is analysed in the balance scorecard of the business is the learning and growth factor that
depends on the internal capacities of the business. This can be done by innovations in the business processes, application of the latest
technology and then training and development of the human capital in order to achieve the desired results of the business.
Benefits of the balance scorecard
It helps in formulating the business strategy and the organizational structure of the company as per the objectives that are
predetermined by the company.
It is prepared in the structured format that shall make the communication easier and in an effective manner.
It facilitates the better alignment of the various activities in the business and this is the way in which the operational efficiency
can be optimized for the business.
6
targets of the company. It can be observed that from the financial perspective the company shall be increasing the profit margins and
the revenues of its operations. This can be enacted by the efficient preparation of the budgets of the company which can be set as the
blueprints to optimize the operations.
Further as per the customers perspectives the main objective is to generate value for the money paid which shall be boosting
the level of the customer satisfaction that is gained and this will retain them for long with the business. The measures that can be taken
are to improve the quality of the products and the services that are offered to these customers. The market share can be enhanced
through taking proper feedbacks and also providing the various after sales services.
The internal processes of the business can achieve efficiency with the modifications and the optimization of the processes. This
shall be achieving the economies of scale and ultimately will be reducing the overall costs of the operations to increase the profit
margin (Valaskova, Kliestik and Kovacova, 2018).
Lastly the fourth perspective that is analysed in the balance scorecard of the business is the learning and growth factor that
depends on the internal capacities of the business. This can be done by innovations in the business processes, application of the latest
technology and then training and development of the human capital in order to achieve the desired results of the business.
Benefits of the balance scorecard
It helps in formulating the business strategy and the organizational structure of the company as per the objectives that are
predetermined by the company.
It is prepared in the structured format that shall make the communication easier and in an effective manner.
It facilitates the better alignment of the various activities in the business and this is the way in which the operational efficiency
can be optimized for the business.
6
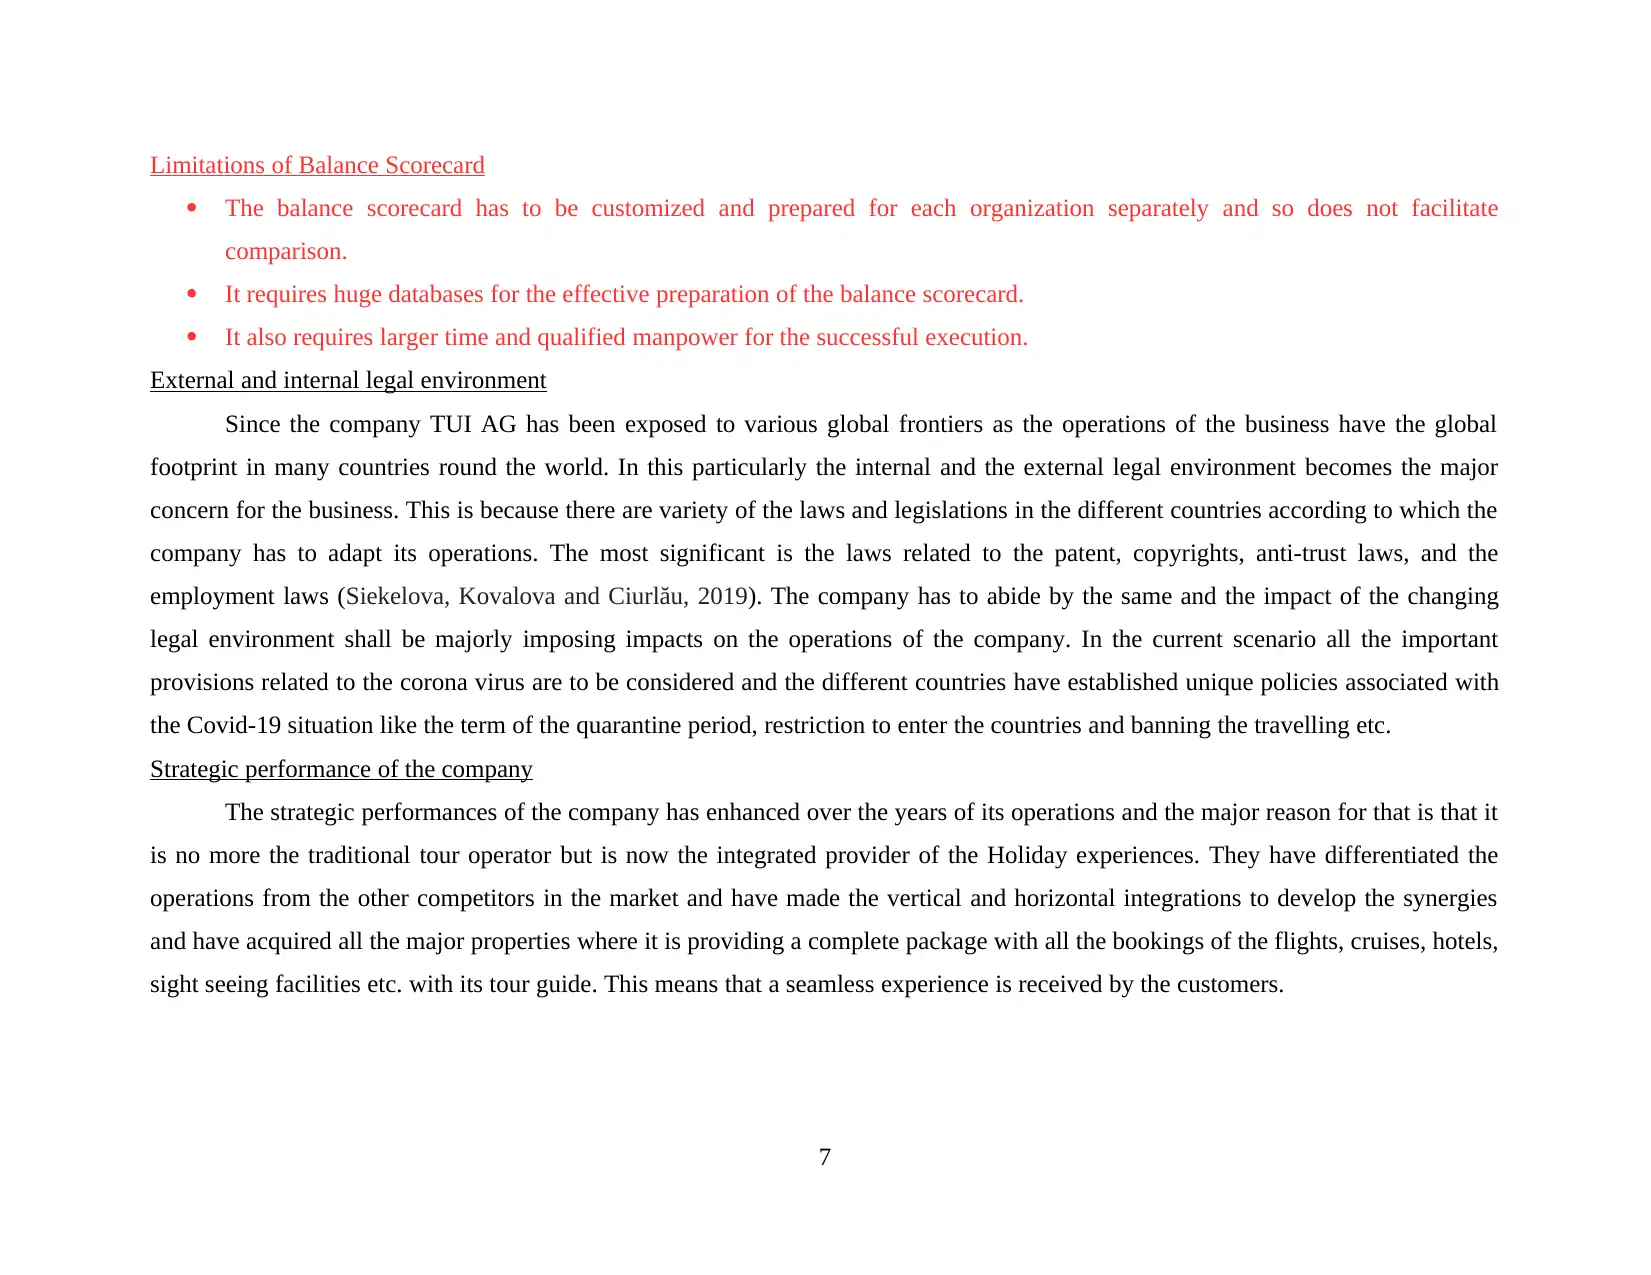
Limitations of Balance Scorecard
The balance scorecard has to be customized and prepared for each organization separately and so does not facilitate
comparison.
It requires huge databases for the effective preparation of the balance scorecard.
It also requires larger time and qualified manpower for the successful execution.
External and internal legal environment
Since the company TUI AG has been exposed to various global frontiers as the operations of the business have the global
footprint in many countries round the world. In this particularly the internal and the external legal environment becomes the major
concern for the business. This is because there are variety of the laws and legislations in the different countries according to which the
company has to adapt its operations. The most significant is the laws related to the patent, copyrights, anti-trust laws, and the
employment laws (Siekelova, Kovalova and Ciurlău, 2019). The company has to abide by the same and the impact of the changing
legal environment shall be majorly imposing impacts on the operations of the company. In the current scenario all the important
provisions related to the corona virus are to be considered and the different countries have established unique policies associated with
the Covid-19 situation like the term of the quarantine period, restriction to enter the countries and banning the travelling etc.
Strategic performance of the company
The strategic performances of the company has enhanced over the years of its operations and the major reason for that is that it
is no more the traditional tour operator but is now the integrated provider of the Holiday experiences. They have differentiated the
operations from the other competitors in the market and have made the vertical and horizontal integrations to develop the synergies
and have acquired all the major properties where it is providing a complete package with all the bookings of the flights, cruises, hotels,
sight seeing facilities etc. with its tour guide. This means that a seamless experience is received by the customers.
7
Secure Best Marks with AI Grader
Need help grading? Try our AI Grader for instant feedback on your assignments.
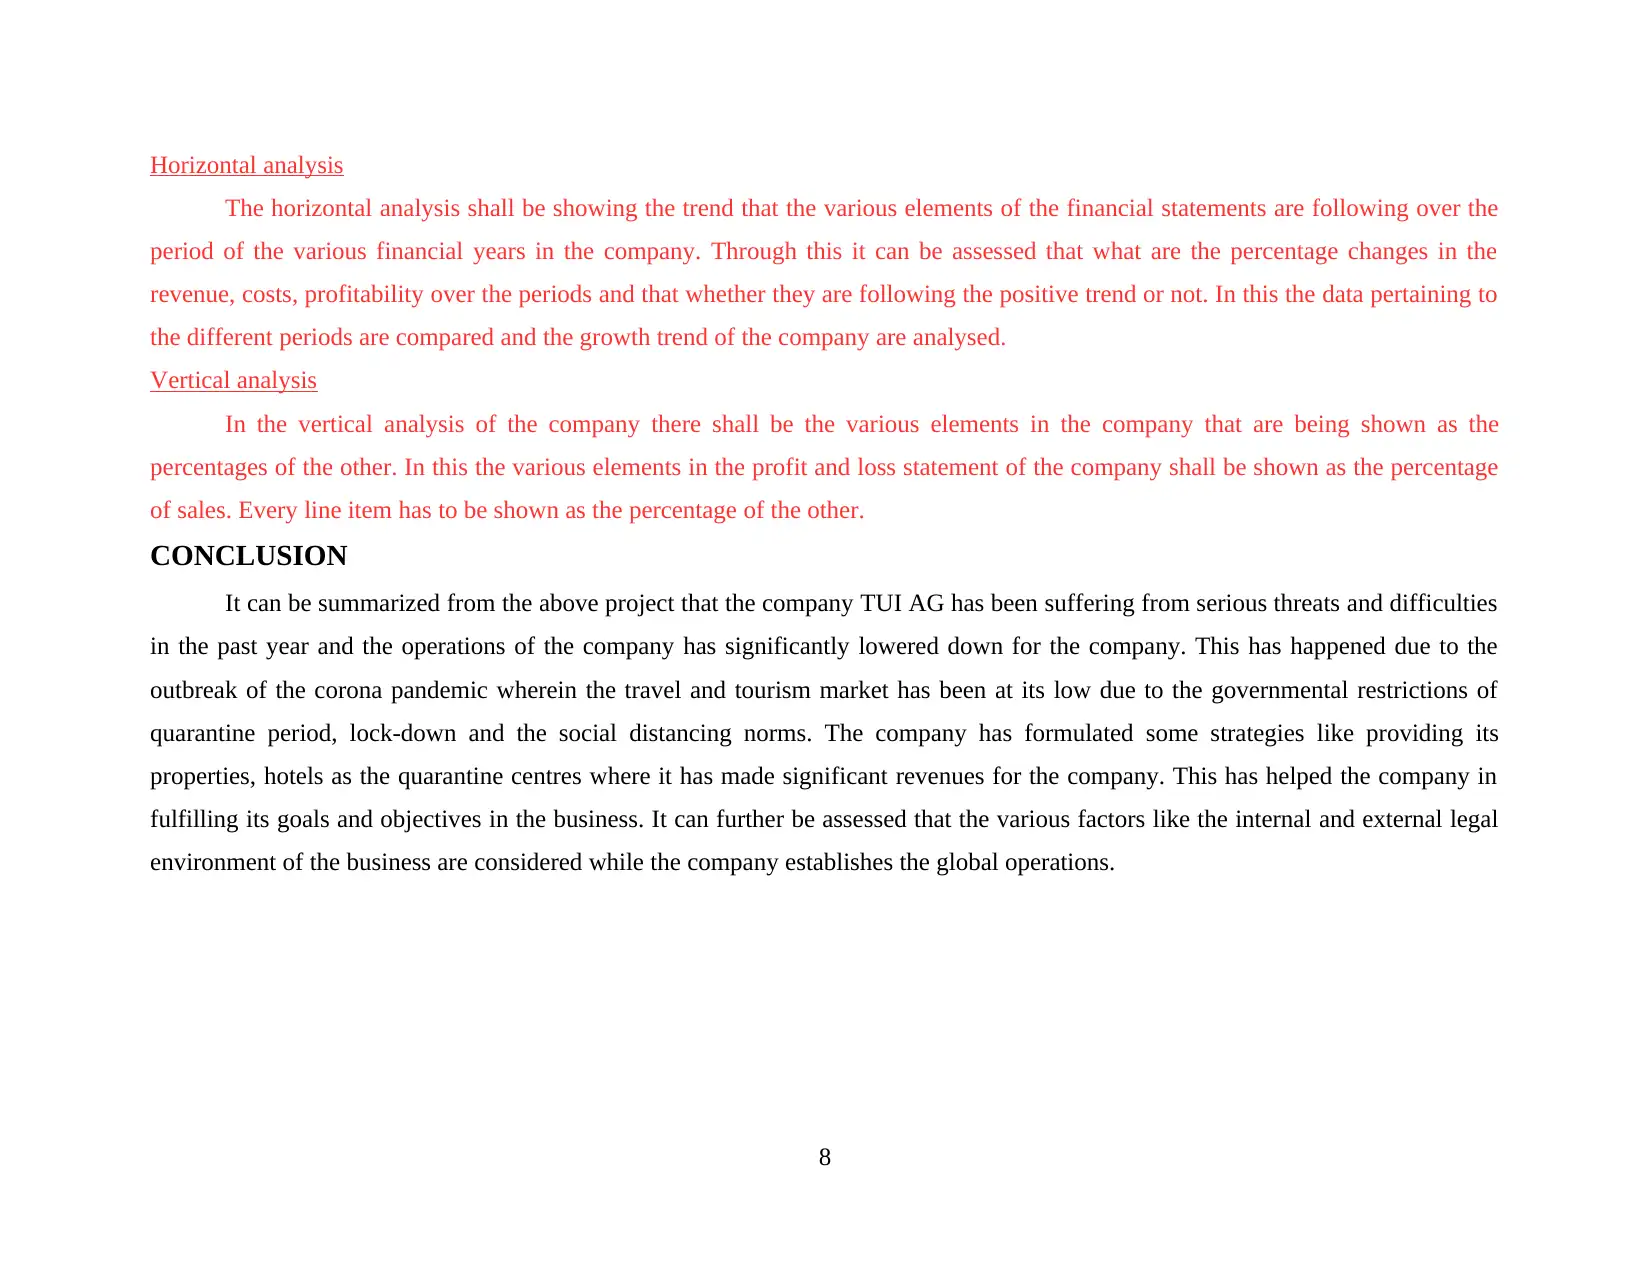
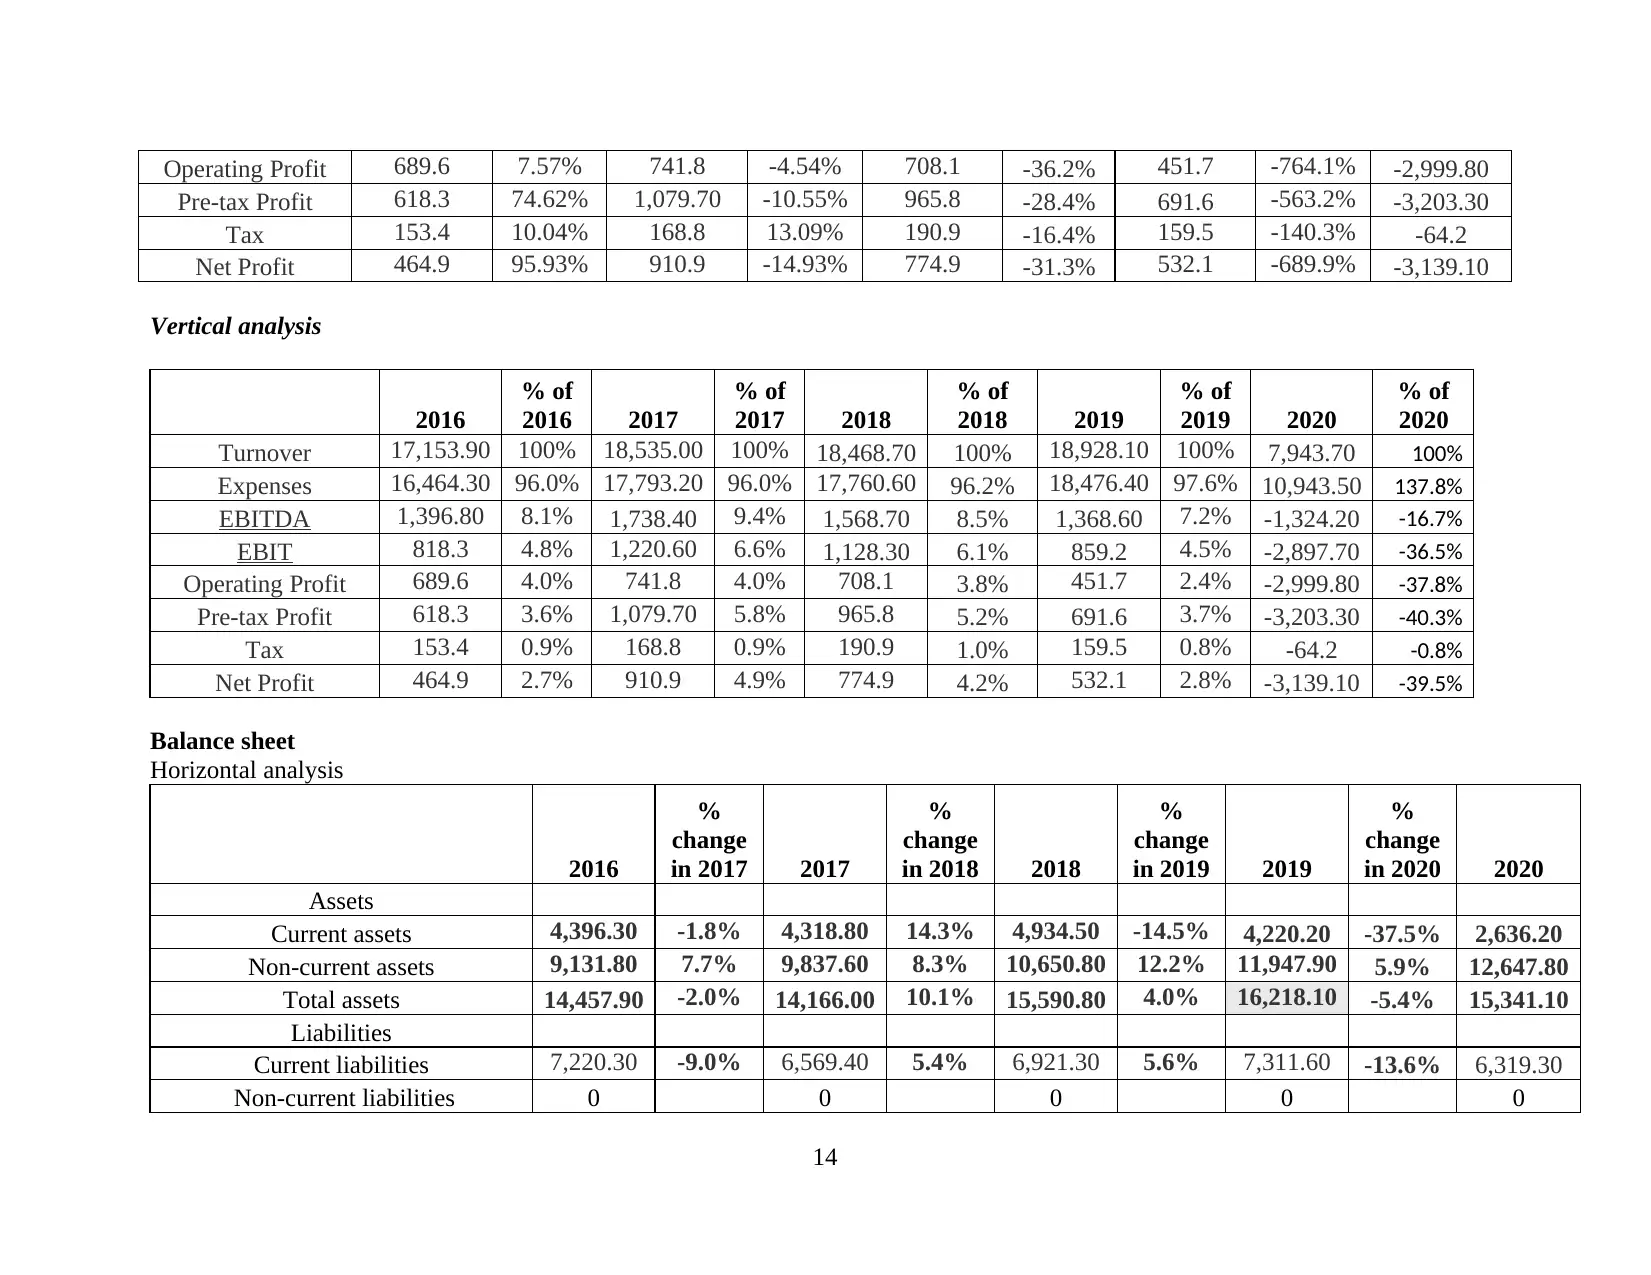
Horizontal analysis
The horizontal analysis shall be showing the trend that the various elements of the financial statements are following over the
period of the various financial years in the company. Through this it can be assessed that what are the percentage changes in the
revenue, costs, profitability over the periods and that whether they are following the positive trend or not. In this the data pertaining to
the different periods are compared and the growth trend of the company are analysed.
Vertical analysis
In the vertical analysis of the company there shall be the various elements in the company that are being shown as the
percentages of the other. In this the various elements in the profit and loss statement of the company shall be shown as the percentage
of sales. Every line item has to be shown as the percentage of the other.
CONCLUSION
It can be summarized from the above project that the company TUI AG has been suffering from serious threats and difficulties
in the past year and the operations of the company has significantly lowered down for the company. This has happened due to the
outbreak of the corona pandemic wherein the travel and tourism market has been at its low due to the governmental restrictions of
quarantine period, lock-down and the social distancing norms. The company has formulated some strategies like providing its
properties, hotels as the quarantine centres where it has made significant revenues for the company. This has helped the company in
fulfilling its goals and objectives in the business. It can further be assessed that the various factors like the internal and external legal
environment of the business are considered while the company establishes the global operations.
8
REFERENCES
Books and Journals
Siekelova, A., Kovalova, E. and Ciurlău, C. F., 2019. Prediction financial stability of Romanian production companies through
Altman Z-score. Ekonomicko-manazerske spektrum. 13(2). pp.89-97.
Valaskova, K., Kliestik, T. and Kovacova, M., 2018. Management of financial risks in Slovak enterprises using regression
analysis. Oeconomia Copernicana. 9(1). pp.105-121.
Pramono, C. and et.al., 2020. Analysis of financial performance comparison before and after the emergence of e-commerce in
Indonesian retail company. International Journal of Research and Review. 7(1). pp.182-186.
Restianti, T. and Agustina, L., 2018. The effect of financial ratios on financial distress conditions in sub industrial sector
company. Accounting Analysis Journal. 7(1). pp.25-33.
Martin, R., Yadiati, W. and Pratama, A., 2018. Corporate Social Responsibility Disclosure and Company Financial Performance: Do
High and Low Profile Industry Moderate the Result?. Indonesian Journal of Sustainability Accounting and
Management. 2(1). pp.15-24.
Online
What is a Balanced Scorecard? 2021. [Online] Available through: <https://www.smartsheet.com/all-about-balanced-scorecard>
TUI Group. 2021. [Online] Available through: <https://www.tuigroup.com/en-en>
9
APPENDICES
TUI AG
S.NO RATIOS FORMULA CALCULATIONS
LIQUIDITY
RATIOS 2020 2019 2018 2017 2016
1 Current Ratio
Current Assets / Current
Liabilities
0.458
5915
685
0.626
6711
671
0.757
6227
946
0.701
8579
022
0.841
0605
439
Current Assets
2693.
4
4270.
2
4929.
7
4317.
9
5326.
1
Current Liabilities
5873.
2
6814.
1
6506.
8
6152.
1
6332.
6
2 Quick Ratio
(Current Assets - Inventory) /
Current Liabilities
0.446
1281
754
0.609
8384
233
0.739
4110
776
0.683
9453
195
0.824
4480
94
Current Assets
2693.
4
4270.
2
4929.
7
4317.
9
5326.
1
Inventory 73.2 114.7 118.5 110.2 105.2
Current Liabilities
5873.
2
6814.
1
6506.
8
6152.
1
6332.
6
SOLVENCY
RATIOS
3
Debt Equity
Ratio
Long term Debt / Shareholder's
Fund
1.119
5545
766
0.430
1542
016
0.394
6242
592
0.309
1668
715
0.264
0833
319
Long term debt
6404.
3
2457.
6
2250.
7
1761.
2
1503.
4
Shareholder's fund
5720.
4
5713.
3
5703.
4
5696.
6
5692.
9
10
Paraphrase This Document
Need a fresh take? Get an instant paraphrase of this document with our AI Paraphraser
4
Interest Coverage
Ratio
Earnings before interest and tax /
Interest on long term debt
-
8.957
4137
395
5.035
0058
343
6.870
0906
344
7.912
2919
334
2.787
5108
413
Earnings before
interest and tax
-
2881.
6 863 1137
1235.
9 964.2
Interest on long
term debt 321.7 171.4 165.5 156.2 345.9
PROFITABILIT
Y RATIOS
5
Gross Profit
Ratio
Gross Profit / Net Revenue from
Operations * 100
-
24.96
%
7.60
%
10.15
%
10.79
%
11.09
%
Gross Profit
-
1982.
4
1438.
7
1981.
5
1999.
5
1906.
5
Net revenue from
operations
7943.
7
1892
8.1
1952
3.9
1853
5
1718
4.6
6 Net Profit Ratio
Net Profit / Revenue from
Operations * 100
-
49.49
%
2.81
%
4.19
%
4.11
%
6.70
%
Net Profit
-
3931.
1 532.1 818.9 761.4
1152.
2
Revenue from
operations
7943.
7
1892
8.1
1952
3.9
1853
5
1718
4.6
7
Return on
Capital Employed
Earnings before interest and tax /
Capital Employed * 100
-
30.44
%
9.18
%
12.49
%
15.38
%
11.87
%
11
Earnings before
interest and tax
-
2881.
6 863 1137
1235.
9 964.2
Capital Employed
9467.
9 9404 9105
8033.
4
8125.
3
EFFICIENCY
RATIO
8
Inventory
Turnover Ratio
Cost of goods sold / Average
Inventory
135.6
0245
9016
4
152.4
7951
1769
8
147.8
8523
2067
5
150.0
4990
9255
9
145.2
2908
7452
5
Cost of goods sold
9926.
1
1748
9.4
1752
4.4
1653
5.5
1527
8.1
Average Inventory 73.2 114.7 118.5 110.2 105.2
9
Accounts
Receivable Ratio
Net credit sales / Average
Accounts Receivable
16.33
4978
4084
21.59
7558
1926
19.88
3796
7206
23.32
9137
8225
13.01
7650
178
Net credit sales
7943.
7
1892
8.1
1952
3.9
1853
5
1718
4.6
Average accounts
receivable 486.3 876.4 981.9 794.5
1320.
1
10
Accounts Payable
Ratio
Net credit sales / Average
Accounts Payables
4.929
3825
628
6.687
1930
754
6.646
8865
965
6.985
6405
231
6.937
9466
268
Net credit sales
7943.
7
1892
8.1
1952
3.9
1853
5
1718
4.6
Average accounts
payable
1611.
5
2830.
5
2937.
3
2653.
3
2476.
9
COVERAGE
12
RATIO
11
Debt Service
Coverage Ratio Operating Income / Total Debt
-
0.381
0720
922
0.183
2682
292
0.335
6733
461
0.428
2875
312
0.477
9167
221
Operating Income
-
2440.
5 450.4 755.5 754.3 718.5
Total debt
6404.
3
2457.
6
2250.
7
1761.
2
1503.
4
MARKET
PROSPECT
RATIO
12
Earning per
Share
Earnings available to equity
shareholders / Number of shares
outstanding -5.34 0.71 1.25 1.1 1.78
Earnings available
to equity
shareholders
-
3931.
1 532.1 818.9 761.4
1152.
2
Number of shares
outstanding
736.1
6
749.4
4
655.1
2
692.1
8 647.3
Horizontal analysis
2016
%
change
in 2017 2017
%
change
in 2018 2018
%
change
in 2019 2019
%
change
in 2020 2020
Turnover 17,153.90 8.05% 18,535.00 -0.36% 18,468.70 2.5% 18,928.10 -58.0% 7,943.70
Expenses 16,464.30 8.07% 17,793.20 -0.18% 17,760.60 4.0% 18,476.40 -40.8% 10,943.50
EBITDA 1,396.80 24.46% 1,738.40 -9.76% 1,568.70 -12.8% 1,368.60 -196.8% -1,324.20
EBIT 818.3 49.16% 1,220.60 -7.56% 1,128.30 -23.9% 859.2 -437.3% -2,897.70
13
Secure Best Marks with AI Grader
Need help grading? Try our AI Grader for instant feedback on your assignments.
Operating Profit 689.6 7.57% 741.8 -4.54% 708.1 -36.2% 451.7 -764.1% -2,999.80
Pre-tax Profit 618.3 74.62% 1,079.70 -10.55% 965.8 -28.4% 691.6 -563.2% -3,203.30
Tax 153.4 10.04% 168.8 13.09% 190.9 -16.4% 159.5 -140.3% -64.2
Net Profit 464.9 95.93% 910.9 -14.93% 774.9 -31.3% 532.1 -689.9% -3,139.10
Vertical analysis
2016
% of
2016 2017
% of
2017 2018
% of
2018 2019
% of
2019 2020
% of
2020
Turnover 17,153.90 100% 18,535.00 100% 18,468.70 100% 18,928.10 100% 7,943.70 100%
Expenses 16,464.30 96.0% 17,793.20 96.0% 17,760.60 96.2% 18,476.40 97.6% 10,943.50 137.8%
EBITDA 1,396.80 8.1% 1,738.40 9.4% 1,568.70 8.5% 1,368.60 7.2% -1,324.20 -16.7%
EBIT 818.3 4.8% 1,220.60 6.6% 1,128.30 6.1% 859.2 4.5% -2,897.70 -36.5%
Operating Profit 689.6 4.0% 741.8 4.0% 708.1 3.8% 451.7 2.4% -2,999.80 -37.8%
Pre-tax Profit 618.3 3.6% 1,079.70 5.8% 965.8 5.2% 691.6 3.7% -3,203.30 -40.3%
Tax 153.4 0.9% 168.8 0.9% 190.9 1.0% 159.5 0.8% -64.2 -0.8%
Net Profit 464.9 2.7% 910.9 4.9% 774.9 4.2% 532.1 2.8% -3,139.10 -39.5%
Balance sheet
Horizontal analysis
2016
%
change
in 2017 2017
%
change
in 2018 2018
%
change
in 2019 2019
%
change
in 2020 2020
Assets
Current assets 4,396.30 -1.8% 4,318.80 14.3% 4,934.50 -14.5% 4,220.20 -37.5% 2,636.20
Non-current assets 9,131.80 7.7% 9,837.60 8.3% 10,650.80 12.2% 11,947.90 5.9% 12,647.80
Total assets 14,457.90 -2.0% 14,166.00 10.1% 15,590.80 4.0% 16,218.10 -5.4% 15,341.10
Liabilities
Current liabilities 7,220.30 -9.0% 6,569.40 5.4% 6,921.30 5.6% 7,311.60 -13.6% 6,319.30
Non-current liabilities 0 0 0 0 0
14
Shareholders’ equity 3,248.20 7.2% 3,482.10 22.8% 4,275.60 -2.6% 4,165.60 -94.8% 218.1
Total liabilities & shareholders’
equity
14,457.90 -2.0% 14,166.00 10.1% 15,590.80 4.0% 16,218.10
-5.4% 15,341.10
Vertical analysis
2016
% of
2016 2017
% of
2017 2018
% of
2018 2019
% of
2019 2020 % of 2020
Assets
Current assets
4,396.30 30.4
%
4,318.80 30.5% 4,934.5
0
31.7%
4,220.20
26.0
% 2,636.20 17.
Non-current assets
9,131.80 63.2
%
9,837.60 69.4% 10,650.
80
68.3% 11,947.90 73.7
% 12,647.80 82.
Total assets 14,457.90
100.
0% 14,166.00
100.0
%
15,590.
80
100.0
%
16,218.10 100.
0% 15,341.10 100.
Liabilities
Current liabilities
7,220.30 49.9
%
6,569.40 46.4% 6,921.3
0
44.4% 7,311.60 45.1
% 6,319.30 41.
Non-current liabilities 0
0.0
% 0
0.0%
0
0.0%
0
0.0
% 0 0.
Shareholders equity
3,248.20 22.5
%
3,482.10 24.6% 4,275.6
0
27.4% 4,165.60 25.7
% 218.1 1.
Total liabilities & shareholders equity
14,457.90 100.
0%
14,166.00 100.0
%
15,590.
80
100.0
%
16,218.10 100.
0% 15,341.10 100.
Strategy map
15
Financial
Customer
Internal process
Innovation & Learning
Increase
Revenue
Increase the
revenues by
10% in the
target market.
Reduce the
costs and
increase the
profitability.
Improve the
marketing
communication
and design
Increase the
market share
by 7%.
Provide with the
customized
customer
experience.
Improve cost
control
Manage the
acquisitions
and also
improve the
capacity
Improve
supply chain
Optimize
through the
installation of
the latest
technology
Development
of the human
capital.
Balance scorecard: -
Objectives Measures Targets Initiatives
Financial The objective is
to maximize the
profit margin and
the revenues.
Prepare the
budgets and set
them as blueprint.
Increase the
revenues by 10%.
Seek grants and
other finances at
lower cost.
Customer The objective is
to provide value
for money.
Improve the
quality of the
services and fair
Increase the
market share by
7%.
Acquire
feedbacks and
provide after sale
16
Paraphrase This Document
Need a fresh take? Get an instant paraphrase of this document with our AI Paraphraser
Provide services
to retain the
customers.
prices. services
Internal business
processes
To attain the
economies of
scale and reduce
the cost per unit.
Modifications in
the technology to
optimize
operations.
Utilize the
capacity up-to
95%.
Optimum
utilization of the
resources.
Learning and
growth
Use digital
platforms to
expand the reach
of the business.
Trainings and
development of
human capital.
Installation of the
latest technology.
Provide
supervision to use
the new set of
technology.
17
1 out of 20
Related Documents


Your All-in-One AI-Powered Toolkit for Academic Success.
+13062052269
info@desklib.com
Available 24*7 on WhatsApp / Email
![[object Object]](/_next/static/media/star-bottom.7253800d.svg)
Unlock your academic potential
© 2024 | Zucol Services PVT LTD | All rights reserved.