BDI Data Analysis: Depression Intervention, Hypothesis & Statistics

Verified

Added on  2023/05/27

|11
|625
|178
Homework Assignment
AI Summary
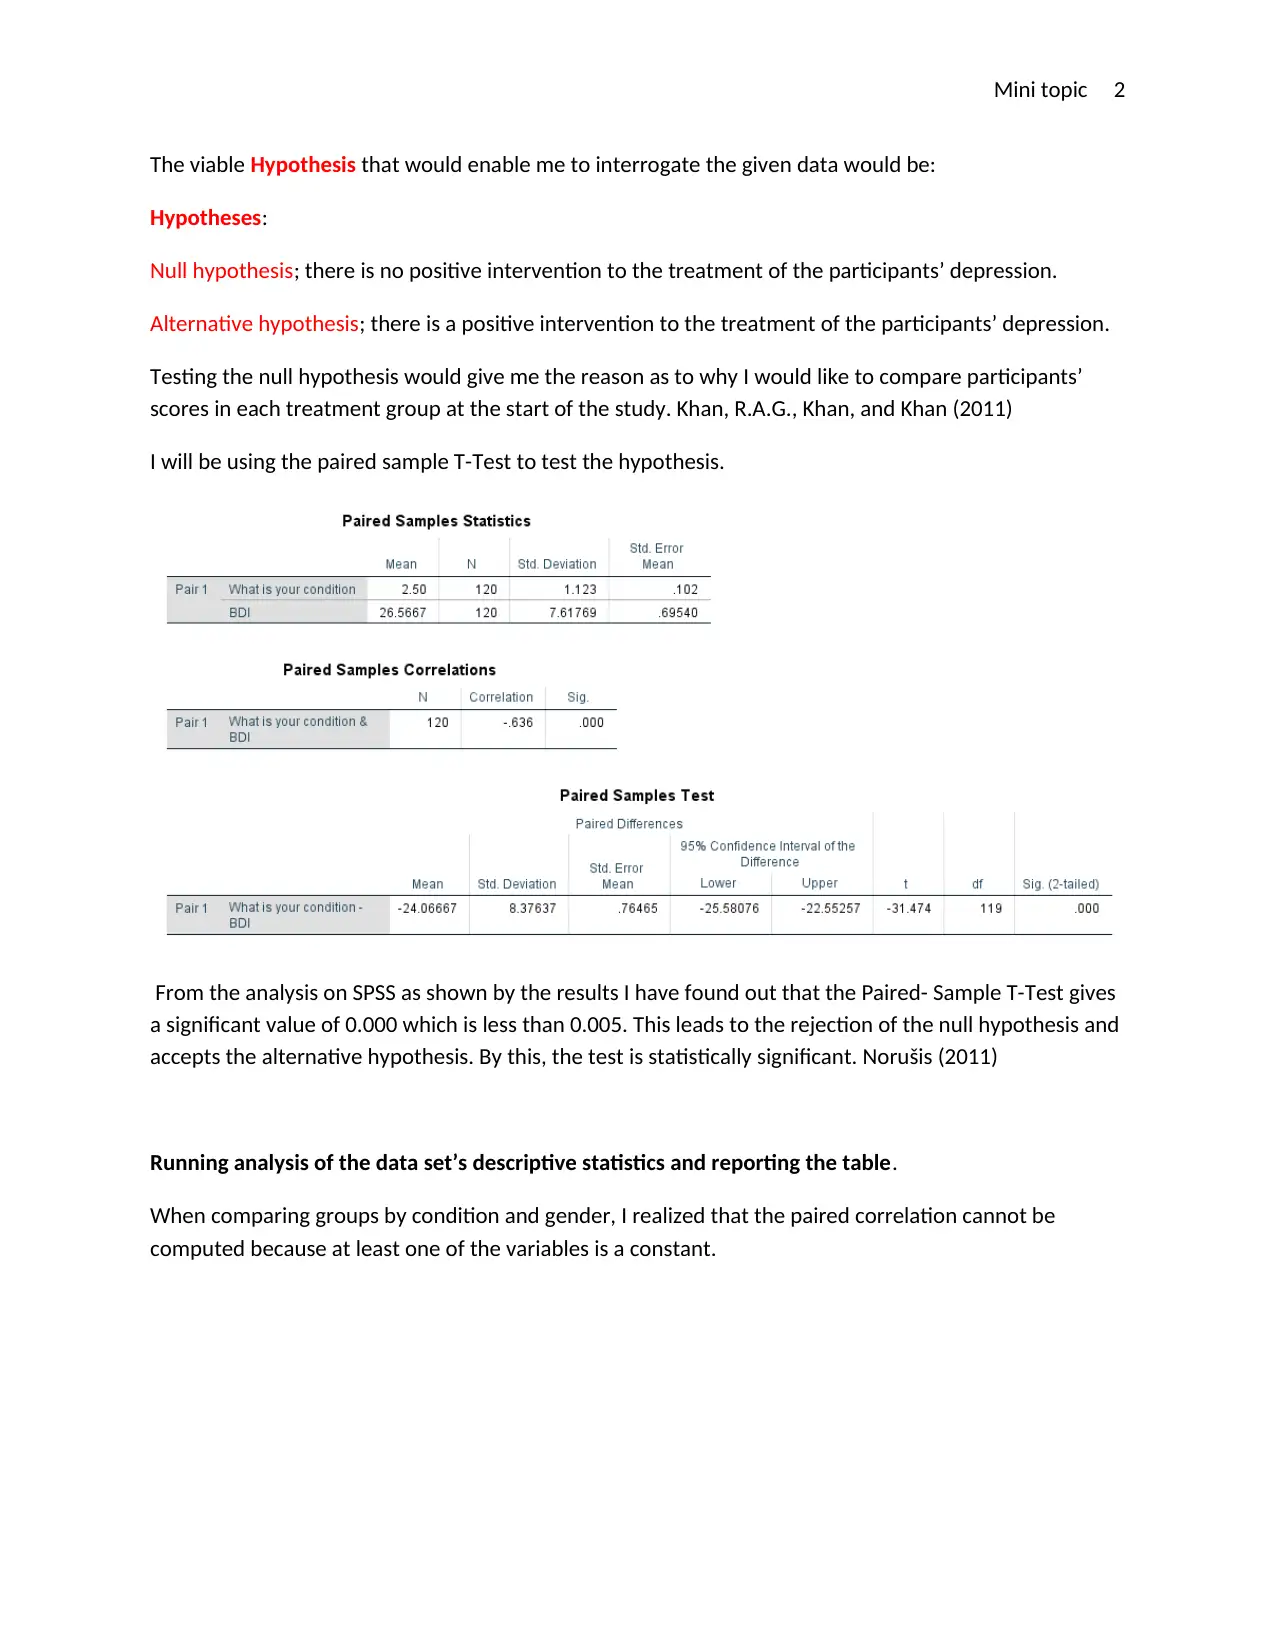
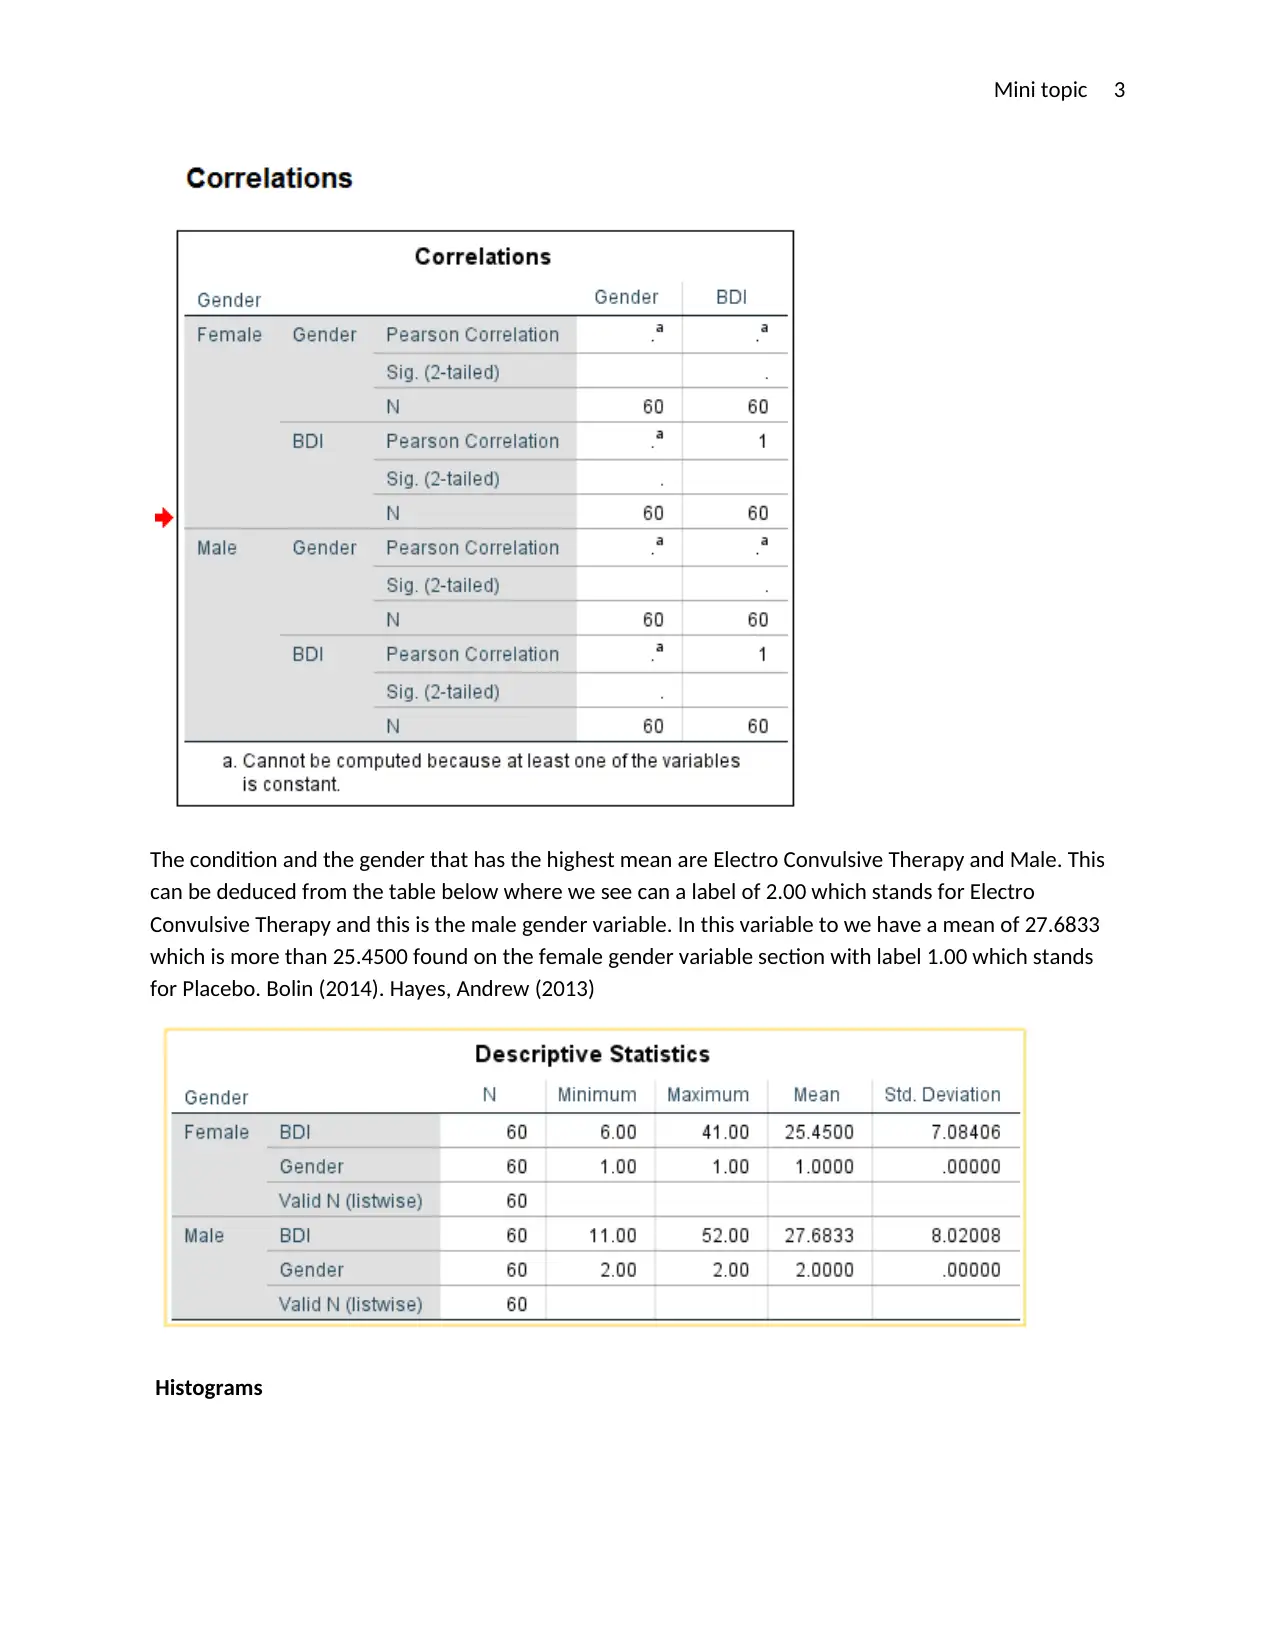
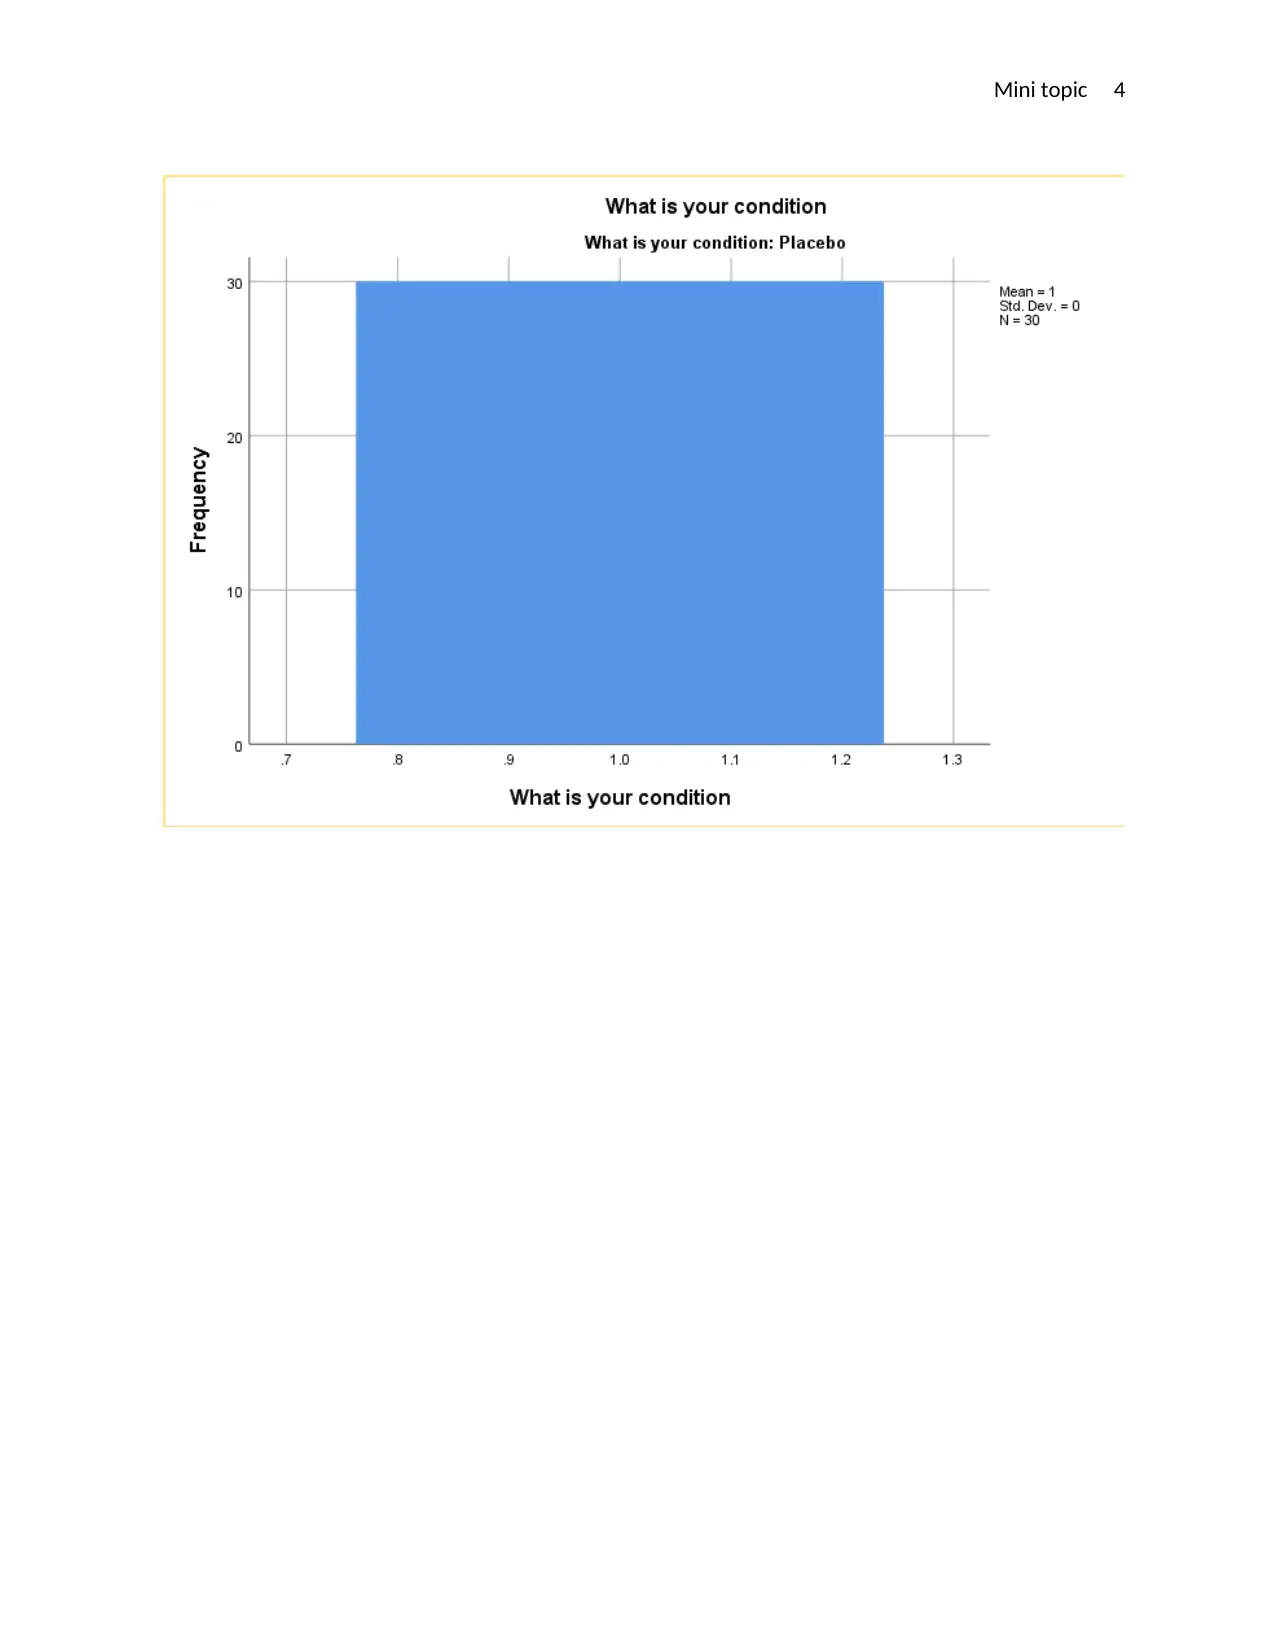
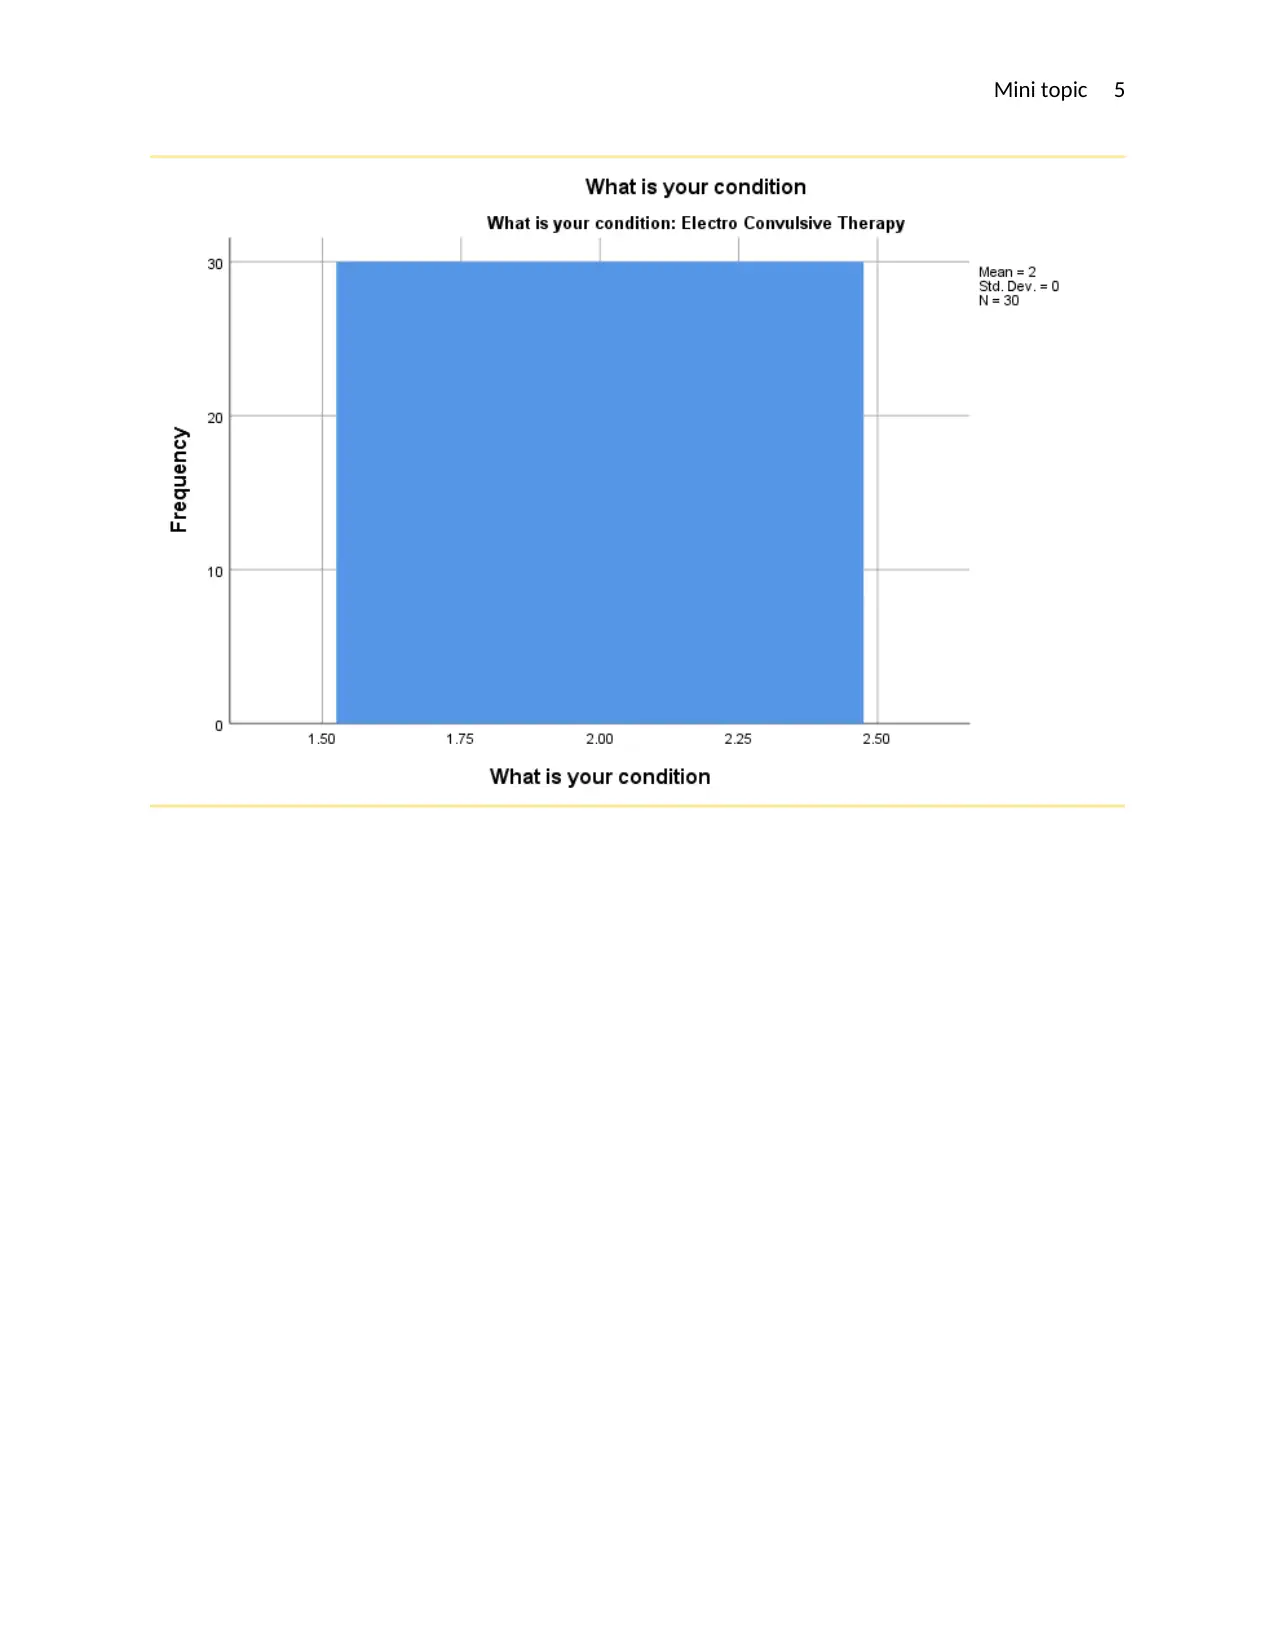
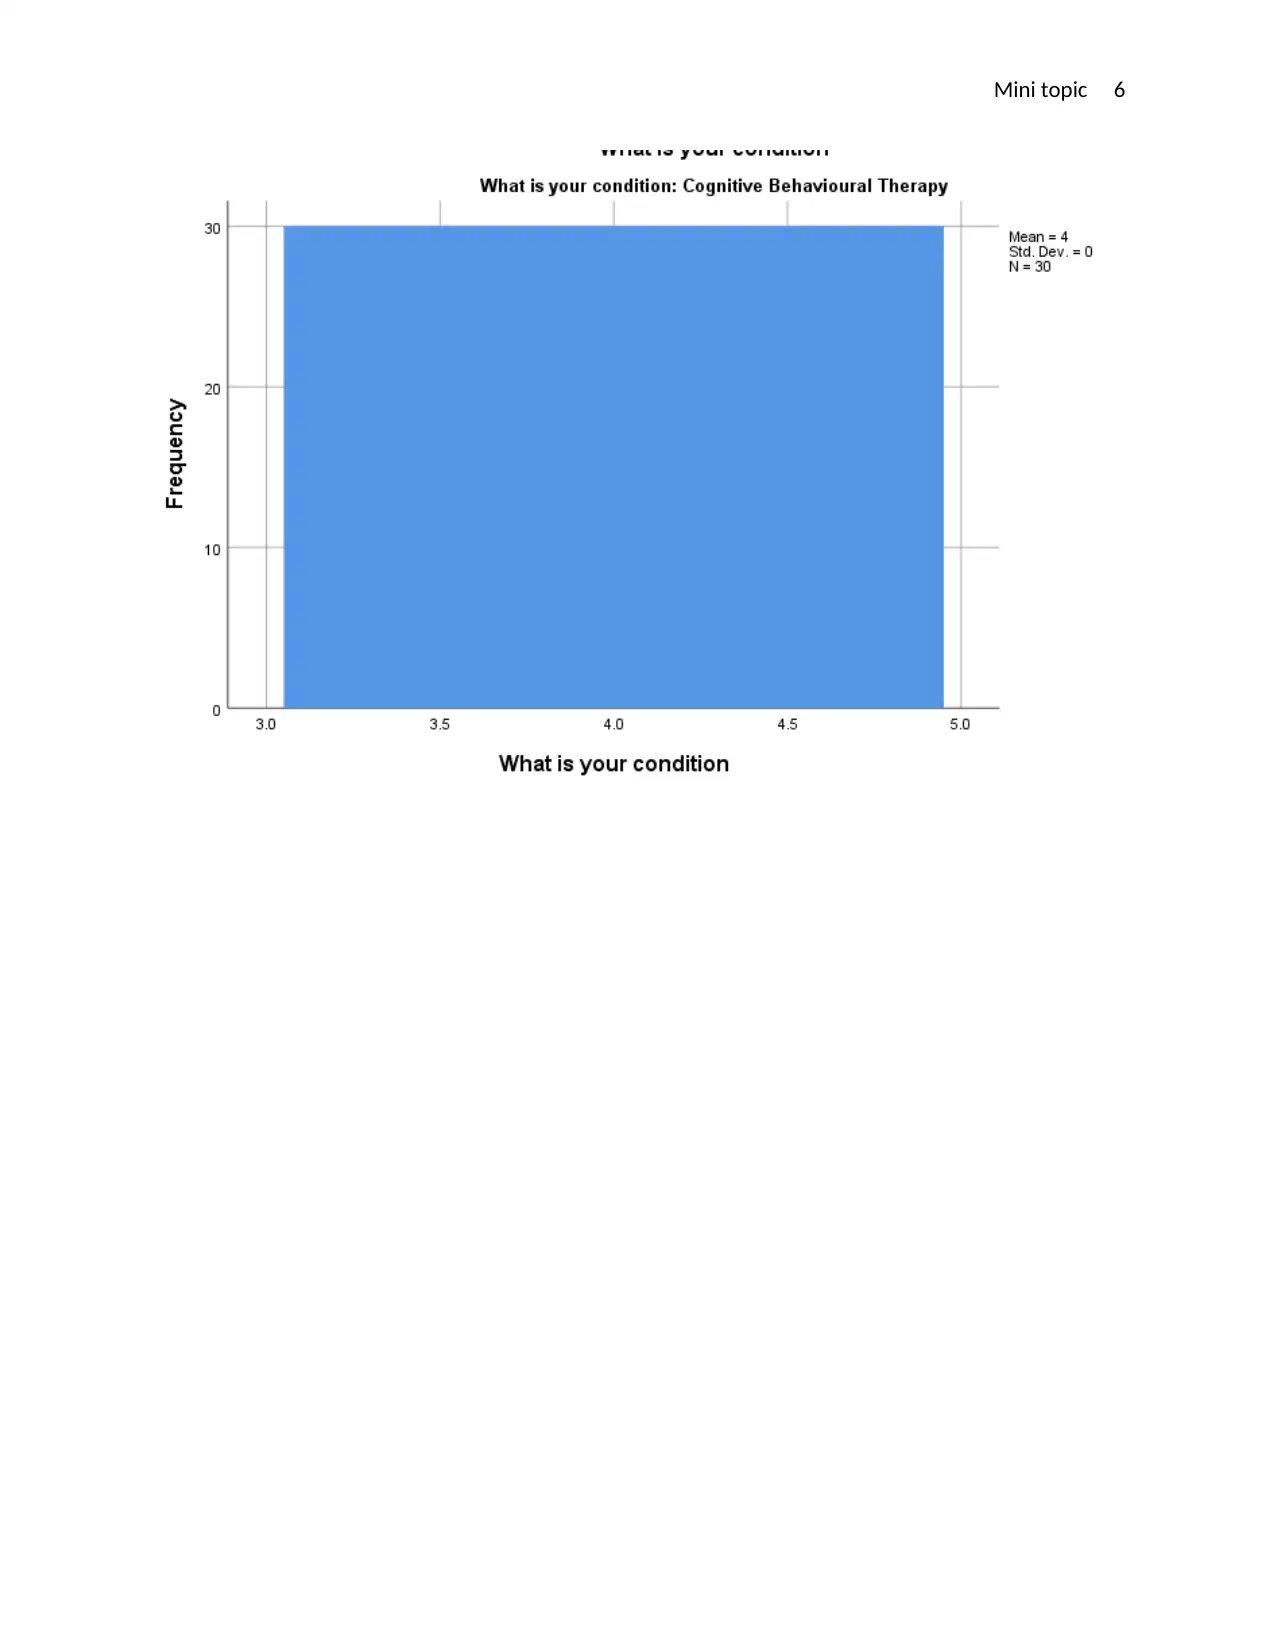
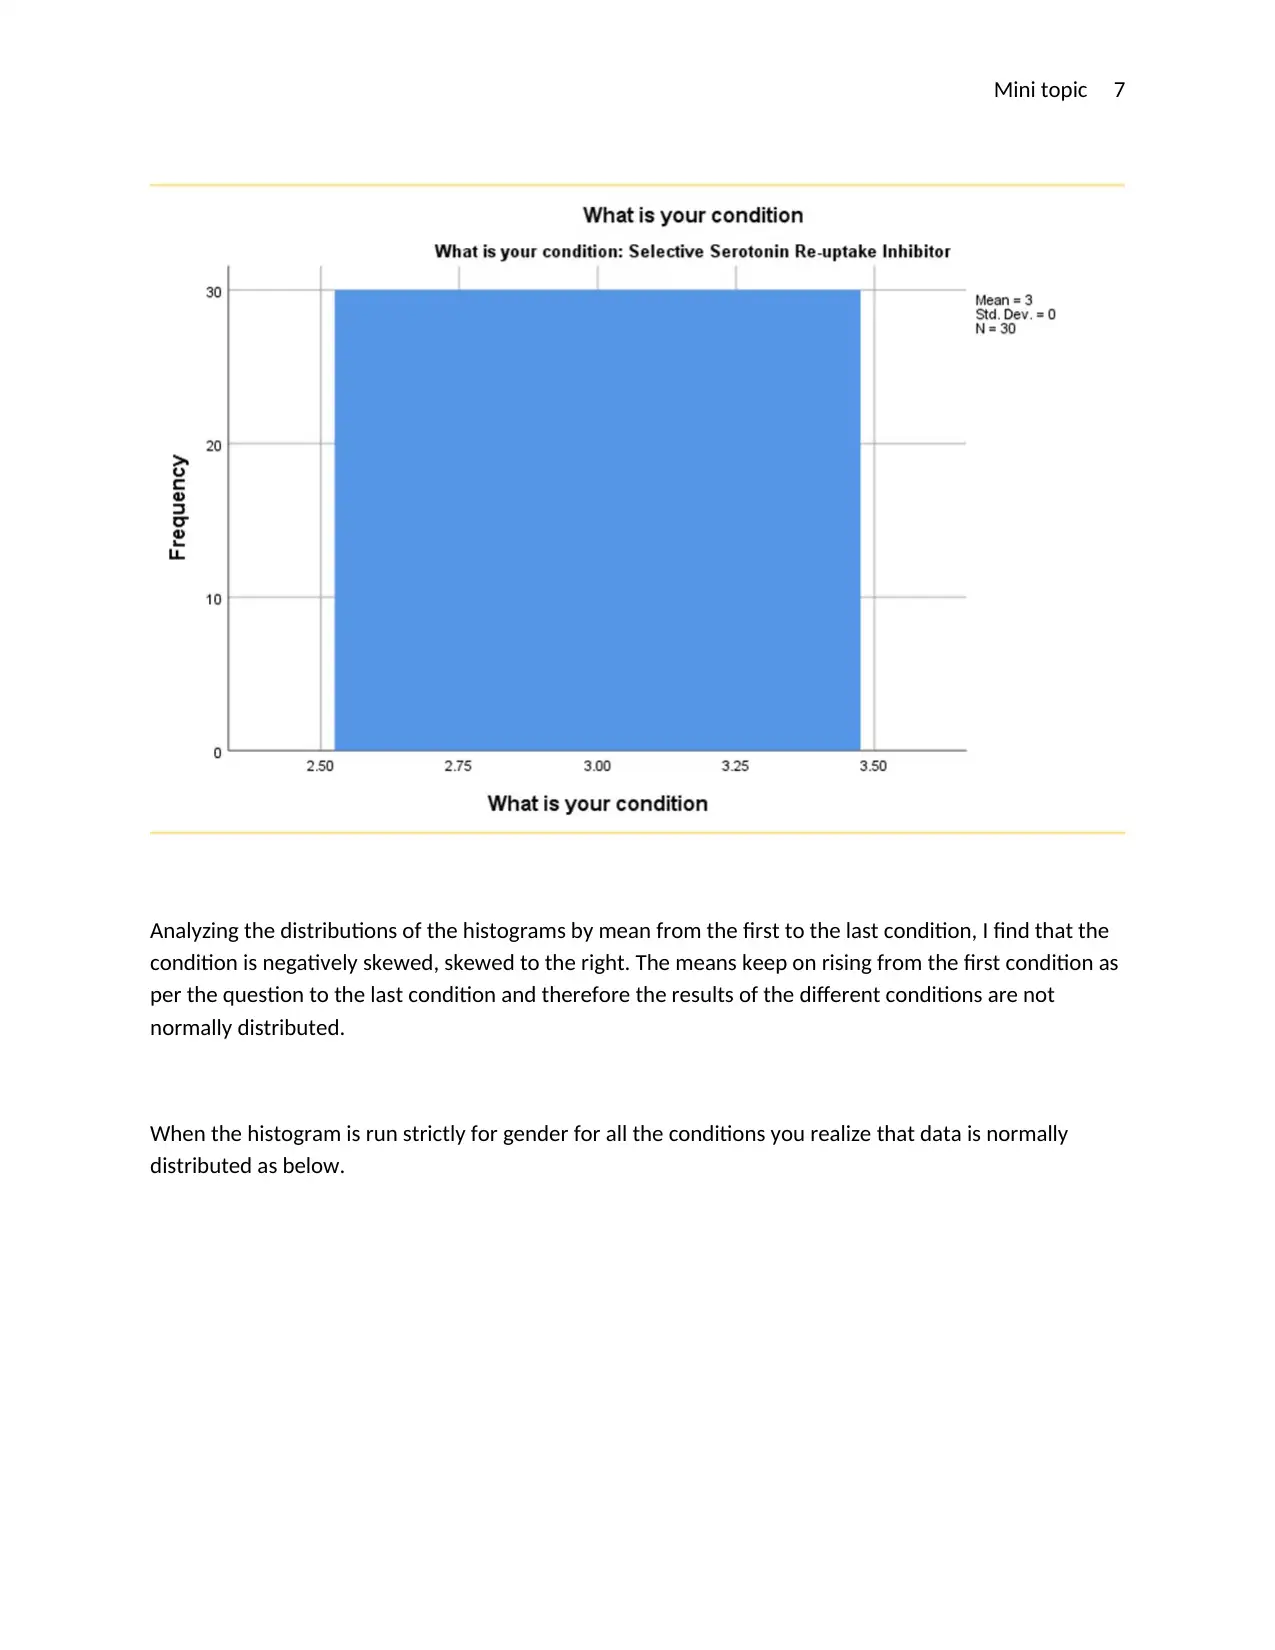
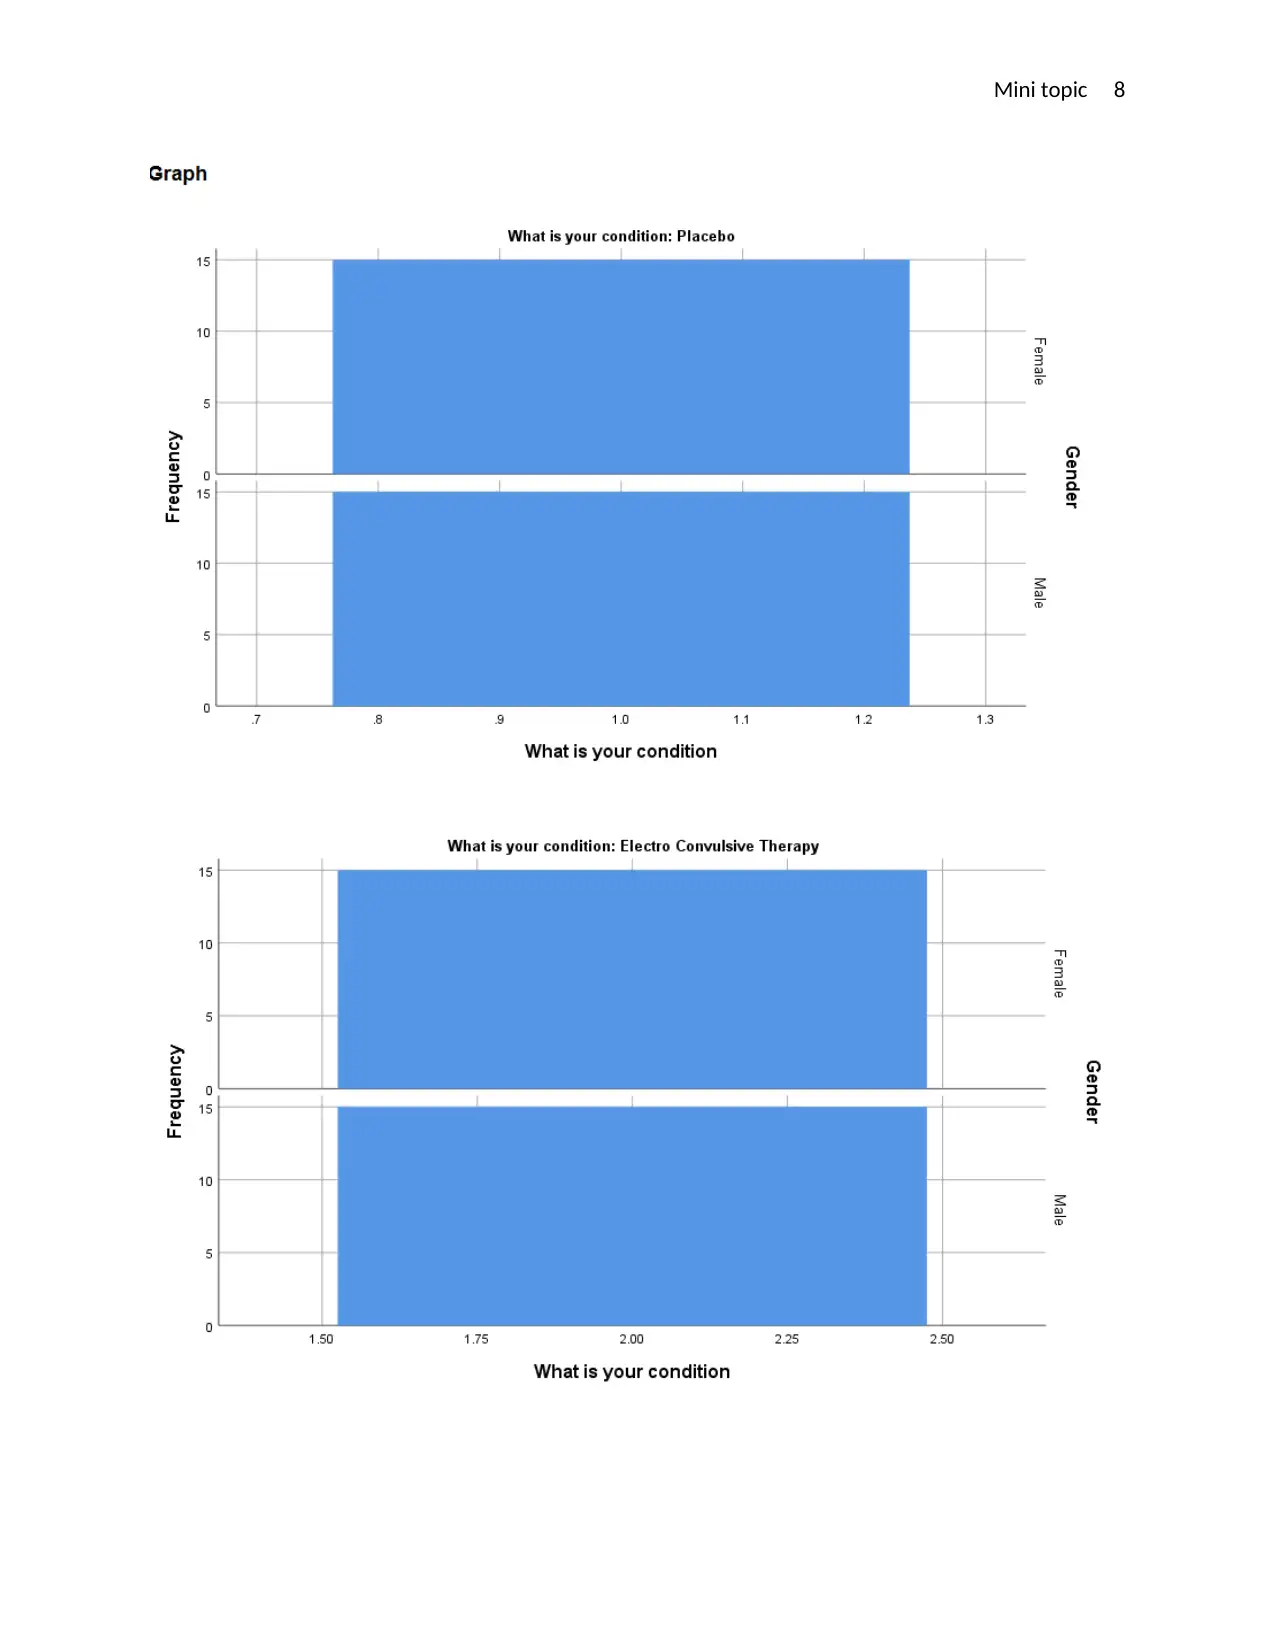
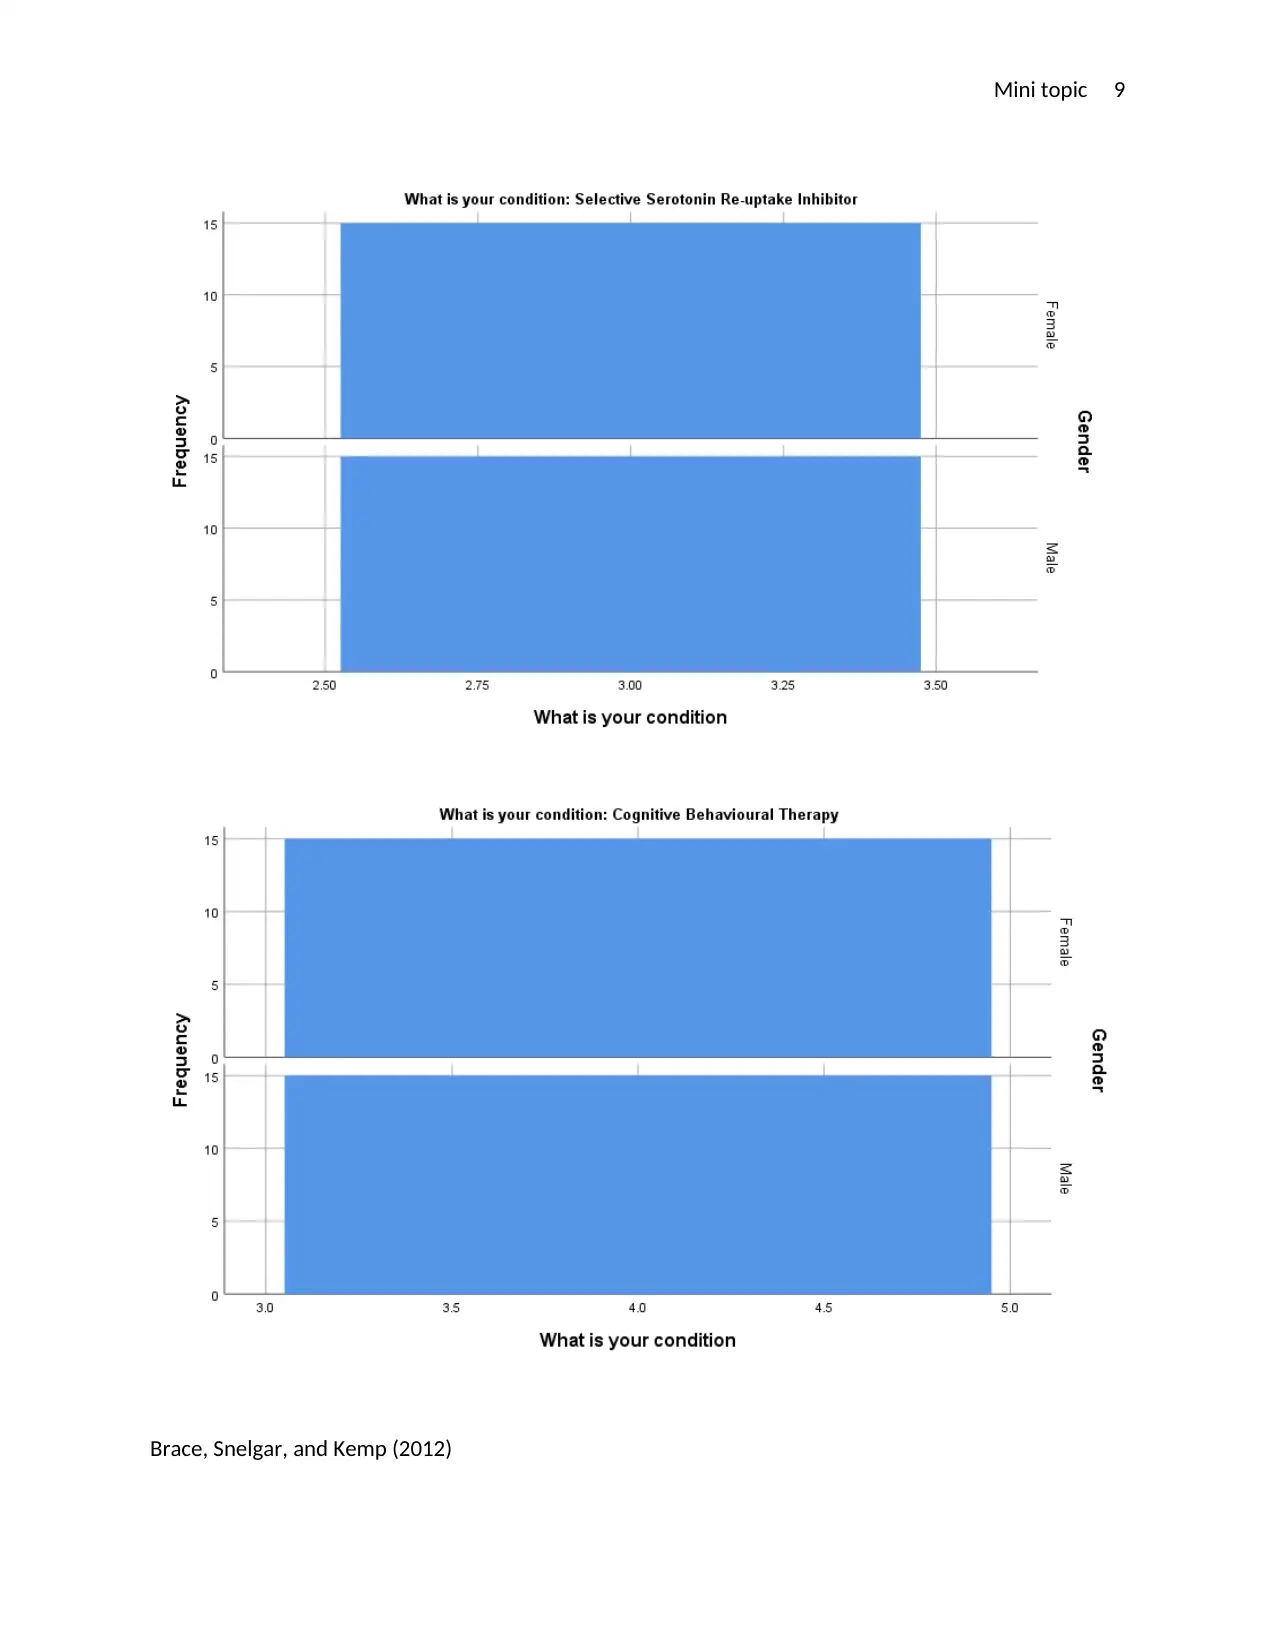
This assignment focuses on analyzing data from the Beck Depression Inventory (BDI) to assess the effectiveness of an intervention for treating depression. The student formulates a null and alternative hypothesis related to the intervention's impact and uses a paired-sample T-test in SPSS to test the hypothesis, ultimately rejecting the null hypothesis based on a significant p-value. Descriptive statistics are calculated, comparing groups by condition and gender, noting the highest mean scores. The analysis includes histograms to examine the distribution of data across different conditions, revealing non-normal distributions and skewness. The assignment concludes that there is a positive intervention effect on treating participants' depression, supporting the alternative hypothesis. References to relevant statistical resources and research are included.
Document Page
Mini topic 1
TOPIC
NAME OF STUDENT
NAME OF CLASS
NAME OF PROFESSOR
NAME OF SCHOOL
CITY AND STATE WHERE IS SCHOOL LOCATED
tabler-icon-diamond-filled.svg

Paraphrase This Document

Need a fresh take? Get an instant paraphrase of this document with our AI Paraphraser
Document Page
Mini topic 2
The viable Hypothesis that would enable me to interrogate the given data would be:
Hypotheses:
Null hypothesis; there is no positive intervention to the treatment of the participants’ depression.
Alternative hypothesis; there is a positive intervention to the treatment of the participants’ depression.
Testing the null hypothesis would give me the reason as to why I would like to compare participants’
scores in each treatment group at the start of the study. Khan, R.A.G., Khan, and Khan (2011)
I will be using the paired sample T-Test to test the hypothesis.
From the analysis on SPSS as shown by the results I have found out that the Paired- Sample T-Test gives
a significant value of 0.000 which is less than 0.005. This leads to the rejection of the null hypothesis and
accepts the alternative hypothesis. By this, the test is statistically significant. Norušis (2011)
Running analysis of the data set’s descriptive statistics and reporting the table.
When comparing groups by condition and gender, I realized that the paired correlation cannot be
computed because at least one of the variables is a constant.
Document Page
Mini topic 3
The condition and the gender that has the highest mean are Electro Convulsive Therapy and Male. This
can be deduced from the table below where we see can a label of 2.00 which stands for Electro
Convulsive Therapy and this is the male gender variable. In this variable to we have a mean of 27.6833
which is more than 25.4500 found on the female gender variable section with label 1.00 which stands
for Placebo. Bolin (2014). Hayes, Andrew (2013)
Histograms
Document Page
Mini topic 4
tabler-icon-diamond-filled.svg

Paraphrase This Document

Need a fresh take? Get an instant paraphrase of this document with our AI Paraphraser
Document Page
Mini topic 5
Document Page
Mini topic 6
Document Page
Mini topic 7
Analyzing the distributions of the histograms by mean from the first to the last condition, I find that the
condition is negatively skewed, skewed to the right. The means keep on rising from the first condition as
per the question to the last condition and therefore the results of the different conditions are not
normally distributed.
When the histogram is run strictly for gender for all the conditions you realize that data is normally
distributed as below.
tabler-icon-diamond-filled.svg

Paraphrase This Document

Need a fresh take? Get an instant paraphrase of this document with our AI Paraphraser
Document Page
Mini topic 8
Document Page
Mini topic 9
Brace, Snelgar, and Kemp (2012)
Document Page
Mini topic 10
Conclusion
As I conclude from the data of the significant value then I found out that the there is a positive
intervention to the treatment of the participants’ depression. And by this, we stick to the alternative
hypothesis and reject the null hypothesis.
tabler-icon-diamond-filled.svg

Paraphrase This Document

Need a fresh take? Get an instant paraphrase of this document with our AI Paraphraser
Document Page
Mini topic 11
References
Norušis, M.J., 2011. IBM SPSS statistics 19 guides to data analysis. Upper Saddle River, New Jersey:
Prentice Hall.
Khan, R.A.G., Khan, F.A. and Khan, M.A., 2011. Impact of training and development on organizational
performance. Global Journal of Management and Business Research, 11(7).
Bolin, J.H., 2014. Hayes, Andrew F.(2013). Introduction to Mediation, Moderation, and Conditional
Process Analysis: A Regression Based Approach. New York, NY: The Guilford Press. Journal of
Educational Measurement, 51(3), pp.335-337.
Brace, N., Snelgar, R. and Kemp, R., 2012. SPSS for Psychologists. Macmillan International Higher
Education.
chevron_up_icon
1 out of 11
circle_padding
hide_on_mobile
zoom_out_icon
[object Object]