Financial Management & Control PGBM01: Exxon Mobil Company Analysis
VerifiedAdded on 2023/04/22
|20
|4878
|322
Report
AI Summary
This report presents a detailed financial analysis of Exxon Mobil, focusing on the year 2017. Part A includes an analysis of Exxon Mobil's financial performance using the DuPont Analysis, examining key financial ratios such as Net Profitability Ratio, Total Asset Turnover, and Gearing Ratio. The analysis breaks down the Return on Equity (ROE) into three and five essential parts, revealing the company's strengths and weaknesses. It assesses the company's profitability, asset utilization efficiency, and leverage. Part B discusses the capital structure of a company and the role of debt financing, emphasizing the importance of maintaining an optimal balance between debt and equity. The report concludes that while debt financing offers a cheaper cost of capital and tax benefits, maximizing debt can increase financial risk, highlighting the need for careful consideration of business factors and financial stability. Desklib provides access to this report and many other solved assignments.

Paraphrase This Document
Need a fresh take? Get an instant paraphrase of this document with our AI Paraphraser
1
Table of Contents
Part A...............................................................................................................................................2
Part B...............................................................................................................................................7
Part C...............................................................................................................................................9
References......................................................................................................................................14
2
Part A
i) Analysis for the Exxon Mobil Company was done in the year 2017 thereby analysing the
financial performance of the company. Relevant data for the period 2017 was analysed for the
purpose of the analysis of Exon Mobil (ExxonMobil 2017). The financial analysis of the Exxon
Mobil Company was done by using the DuPont Analysis, which was examined with the help of
key financial ratios like Net Profitability Ratio, Total Asset Ratio and Gearing Ratio for the
company (Chang, Chichernea and HassabElnaby 2014).
Net Profitability Margin Ratio: Profitability margin of the company shows the profitability
earned by a entity in the form of net income earned from the various operations of the company.
The net profit margin of the company was around 4.02% in the year 2016 and was around 8.12%
in the year 2017. Increase in the net profitability of the company has been seen due to the
efficiency of the company in operating the assets of the company (Curtis, Lewis-Western, and
Toynbee 2015).
Total Asset Turnover: Total asset turnover ratio for the Exxon Mobil Company was reflected
by showing the efficiency of the company in generating revenue for company thereby utilizing
the total assets of the company. The return on total assets for the company shows the efficiency
for Exxon Mobil and the same could be well reflected with the help of the increasing revenue of
the company. The total asset turnover for Exxon Mobil was around 63% for the year 2016 that
increased consistently for the company to around 70.08% in the year 2017. The increase in the
revenue of the company could be well reflected for the increase in the total asset turnover ratio of
the company (Padake and Soni 2015).
⊘ This is a preview!⊘
Do you want full access?
Subscribe today to unlock all pages.
Trusted by 1+ million students worldwide
3
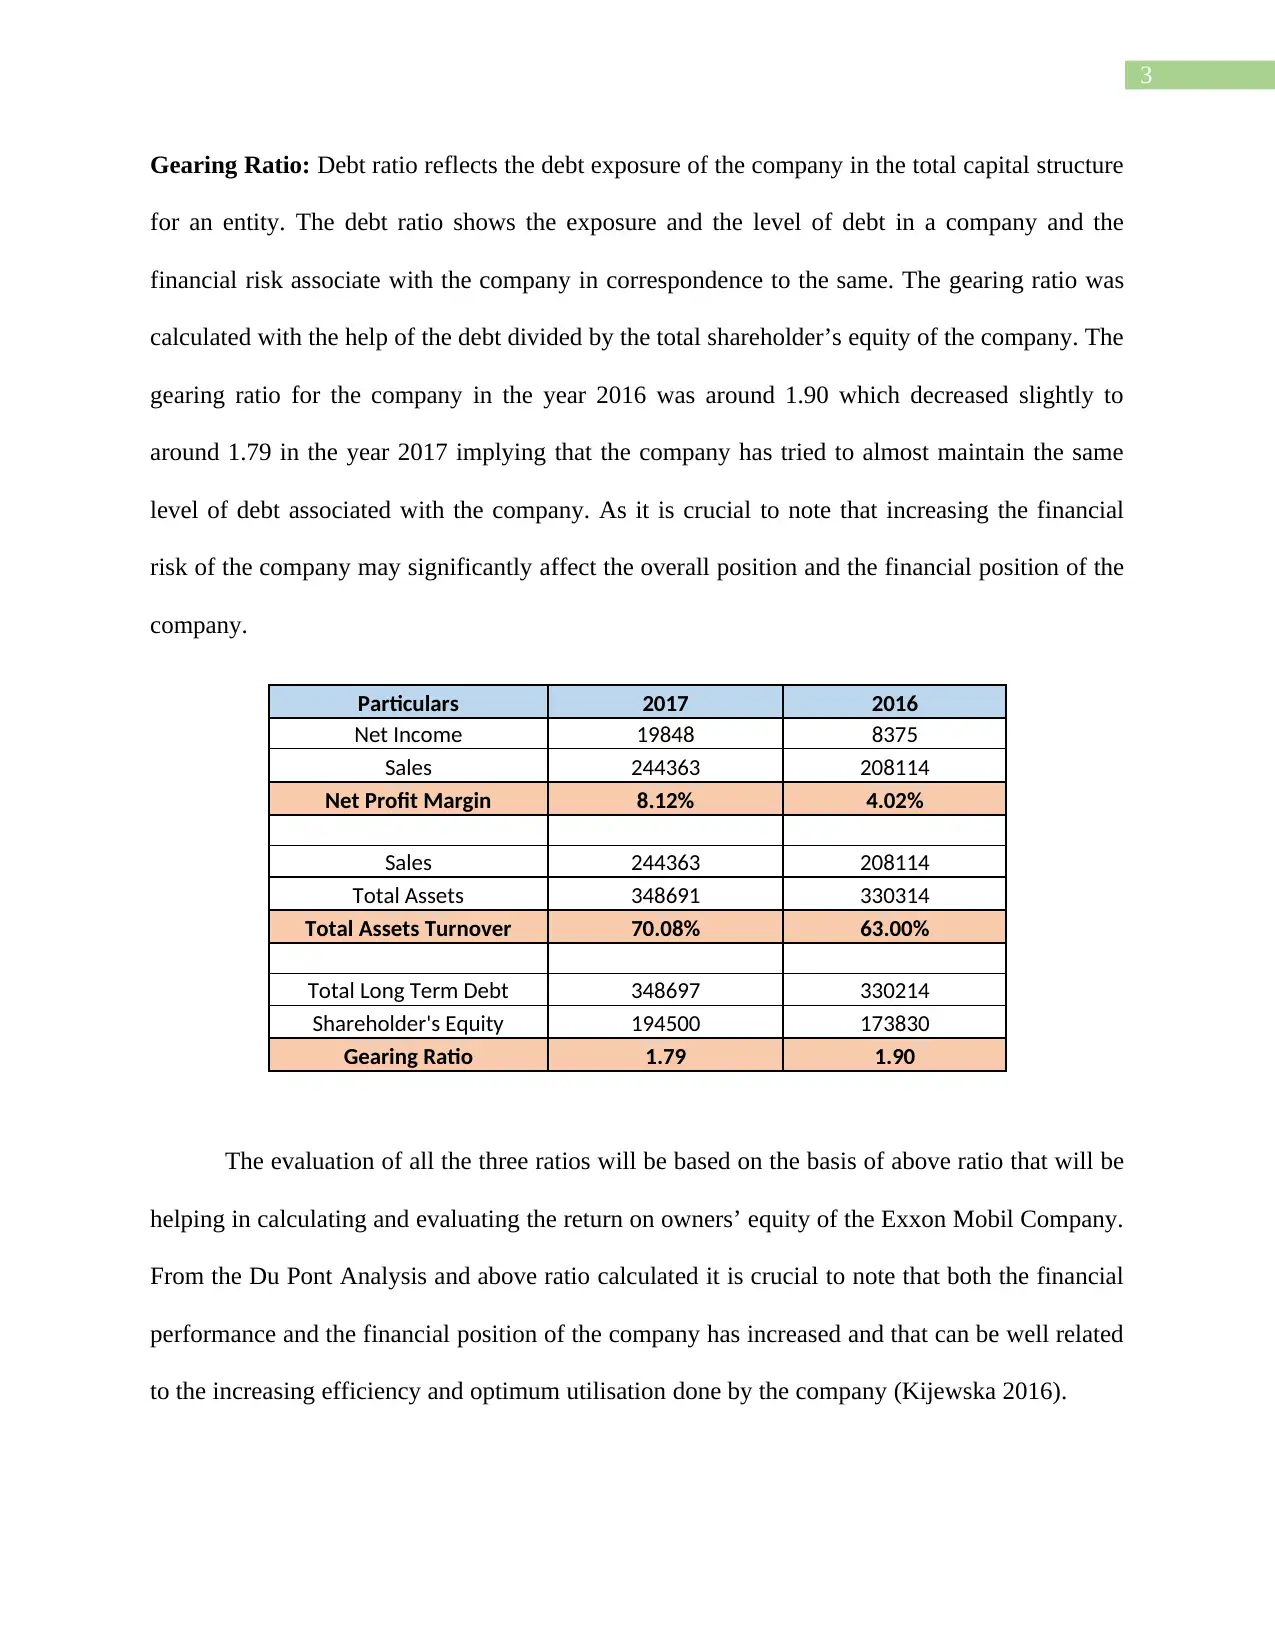
Gearing Ratio: Debt ratio reflects the debt exposure of the company in the total capital structure
for an entity. The debt ratio shows the exposure and the level of debt in a company and the
financial risk associate with the company in correspondence to the same. The gearing ratio was
calculated with the help of the debt divided by the total shareholder’s equity of the company. The
gearing ratio for the company in the year 2016 was around 1.90 which decreased slightly to
around 1.79 in the year 2017 implying that the company has tried to almost maintain the same
level of debt associated with the company. As it is crucial to note that increasing the financial
risk of the company may significantly affect the overall position and the financial position of the
company.
Particulars 2017 2016
Net Income 19848 8375
Sales 244363 208114
Net Profit Margin 8.12% 4.02%
Sales 244363 208114
Total Assets 348691 330314
Total Assets Turnover 70.08% 63.00%
Total Long Term Debt 348697 330214
Shareholder's Equity 194500 173830
Gearing Ratio 1.79 1.90
The evaluation of all the three ratios will be based on the basis of above ratio that will be
helping in calculating and evaluating the return on owners’ equity of the Exxon Mobil Company.
From the Du Pont Analysis and above ratio calculated it is crucial to note that both the financial
performance and the financial position of the company has increased and that can be well related
to the increasing efficiency and optimum utilisation done by the company (Kijewska 2016).
Paraphrase This Document
Need a fresh take? Get an instant paraphrase of this document with our AI Paraphraser
4
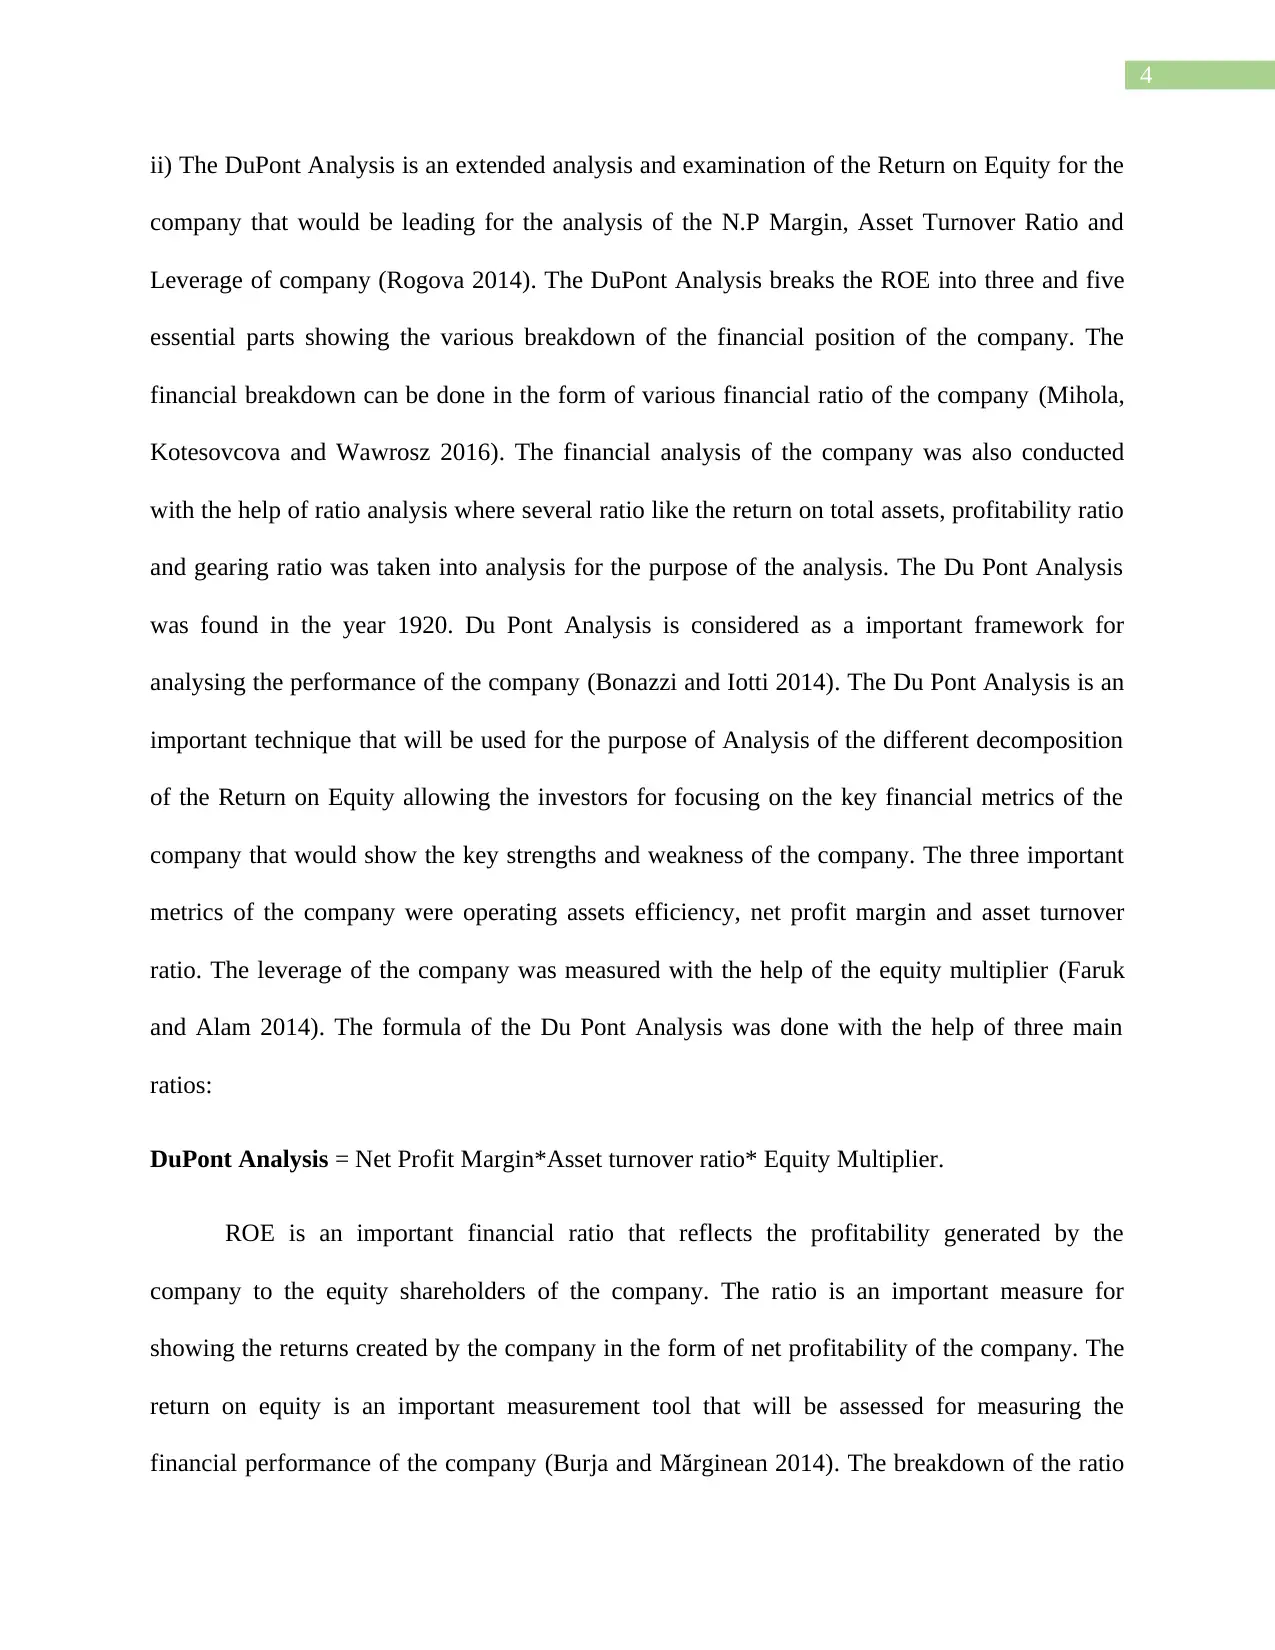
ii) The DuPont Analysis is an extended analysis and examination of the Return on Equity for the
company that would be leading for the analysis of the N.P Margin, Asset Turnover Ratio and
Leverage of company (Rogova 2014). The DuPont Analysis breaks the ROE into three and five
essential parts showing the various breakdown of the financial position of the company. The
financial breakdown can be done in the form of various financial ratio of the company (Mihola,
Kotesovcova and Wawrosz 2016). The financial analysis of the company was also conducted
with the help of ratio analysis where several ratio like the return on total assets, profitability ratio
and gearing ratio was taken into analysis for the purpose of the analysis. The Du Pont Analysis
was found in the year 1920. Du Pont Analysis is considered as a important framework for
analysing the performance of the company (Bonazzi and Iotti 2014). The Du Pont Analysis is an
important technique that will be used for the purpose of Analysis of the different decomposition
of the Return on Equity allowing the investors for focusing on the key financial metrics of the
company that would show the key strengths and weakness of the company. The three important
metrics of the company were operating assets efficiency, net profit margin and asset turnover
ratio. The leverage of the company was measured with the help of the equity multiplier (Faruk
and Alam 2014). The formula of the Du Pont Analysis was done with the help of three main
ratios:
DuPont Analysis = Net Profit Margin*Asset turnover ratio* Equity Multiplier.
ROE is an important financial ratio that reflects the profitability generated by the
company to the equity shareholders of the company. The ratio is an important measure for
showing the returns created by the company in the form of net profitability of the company. The
return on equity is an important measurement tool that will be assessed for measuring the
financial performance of the company (Burja and Mărginean 2014). The breakdown of the ratio
5
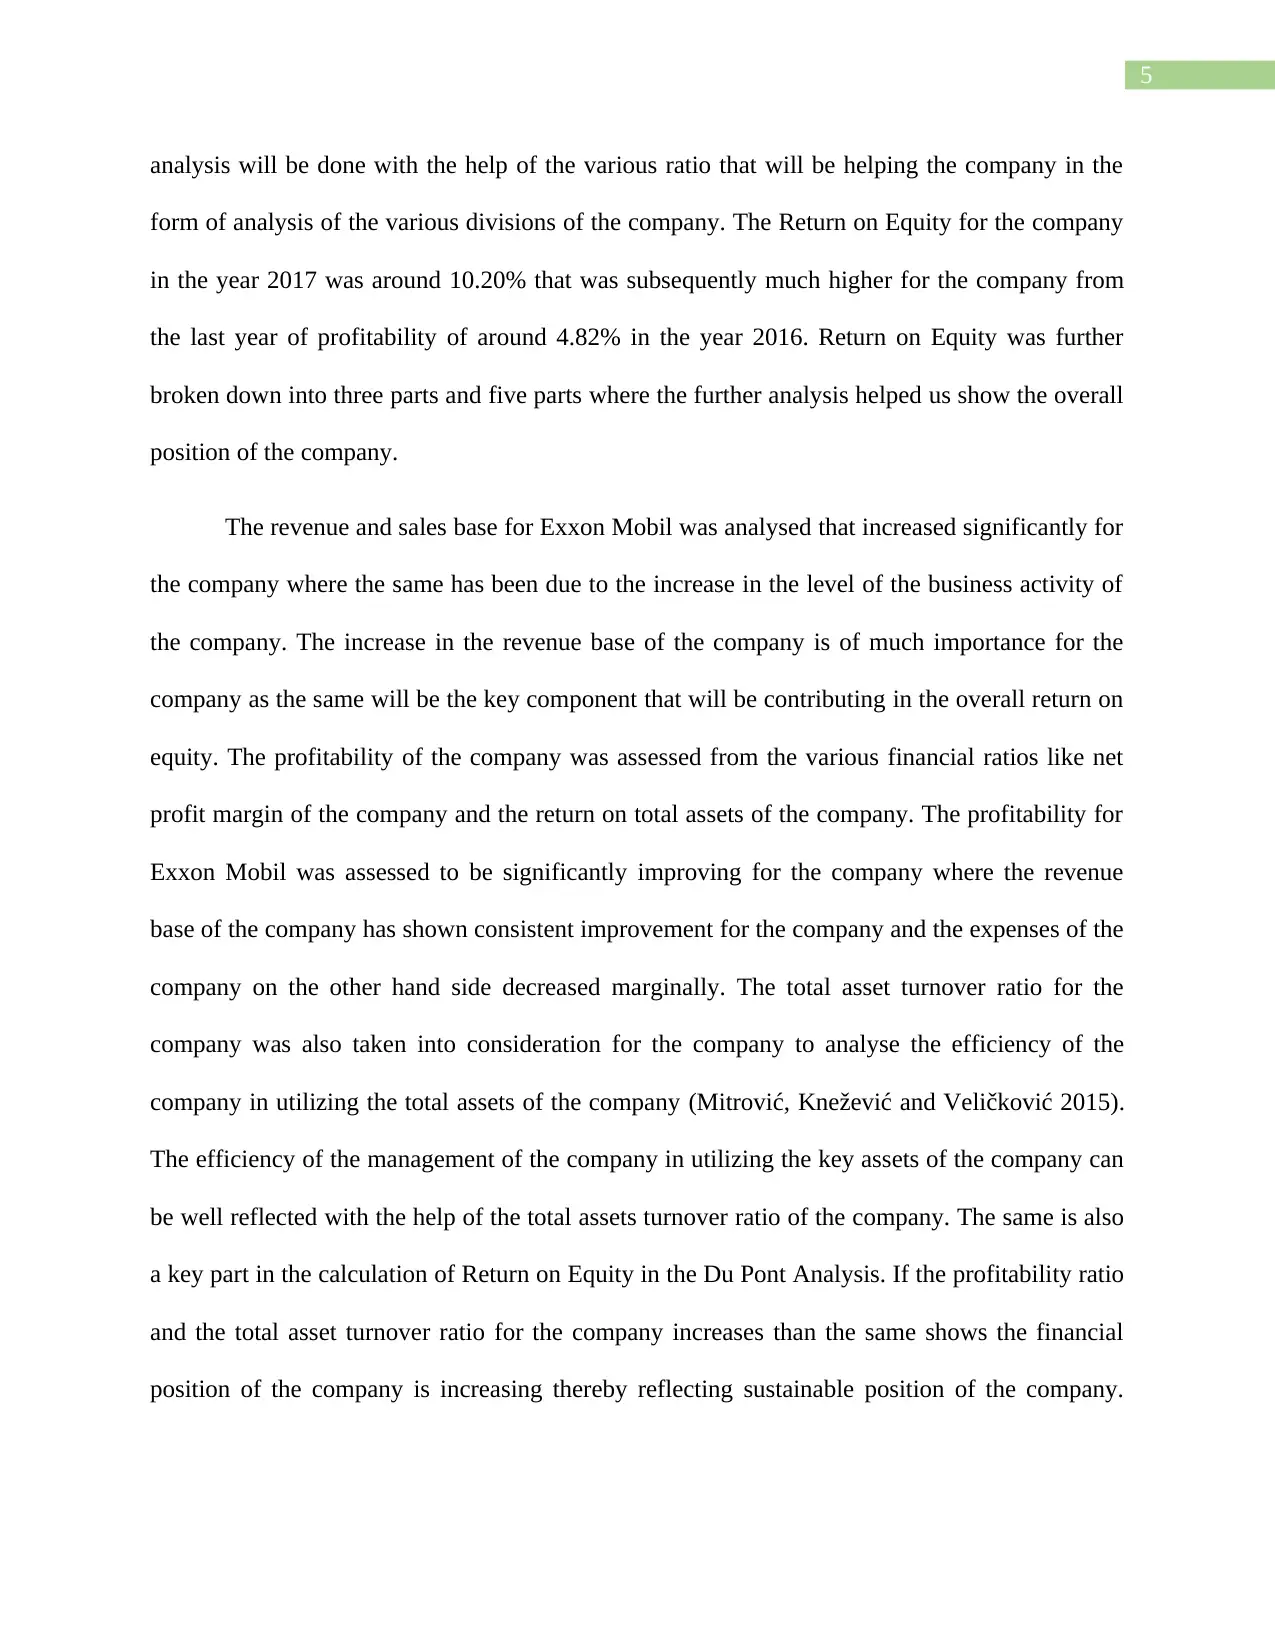
analysis will be done with the help of the various ratio that will be helping the company in the
form of analysis of the various divisions of the company. The Return on Equity for the company
in the year 2017 was around 10.20% that was subsequently much higher for the company from
the last year of profitability of around 4.82% in the year 2016. Return on Equity was further
broken down into three parts and five parts where the further analysis helped us show the overall
position of the company.
The revenue and sales base for Exxon Mobil was analysed that increased significantly for
the company where the same has been due to the increase in the level of the business activity of
the company. The increase in the revenue base of the company is of much importance for the
company as the same will be the key component that will be contributing in the overall return on
equity. The profitability of the company was assessed from the various financial ratios like net
profit margin of the company and the return on total assets of the company. The profitability for
Exxon Mobil was assessed to be significantly improving for the company where the revenue
base of the company has shown consistent improvement for the company and the expenses of the
company on the other hand side decreased marginally. The total asset turnover ratio for the
company was also taken into consideration for the company to analyse the efficiency of the
company in utilizing the total assets of the company (Mitrović, Knežević and Veličković 2015).
The efficiency of the management of the company in utilizing the key assets of the company can
be well reflected with the help of the total assets turnover ratio of the company. The same is also
a key part in the calculation of Return on Equity in the Du Pont Analysis. If the profitability ratio
and the total asset turnover ratio for the company increases than the same shows the financial
position of the company is increasing thereby reflecting sustainable position of the company.
⊘ This is a preview!⊘
Do you want full access?
Subscribe today to unlock all pages.
Trusted by 1+ million students worldwide
6
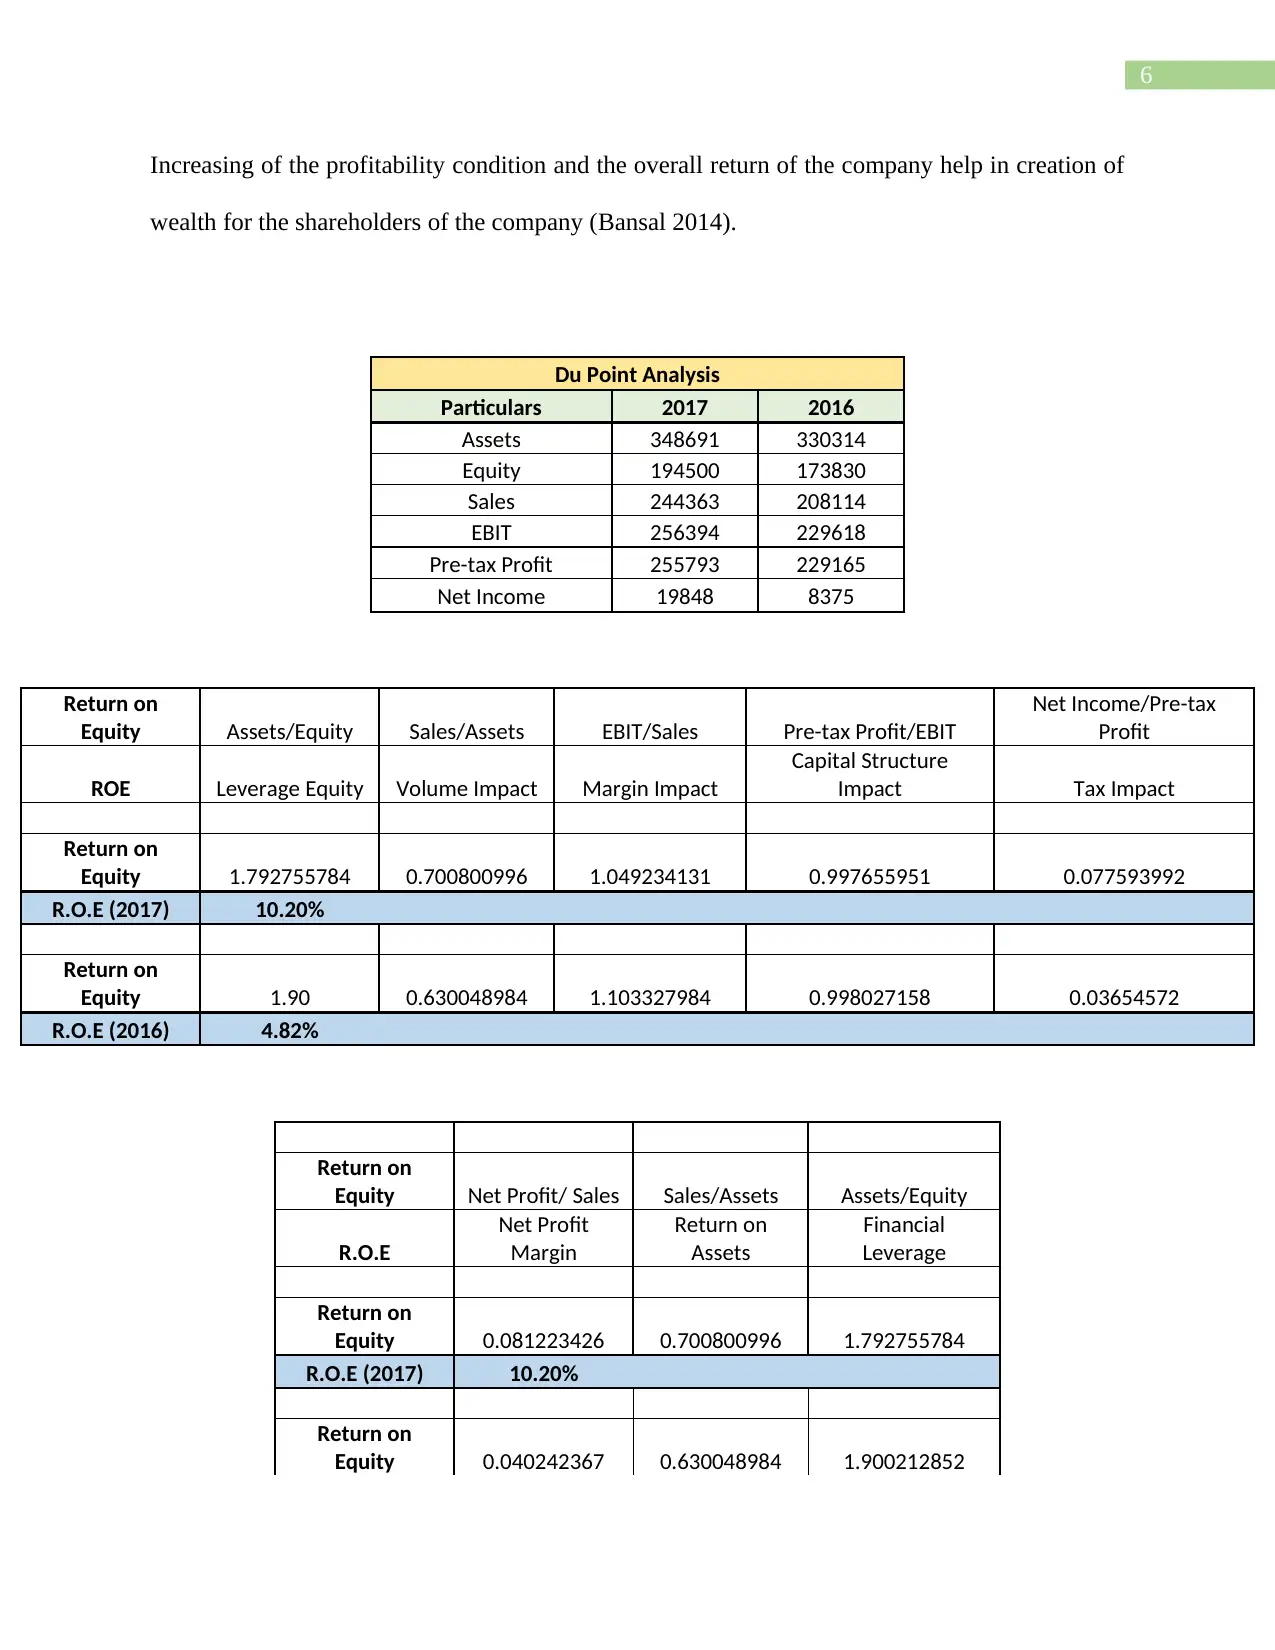
Increasing of the profitability condition and the overall return of the company help in creation of
wealth for the shareholders of the company (Bansal 2014).
Du Point Analysis
Particulars 2017 2016
Assets 348691 330314
Equity 194500 173830
Sales 244363 208114
EBIT 256394 229618
Pre-tax Profit 255793 229165
Net Income 19848 8375
Return on
Equity Assets/Equity Sales/Assets EBIT/Sales Pre-tax Profit/EBIT
Net Income/Pre-tax
Profit
ROE Leverage Equity Volume Impact Margin Impact
Capital Structure
Impact Tax Impact
Return on
Equity 1.792755784 0.700800996 1.049234131 0.997655951 0.077593992
R.O.E (2017) 10.20%
Return on
Equity 1.90 0.630048984 1.103327984 0.998027158 0.03654572
R.O.E (2016) 4.82%
Return on
Equity Net Profit/ Sales Sales/Assets Assets/Equity
R.O.E
Net Profit
Margin
Return on
Assets
Financial
Leverage
Return on
Equity 0.081223426 0.700800996 1.792755784
R.O.E (2017) 10.20%
Return on
Equity 0.040242367 0.630048984 1.900212852
Paraphrase This Document
Need a fresh take? Get an instant paraphrase of this document with our AI Paraphraser
7
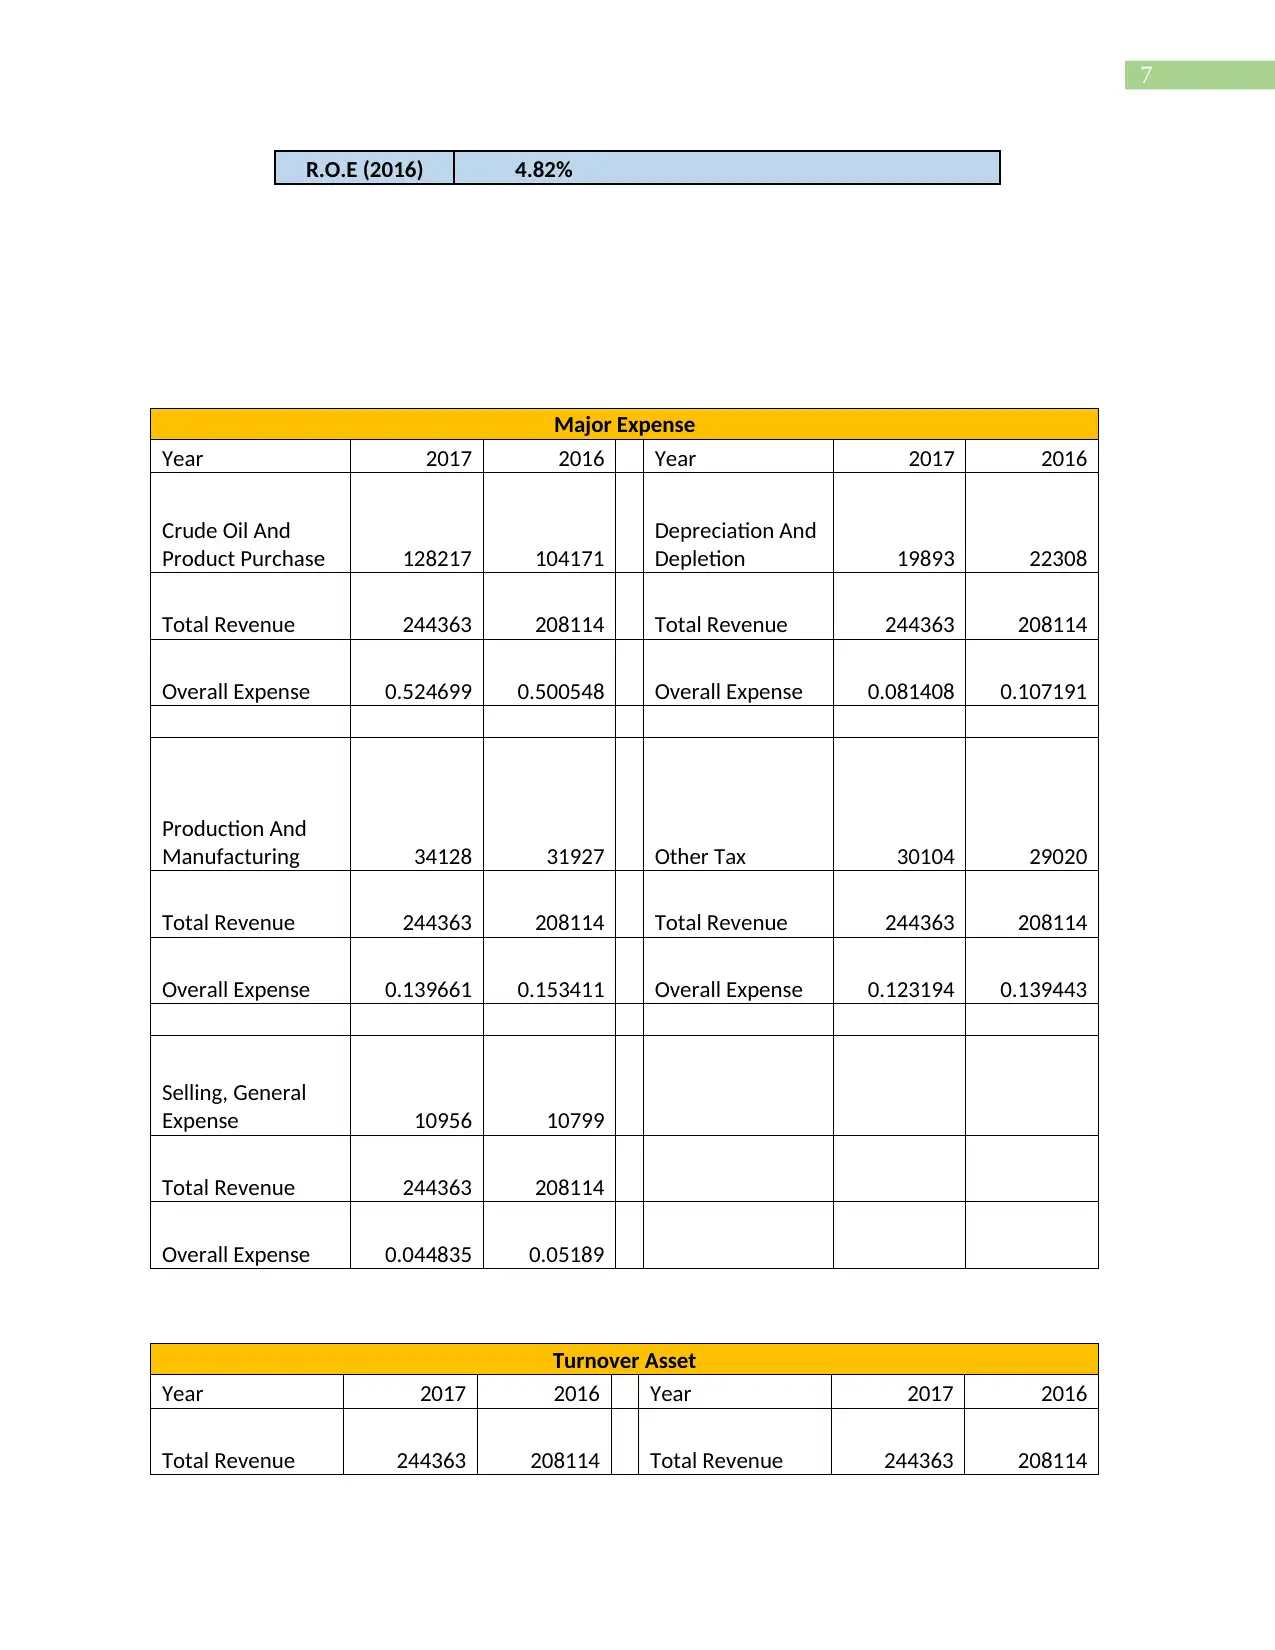
R.O.E (2016) 4.82%
Major Expense
Year 2017 2016 Year 2017 2016
Crude Oil And
Product Purchase 128217 104171
Depreciation And
Depletion 19893 22308
Total Revenue 244363 208114 Total Revenue 244363 208114
Overall Expense 0.524699 0.500548 Overall Expense 0.081408 0.107191
Production And
Manufacturing 34128 31927 Other Tax 30104 29020
Total Revenue 244363 208114 Total Revenue 244363 208114
Overall Expense 0.139661 0.153411 Overall Expense 0.123194 0.139443
Selling, General
Expense 10956 10799
Total Revenue 244363 208114
Overall Expense 0.044835 0.05189
Turnover Asset
Year 2017 2016 Year 2017 2016
Total Revenue 244363 208114 Total Revenue 244363 208114
8
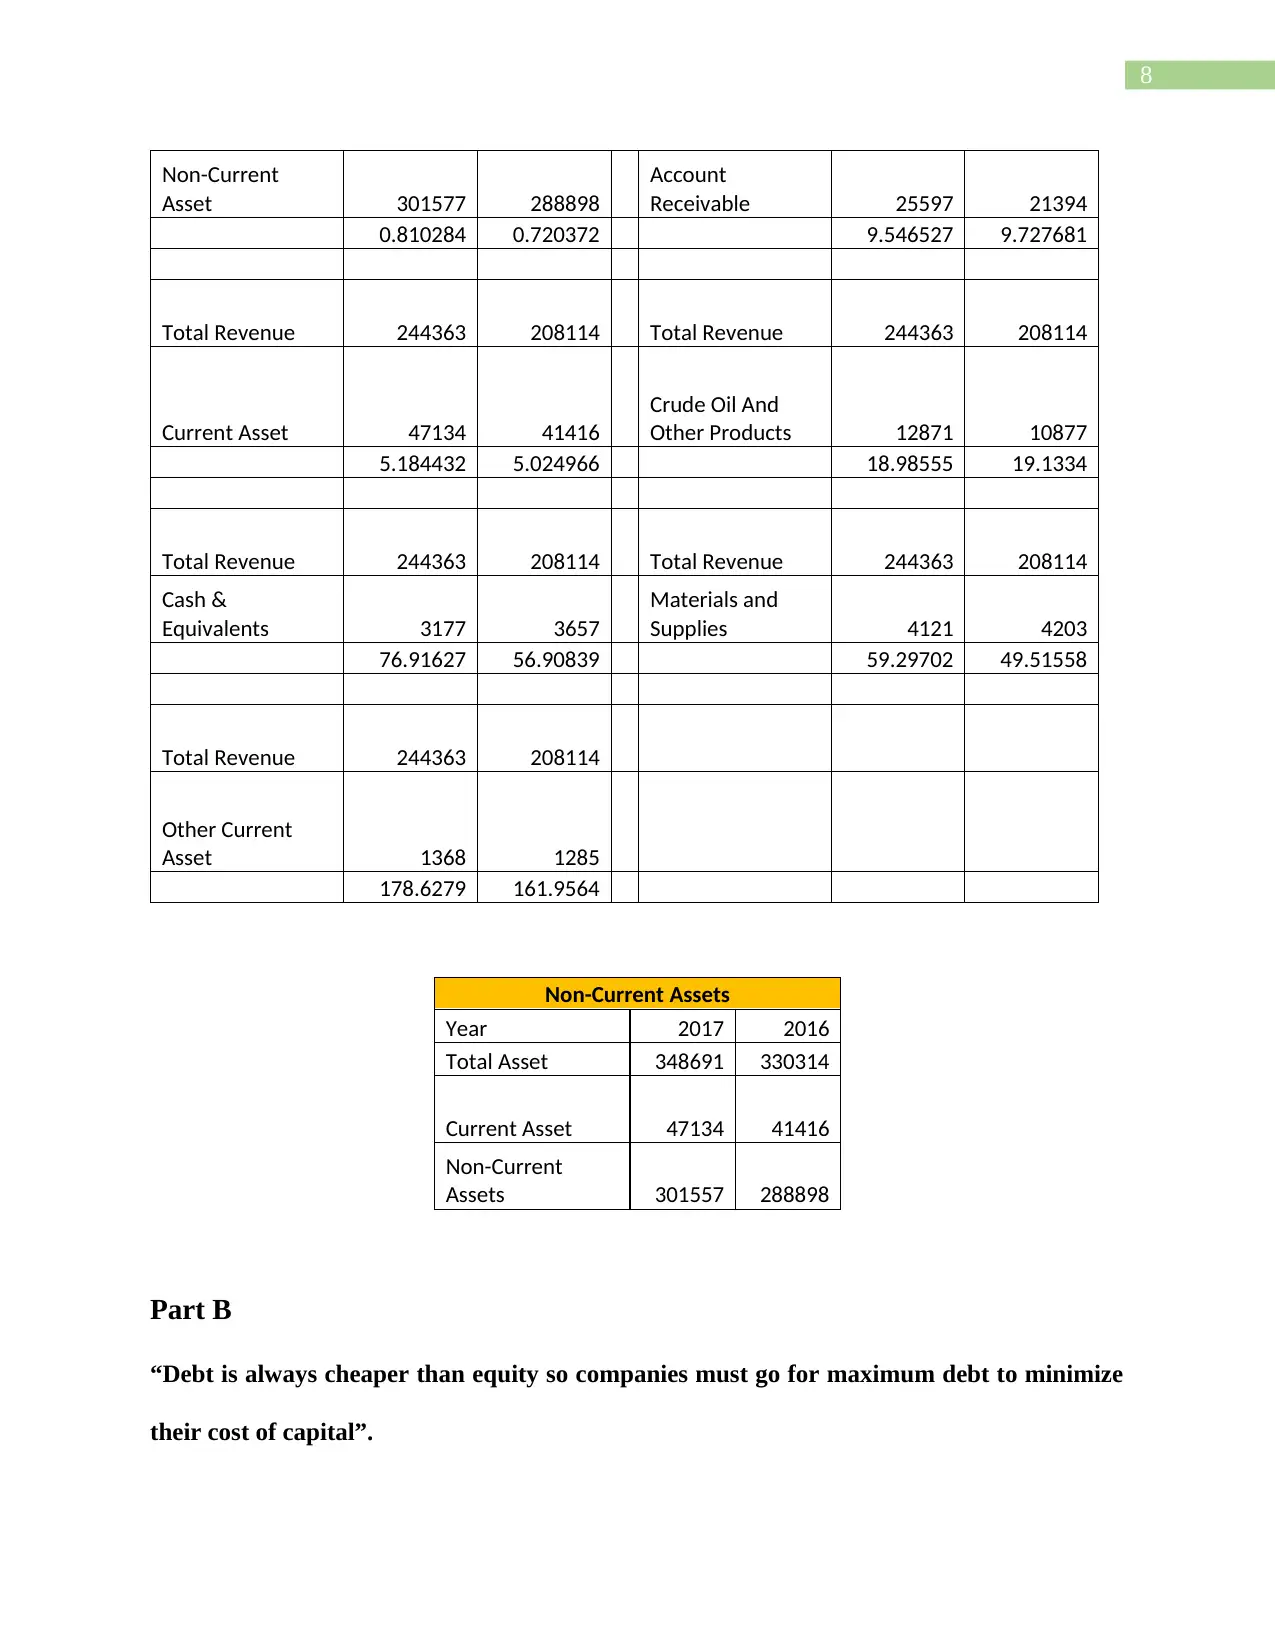
Non-Current
Asset 301577 288898
Account
Receivable 25597 21394
0.810284 0.720372 9.546527 9.727681
Total Revenue 244363 208114 Total Revenue 244363 208114
Current Asset 47134 41416
Crude Oil And
Other Products 12871 10877
5.184432 5.024966 18.98555 19.1334
Total Revenue 244363 208114 Total Revenue 244363 208114
Cash &
Equivalents 3177 3657
Materials and
Supplies 4121 4203
76.91627 56.90839 59.29702 49.51558
Total Revenue 244363 208114
Other Current
Asset 1368 1285
178.6279 161.9564
Non-Current Assets
Year 2017 2016
Total Asset 348691 330314
Current Asset 47134 41416
Non-Current
Assets 301557 288898
Part B
“Debt is always cheaper than equity so companies must go for maximum debt to minimize
their cost of capital”.
Non-Current
Asset 301577 288898
Account
Receivable 25597 21394
0.810284 0.720372 9.546527 9.727681
Total Revenue 244363 208114 Total Revenue 244363 208114
Current Asset 47134 41416
Crude Oil And
Other Products 12871 10877
5.184432 5.024966 18.98555 19.1334
Total Revenue 244363 208114 Total Revenue 244363 208114
Cash &
Equivalents 3177 3657
Materials and
Supplies 4121 4203
76.91627 56.90839 59.29702 49.51558
Total Revenue 244363 208114
Other Current
Asset 1368 1285
178.6279 161.9564
Non-Current Assets
Year 2017 2016
Total Asset 348691 330314
Current Asset 47134 41416
Non-Current
Assets 301557 288898
Part B
“Debt is always cheaper than equity so companies must go for maximum debt to minimize
their cost of capital”.
⊘ This is a preview!⊘
Do you want full access?
Subscribe today to unlock all pages.
Trusted by 1+ million students worldwide
9
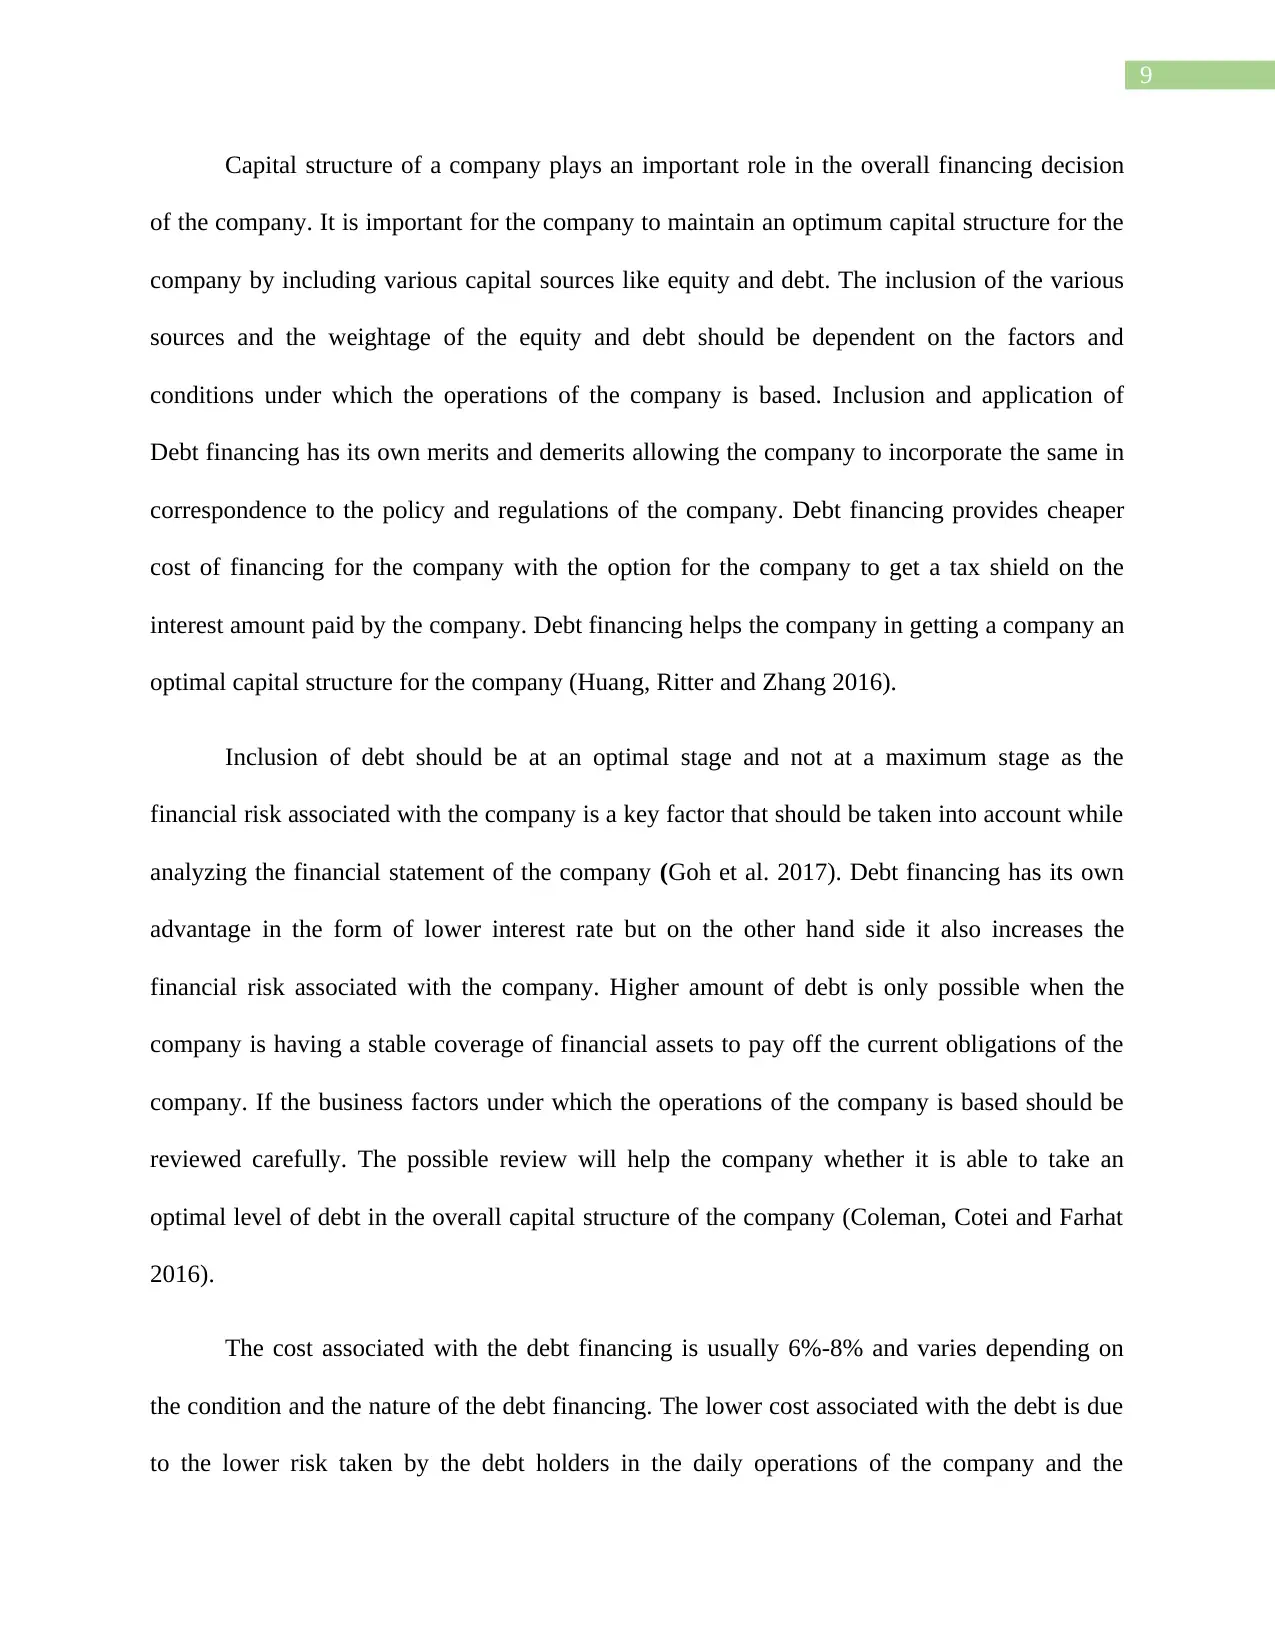
Capital structure of a company plays an important role in the overall financing decision
of the company. It is important for the company to maintain an optimum capital structure for the
company by including various capital sources like equity and debt. The inclusion of the various
sources and the weightage of the equity and debt should be dependent on the factors and
conditions under which the operations of the company is based. Inclusion and application of
Debt financing has its own merits and demerits allowing the company to incorporate the same in
correspondence to the policy and regulations of the company. Debt financing provides cheaper
cost of financing for the company with the option for the company to get a tax shield on the
interest amount paid by the company. Debt financing helps the company in getting a company an
optimal capital structure for the company (Huang, Ritter and Zhang 2016).
Inclusion of debt should be at an optimal stage and not at a maximum stage as the
financial risk associated with the company is a key factor that should be taken into account while
analyzing the financial statement of the company (Goh et al. 2017). Debt financing has its own
advantage in the form of lower interest rate but on the other hand side it also increases the
financial risk associated with the company. Higher amount of debt is only possible when the
company is having a stable coverage of financial assets to pay off the current obligations of the
company. If the business factors under which the operations of the company is based should be
reviewed carefully. The possible review will help the company whether it is able to take an
optimal level of debt in the overall capital structure of the company (Coleman, Cotei and Farhat
2016).
The cost associated with the debt financing is usually 6%-8% and varies depending on
the condition and the nature of the debt financing. The lower cost associated with the debt is due
to the lower risk taken by the debt holders in the daily operations of the company and the
Paraphrase This Document
Need a fresh take? Get an instant paraphrase of this document with our AI Paraphraser
10
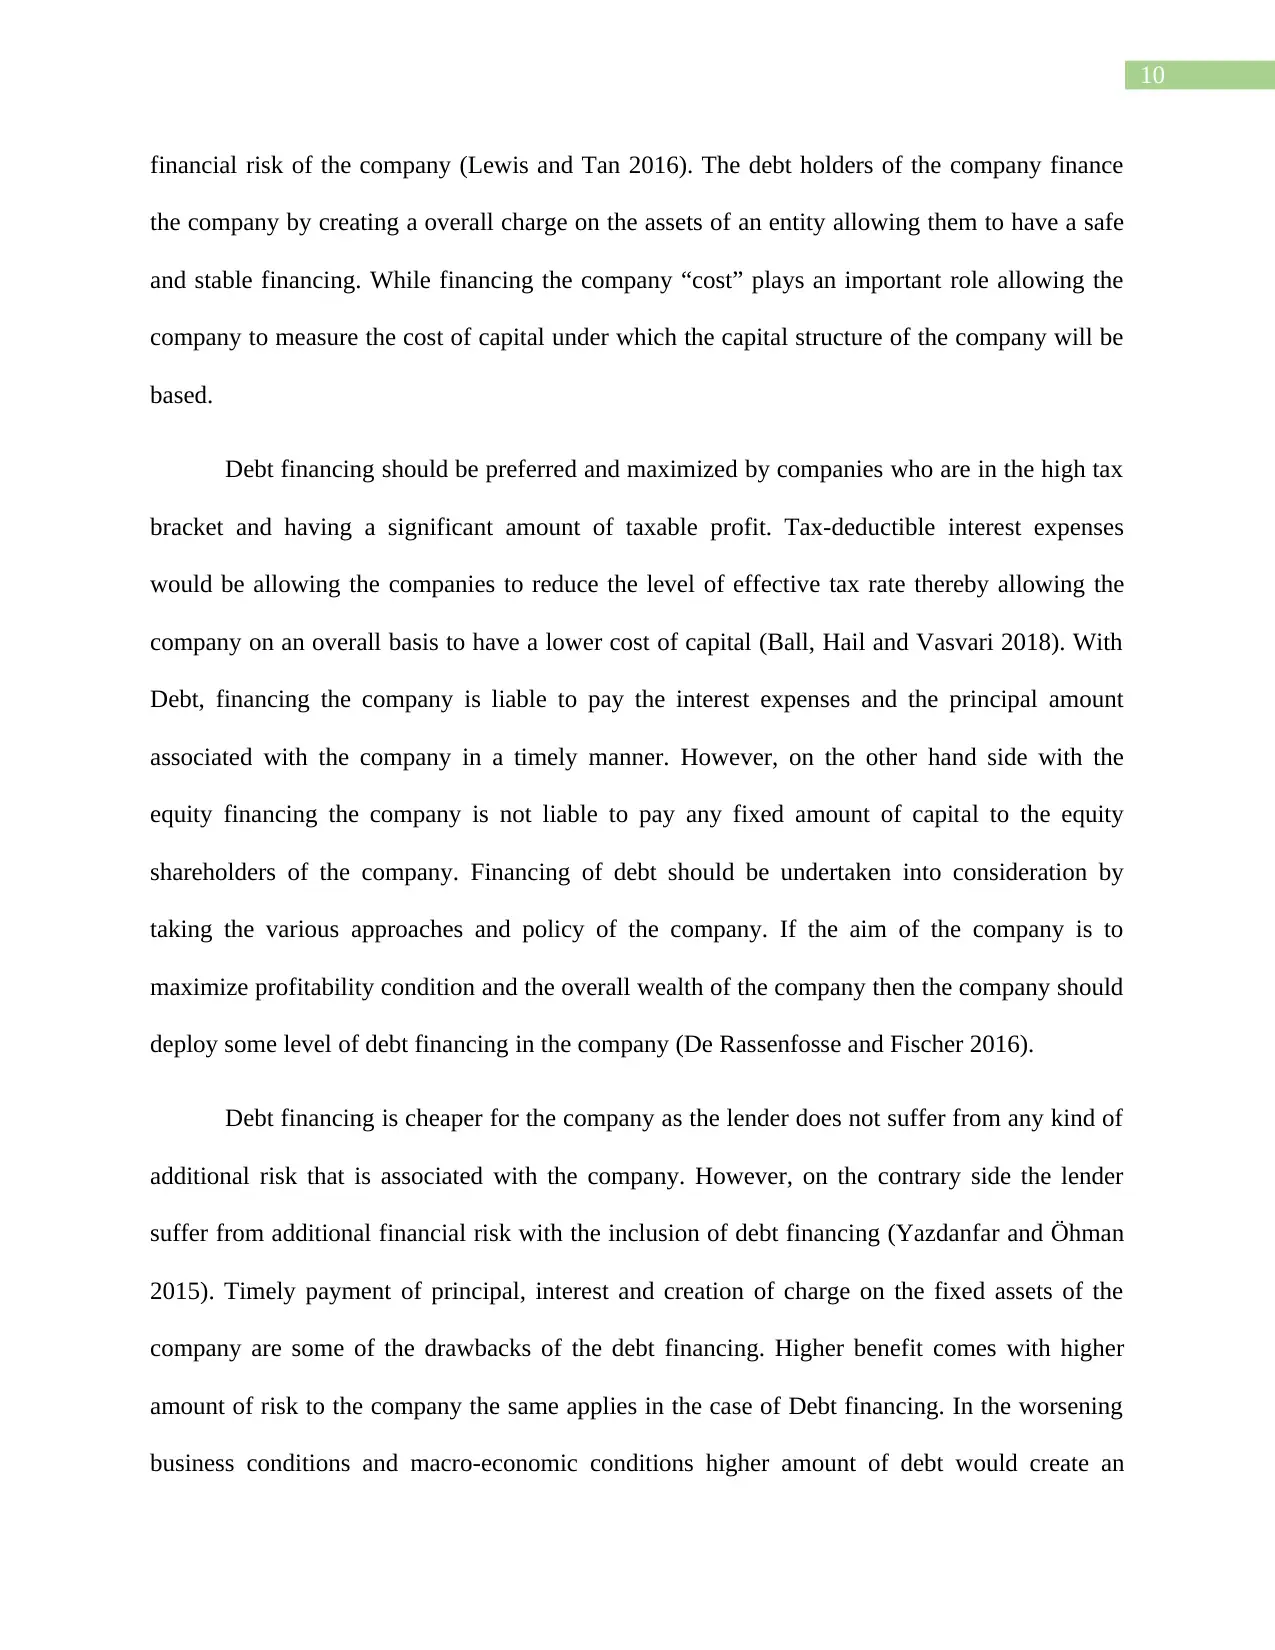
financial risk of the company (Lewis and Tan 2016). The debt holders of the company finance
the company by creating a overall charge on the assets of an entity allowing them to have a safe
and stable financing. While financing the company “cost” plays an important role allowing the
company to measure the cost of capital under which the capital structure of the company will be
based.
Debt financing should be preferred and maximized by companies who are in the high tax
bracket and having a significant amount of taxable profit. Tax-deductible interest expenses
would be allowing the companies to reduce the level of effective tax rate thereby allowing the
company on an overall basis to have a lower cost of capital (Ball, Hail and Vasvari 2018). With
Debt, financing the company is liable to pay the interest expenses and the principal amount
associated with the company in a timely manner. However, on the other hand side with the
equity financing the company is not liable to pay any fixed amount of capital to the equity
shareholders of the company. Financing of debt should be undertaken into consideration by
taking the various approaches and policy of the company. If the aim of the company is to
maximize profitability condition and the overall wealth of the company then the company should
deploy some level of debt financing in the company (De Rassenfosse and Fischer 2016).
Debt financing is cheaper for the company as the lender does not suffer from any kind of
additional risk that is associated with the company. However, on the contrary side the lender
suffer from additional financial risk with the inclusion of debt financing (Yazdanfar and Öhman
2015). Timely payment of principal, interest and creation of charge on the fixed assets of the
company are some of the drawbacks of the debt financing. Higher benefit comes with higher
amount of risk to the company the same applies in the case of Debt financing. In the worsening
business conditions and macro-economic conditions higher amount of debt would create an
11
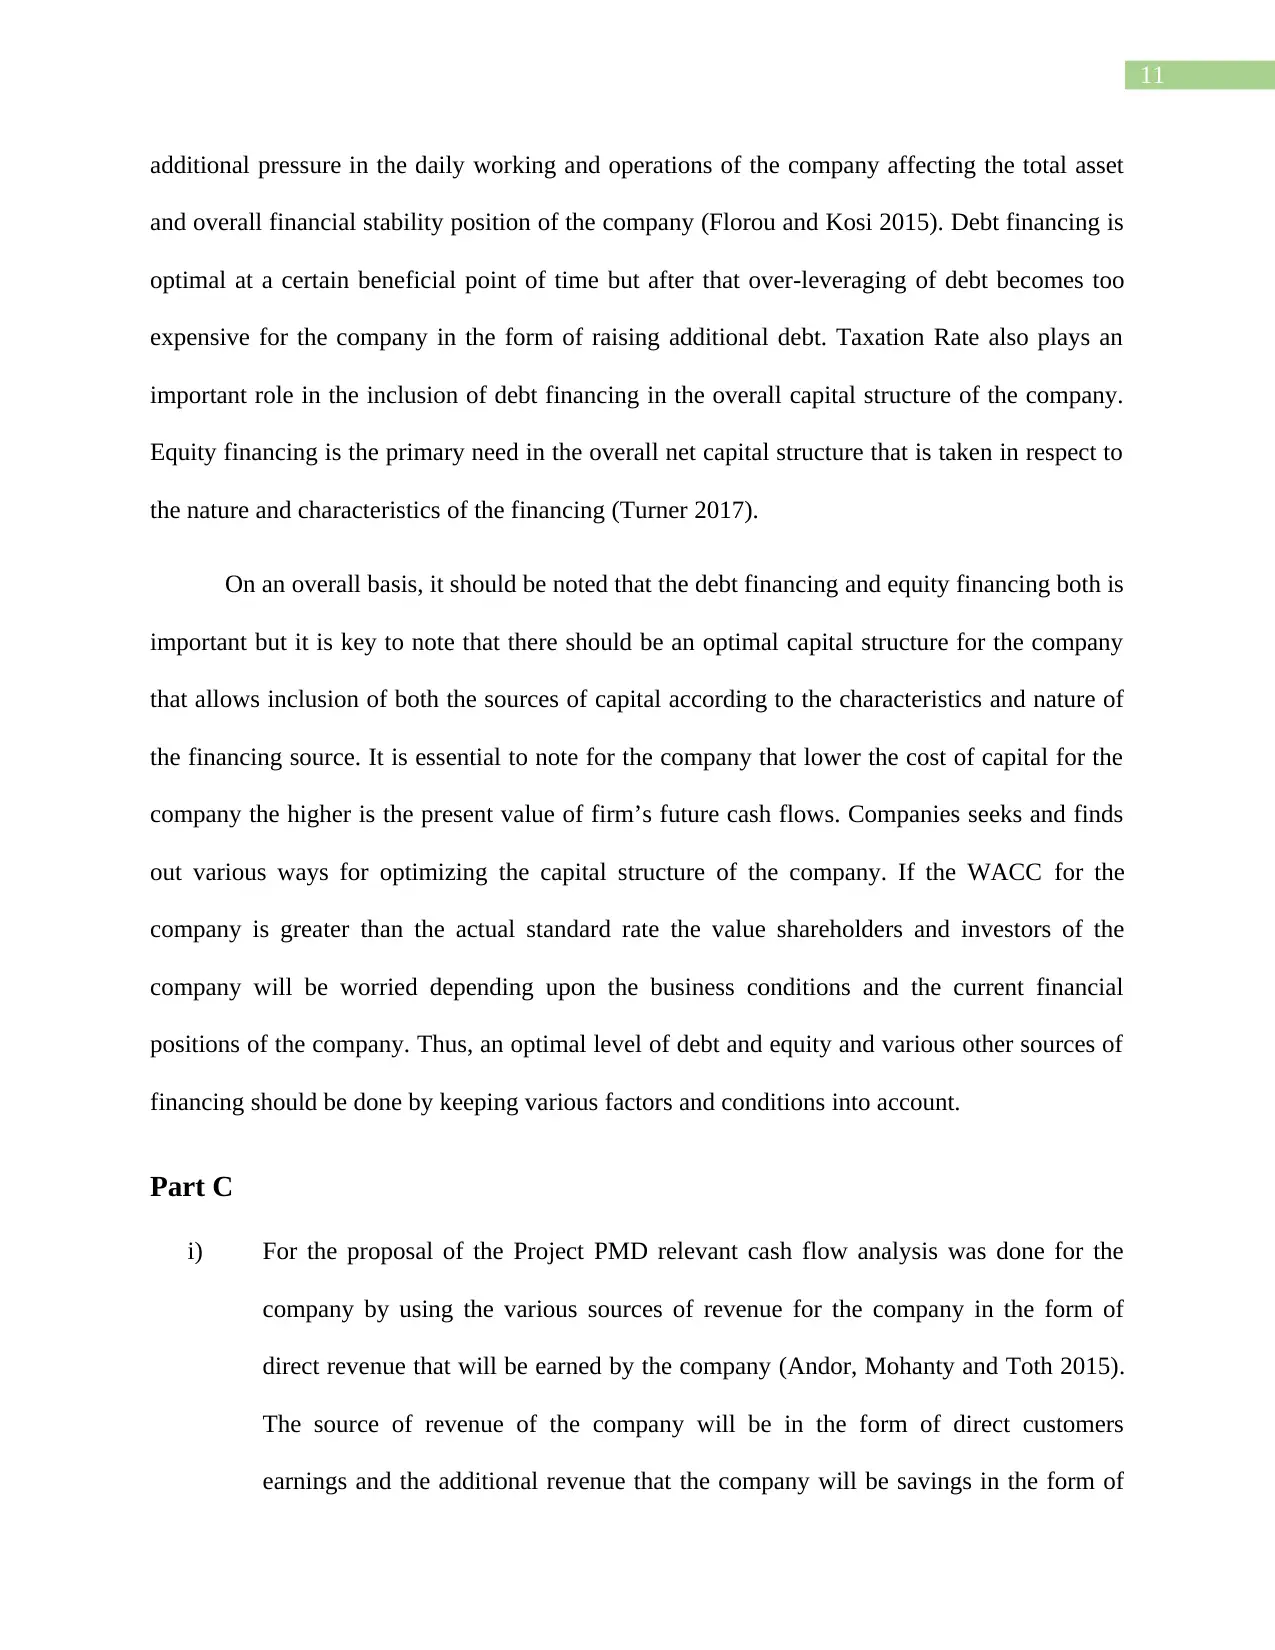
additional pressure in the daily working and operations of the company affecting the total asset
and overall financial stability position of the company (Florou and Kosi 2015). Debt financing is
optimal at a certain beneficial point of time but after that over-leveraging of debt becomes too
expensive for the company in the form of raising additional debt. Taxation Rate also plays an
important role in the inclusion of debt financing in the overall capital structure of the company.
Equity financing is the primary need in the overall net capital structure that is taken in respect to
the nature and characteristics of the financing (Turner 2017).
On an overall basis, it should be noted that the debt financing and equity financing both is
important but it is key to note that there should be an optimal capital structure for the company
that allows inclusion of both the sources of capital according to the characteristics and nature of
the financing source. It is essential to note for the company that lower the cost of capital for the
company the higher is the present value of firm’s future cash flows. Companies seeks and finds
out various ways for optimizing the capital structure of the company. If the WACC for the
company is greater than the actual standard rate the value shareholders and investors of the
company will be worried depending upon the business conditions and the current financial
positions of the company. Thus, an optimal level of debt and equity and various other sources of
financing should be done by keeping various factors and conditions into account.
Part C
i) For the proposal of the Project PMD relevant cash flow analysis was done for the
company by using the various sources of revenue for the company in the form of
direct revenue that will be earned by the company (Andor, Mohanty and Toth 2015).
The source of revenue of the company will be in the form of direct customers
earnings and the additional revenue that the company will be savings in the form of
⊘ This is a preview!⊘
Do you want full access?
Subscribe today to unlock all pages.
Trusted by 1+ million students worldwide
1 out of 20
Related Documents


Your All-in-One AI-Powered Toolkit for Academic Success.
+13062052269
info@desklib.com
Available 24*7 on WhatsApp / Email
![[object Object]](/_next/static/media/star-bottom.7253800d.svg)
Unlock your academic potential
Copyright © 2020–2026 A2Z Services. All Rights Reserved. Developed and managed by ZUCOL.